Improved relationship between left and right
ven-tricular electrical activation after cardiac
resynchro-nization therapy in heart failure patients can be
quantified by body surface potential mapping
Nelson Samesima,ICarlos Alberto Pastore,IIRoberto Andre´s Douglas,IIIMartino Martinelli Filho,IVAnı´sio A. PedrosaIV
IHospital das Clı´nicas da Faculdade de Medicina da Universidade de Sa˜o Paulo, Heart Institute (InCor), Sa˜o Paulo/SP, Brazil.IIHospital das Clı´nicas da Faculdade de Medicina da Universidade de Sa˜o Paulo, Heart Institute (InCor), Board of Directors, Sa˜o Paulo/SP, Brazil.IIIHospital das Clı´nicas da Faculdade de Medicina da Universidade de Sa˜o Paulo, Heart Institute (InCor), Electrocardiology, Sa˜o Paulo/SP, Brazil.IVHospital das Clı´nicas da Faculdade de Medicina da Universidade de Sa˜o Paulo, Heart Institute (InCor), Clinic of Pacemaker and Arrhythmias, Sa˜o Paulo/SP, Brazil.
OBJECTIVES:Few studies have evaluated cardiac electrical activation dynamics after cardiac resynchronization therapy. Although this procedure reduces morbidity and mortality in heart failure patients, many approaches attempting to identify the responders have shown that 30% of patients do not attain clinical or functional improvement. This study sought to quantify and characterize the effect of resynchronization therapy on the ventricular electrical activation of patients using body surface potential mapping, a noninvasive tool.
METHODS:This retrospective study included 91 resynchronization patients with a mean age of 61 years, left ventricle ejection fraction of 28%, mean QRS duration of 182 ms, and functional class III/IV (78%/22%); the patients underwent 87-lead body surface mapping with the resynchronization device on and off. Thirty-six patients were excluded. Body surface isochronal maps produced 87 maximal/mean global ventricular activation times with three regions identified. The regional activation times for right and left ventricles and their inter-regional right-to-left ventricle gradients were calculated from these results and analyzed. The Mann-Whitney U-test and Kruskall-Wallis test were used for comparisons, with the level of significance set atp#0.05. RESULTS:During intrinsic rhythms, regional ventricular activation times were significantly different (54.5 ms vs. 95.9 ms in the right and left ventricle regions, respectively). Regarding cardiac resynchronization, the maximal global value was significantly reduced (138 ms to 131 ms), and a downward variation of 19.4% in regional-left and an upward variation of 44.8% in regional-right ventricular activation times resulted in a significantly reduced inter-regional gradient (43.8 ms to 17 ms).
CONCLUSIONS: Body surface potential mapping in resynchronization patients yielded electrical ventricular activation times for two cardiac regions with significantly decreased global and regional-left values but significantly increased regional-right values, thus showing an attenuated inter-regional gradient after the cardiac resynchronization therapy.
KEYWORDS: Electrocardiography; Cardiac Resynchronization Therapy; Body Surface Potential Mapping; Heart Failure; Bundle-Branch Block; Ventricular Activation Time.
Samesima N, Pastore CA, Douglas RA, Martinelli Filho M, Pedrosa AA. Improved relationship between left and right ventricular electrical activation after cardiac resynchronization therapy in heart failure patients can be quantified by body surface potential mapping. Clinics. 2013;68(7):986-991.
Received for publication onMarch 1, 2013;First review completed onMarch 25, 2013;Accepted for publication onMarch 25, 2013 E-mail: [email protected]
Tel.: 55 11 2661-5658
& INTRODUCTION
Heart failure (HF) has become a major health problem worldwide, and its incidence has increased over the last 60 years (1-3). This increase can be largely attributed to an aging population and longer survival rates for patients because of novel treatment strategies, which have resulted in increased hospitalizations for HF patients (1-4). Cardiac resynchronization therapy (CRT), one of the non-pharma-cological approaches, has been responsible not only for
Copyrightß2013CLINICS– This is an Open Access article distributed under the terms of the Creative Commons Attribution Non-Commercial License (http:// creativecommons.org/licenses/by-nc/3.0/) which permits unrestricted non-commercial use, distribution, and reproduction in any medium, provided the original work is properly cited.
No potential conflict of interest was reported.
variables in these studies negated the prospect of using these measures of dyssynchrony to select patients for CRT (13-14). A comprehensive evaluation of the role played by electrocardiography in CRT had similarly inconclusive results (15). Furthermore, one previous electrophysiological study using electro-anatomical mapping found great varia-bility in the electrical and hemodynamic variables (16). Other investigators have used information extracted from electrodes inserted into the ventricles (during and after CRT) in an attempt to correlate the electrical data with both hemodynamic information and the clinical evolution of patients (17-19).
In addition, studies using different approaches in individuals with either left or right bundle-branch block have elucidated the behavior of cardiac electrical phenom-ena (20-22). Medvegy et al. elegantly summarized the resources offered by body surface potential mapping (BSPM) and its potential application by suggesting that Selvester diagrams be used for an anatomical distribution of electrodes on the body surface (23).
Despite the results of many studies reporting data from patients with resynchronization devices, researchers world-wide continue to search for a method that could determine which patients would respond better to CRT. Such a method should be simple, quick, reproducible, easily performed, pose low risk to patients, and of high accuracy.
Our study is part of a line of investigation that began in the mid-1990s when BSPM was first employed to study patients with left bundle-branch blocks (LBBB) (20) and was later used to study the effects of CRT in those patients. The initial study conducted by Pastore et al. (24), which analyzed BSPM findings with a clinically oriented inter-pretation of BSPM data from a population of patients who had undergone CRT, reported gradients of regional activation. Moreover, the BSPM methodology has emerged as an alternative, noninvasive approach for studies inves-tigating cardiac activation (24,25).
The present study was designed to quantify and obtain detailed characterization of the effect of CRT on ventricular electrical activation in patients with congestive heart failure using the noninvasive BSPM methodology.
& MATERIAL AND METHODS
Study population
We conducted a retrospective study of noninvasive BSPM performed in 91 non-consecutive patients who had under-gone CRT. BSPMs were performed in two settings: 1) after CRT implantation and 2) with the device turned off in native sinus rhythm+LBBB. The two BSPM examinations were performed within a maximum interval of 300 days (median time, 98 days). The final population included 55 patients, after 36 patients were excluded (exclusion criteria below).
congenital cardiopathy (n = 1) were excluded.
This study complied with the Declaration of Helsinki and was approved by the Institutional Review Board of the Heart Institute (InCor-HC-FMUSP).
Body surface potential mapping (BSPM)
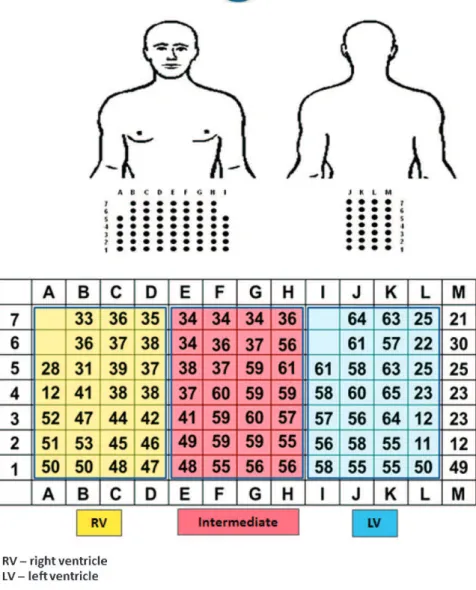
The 87 unipolar electrodes of the Fukuda Denshi model 7100 BSPM equipment (Fukuda Denshi Co., Ltd., Tokyo, Japan) were attached to adhesive strips, distributed over the anterior chest (59 leads) and back (28 leads), and recorded simultaneously. Electrical potentials were digitized, pro-cessed, and visualized at the BSPM matrix as PQRST complexes distributed according to the lead system orienta-tion. The potentials were also indexed using letters and numbers, with each strip corresponding to a letter (A through I on the chest and J through M on the back) and numbers one to seven corresponding to the lines) (Figure 1). This system was used to assess traditional electrovector-cardiographic variables (i.e., the rhythm, PR interval, axes, QRS complex width, and orientation and direction of loops in the horizontal and frontal planes). Additionally, this software enables the acquisition of other cardiac electrical data, such as a map of the isochronal lines and ventricular activation times, as described below.
The isochronal lines of activation provided by the body surface potential mapping are based on the QRS complex duration values. During the process of electrocardiographic data acquisition, one of the QRS complexes is selected to guide the acquisition of the QRS complex durations in all 87 leads. By positioning the two cursors available on the display, one at the onset and the other at the end of the chosen QRS complex in each lead, these measurements are semi-automatically performed. Then, it is possible to quantify the QRS complex width for all 87 leads. With these point-by-point measurements, the entire electrical process of the QRS complex can be studied. If we assume that the QRS complex duration is obtained, it is then possible to interpret the meaning of such values as the quantification of the ventricular electrical activation. Thus, the analysis of the 87 QRS complex duration values enables the temporal visualization of the path that an electrical stimulus has travelled through the ventricles, and it is also possible to identify the leads in which the QRS complex was generated the fastest and slowest.
duration obtained from the 87 leads in our study with the knowledge of a typical LBBB activation pattern, we could associate these three distinct areas with the right ventricle (RV) region, an intermediate region, and the left ventricle (LV) region (Figure 1).
Therefore, the moments in which the different regions within the myocardium were activated could be character-ized, which meant that we were able to observe and regionalize the ventricular electrical activation process.
Because the intermediate region identified may comprise areas that relate to the right ventricle and other areas that relate to the left ventricle, we decided to measure and analyze only two regions: those with electrical characteristics that are typical of the right ventricle or the left ventricle.
Global and regional ventricular activation time (VAT) values and inter-regional gradients were calculated accord-ing to the BSPM maps, first duraccord-ing biventricular pacaccord-ing with CRT on and then in the intrinsic rhythm (sinus rhythm +LBBB) with the resynchronization device off.
The maximal global VAT was collected based on the maximal values obtained in the 87 leads, and mean global VAT was obtained by calculating the arithmetical average of all 87 values.
Second, we measured the regional ventricular activation times, which were calculated based on the VAT values in the regions described above. The VAT mean values for the right ventricle (RV) and left ventricle (LV) regions were obtained by arithmetically averaging the VAT values from the 26 leads apportioned to the RV region and the VAT values from the 26 leads apportioned to the LV region (Figure 1).
The inter-regional gradients were calculated based on the difference between the regional mean RV and LV values described above.
These three sets of variables allowed us to better characterize the global, regional, and inter-regional behavior of the ventricular electrical activation sequence during both the intrinsic rhythm (sinus rhythm + LBBB) and atrio-biventricular (BIV) pacing.
After obtaining these measures, we were able to analyze the impact of CRT on ventricular electrical activation by calculating the percentage of variation in the VAT values. This measurement revealed the changes promoted by CRT and was calculated as follows:
variation = {[VAT in BIV pacing]-[VAT in sinus rhythm+LBBB]}6[100]/[VAT in sinus rhythm+LBBB].
and the Kruskal-Wallis test. The level of significance was established atp#0.05.
& RESULTS
The following clinical characteristics were observed for the 55 patients included in this study: mean age, 61¡10 years; 60% (n = 33) male; etiology of HF as predominantly idiopathic (51%, n = 28), ischemic (20%, n = 11), chagasic (14.5%, n = 8), or hypertensive (14.5%, n = 8); mean left ventricle ejection fraction, 0.28¡0.09; mean QRS duration, 182¡24 ms; and New York Heart Association functional class III (78%, n = 43) and IV (22%, n = 12).
Table 1 displays the ventricular electrical activation development (in ms) for the two settings with and without CRT action (medians and max-min values). The effect of CRT is shown in terms of variation in the study variables and the respective significance level.
The maximal global VAT in sinus rhythm+LBBB was prolonged (138 ms) in comparison to the CRT-on situation (131 ms). However, the mean global VAT showed the opposite trend, with a nearly 10% increase during biven-tricular pacing (64.8 ms vs. 70.5 ms).
An analysis of the regional ventricular electrical activation revealed significant differences between the two areas during the intrinsic rhythm. There was also a considerable delay between the activations of the LV and RV regions (95.9 ms vs. 54.5 ms, p,0.001). During CRT, these differ-ences were less pronounced, with an increased RV (78.9 ms) and decreased LV regional value (77.3 ms) (Figure 2). In addition, note that we observed almost simultaneous activation of the RV and LV regions during CRT.
Inter-regional relationships during intrinsic rhythm+LBBB showed significant delay between the LV-RV regions (43.8 ms) (p,0.001), which were attenuated by CRT. The analysis of inter-regional gradients characterized this phe-nomenon by showing significantly reduced LV-RV delay (17.0 ms) (Figure 3).
Finally, the results of the percentage variation highlighted the impact of CRT on ventricular electrical activation, as we found that the maximal global VAT was reduced by 5.1%, but the mean global VAT was increased by 8.8% with CRT.
Furthermore, the regional analysis showed that the CRT effect increased the VAT value of the RV region by 44.8%, while the VAT of the LV region was decreased by 19.4% (Figure 4). Consequently, we observed a significant reduc-tion (61.2%) in the inter-regional LV-RV gradient (Figure 5).
& DISCUSSION
Many studies have been conducted to better understand the cardiac electromechanical phenomenon in patients indicated for CRT, with the goal of reducing the number of non-responders.
In the present study, we quantitatively characterized the ventricular electrical activation in a patient population implanted with CRT. Therefore, we analyzed the global and regional ventricular activation times as well as the inter-regional gradients. In addition, we obtained the measure-ments for the percentage variation in the VAT values, which enabled us to better understand how CRT works from an electrical perspective.
During intrinsic rhythm+LBBB, we were able to quantify the significantly increased (80%) regional-LV VAT value. Thus, we observed a prolonged inter-regional LV-RV gradient.
Therefore, BSPM could assess the typical electrocardio-graphic presentation of an LBBB conduction disorder, which, according to our findings, demonstrated a maximal global ventricular activation time.120 ms, a mean global VAT .60 ms, and a greater regional-LV VAT value compared to the regional-RV VAT value.
Two studies investigating the electrical activation of individuals with LBBB used electro anatomical mapping for such characterizations (21,22). Using a different metho-dology may explain why these studies were unable to provide a clear discrimination or quantification of the time when activation occurs in the right ventricle, intermediate, and left ventricle regions. The relationships between those
Table 1 -Ventricular electrical activation development (in milliseconds).
Sinus rhythm+LBBB Biventricular Pacing Variation p-value
Median Min-Max Median Min-Max
Maximal Global VAT 138 106-139 131 60-225 Q5.1% 0.007
Mean Global VAT 64.8 48.1-87.8 70.5 25.3-98.2 q8.8% ns
RV Regional VAT 54.5 21.7-86.9 78.9 20.0-126.5 q44.8% 0.001
LV Regional VAT 95.9 47.3-123.4 77.3 21.9-119.2 Q19.4% 0.001
Inter-regional LV-RV gradients 43.8 0.08-96.00 17.0 0.38-46.12 Q61.2% 0.001
LBBB= left bundle-branch block;LV= left ventricle;ns= not significant;RV= right ventricle;VAT= ventricular activation time.
regions were also unclear, as both studies showed sig-nificantly delayed activation of the LV in relation to that of the RV, ranging from 89 ms to 110 ms, which agrees with the value described and quantified in our study. In addition, the study by Fantoni et al. (22) was the only one in which a mean activation time of 75 ms could be inferred for the RV, which aligned with our results.
Regarding biventricular pacing, we were able to quantify values for the global and regional VATs and inter-regional gradients, which may facilitate understanding of the electrical phenomena that occur during CRT.
A significant reduction in the maximal global VAT to 131 ms was observed when the resynchronization device was on, albeit with a slight rise in the mean global VAT to 70.5 ms. This global VAT behavior can likely be fully explained by the changes that occur in regional VATs during biventricular pacing. In addition, under CRT, the regional-LV VAT was shortened by nearly 20%. Note that under the influence of LBBB, the maximal global VAT reflects the extremely long activation times in the left ventricle; therefore, the decrease in regional-LV VAT during CRT was associated with the concomitant decrease in maximal global VAT. However, we observed that the regional-RV VAT was nearly 45% further delayed during biventricular pacing. The increase in mean regional-RV VAT greatly surpassed the amount by which the regional-LV VAT was reduced, which indicates that the increase in mean global VAT during biventricular pacing reflects this phenomenon. Moreover, the goal of CRT (i.e., restoring the ventricular mechanics and reestablishing synchroniza-tion of the ventricles) allows better understanding of these
electrical phenomena. Moreover, this synchrony (or dyssyn-chrony) can be better evaluated according to the temporal relationships between the ventricular regions (inter-regional gradients).
Contrary to what we found during sinus rhythm+LBBB, biventricular pacing led to a significant 61.2% reduction in the interventricular delay, which we termed the inter-regional LV-RV gradient. This reduction provides evidence that under CRT, the time of LV activation approaches that of RV activation.
Varma et al. (25) showed that CRT led to activation times of 63.0 ms and 83.5 ms for the RV and LV, respectively, which were similar to those reported in the present study. Varma et al. also reported a clear change in activation of both the RV (increasing from 37 ms to 63 ms) and LV (decreasing from 113 ms to 83.5 ms) after resynchroniza-tion, and these values were also quite similar to those observed in our study. Furthermore, both in this previous study and in our study, the RV ventricular activation time approached that of LV. Pratola et al. (16), who found a total activation time of 68.5 ms during biventricular pacing, which aligned with our mean global VAT value of 70.5 ms. In 2010, Sassone et al. (19) reported a measurement termed RVLV interlead electrical delay, which represented the time difference between intracavitary electrograms obtained from the right ventricle lead in relation to the left ventricle lead at the end of the resynchronization device implantation. Although these authors used a distinct methodology, their results were similar to our inter-regional LV-RV gradient. After a six-month follow-up period, these authors also found a significantly reduced value in the responder group (22.1 ms vs. 43.6 ms). In our study, the inter-regional LV-RV gradient of 17 ms obtained during biventricular pacing may be used to guide the placement of ventricular electrodes to adjust the interventricular pacing delay and help identify the individuals who will receive the most benefit from CRT.
We calculated the VAT variation to assess the behavior of ventricular activation times during CRT. This measurement quantifies the CRT effect upon the ventricular electrical activation process, which shortened the time difference between activation of the left and right ventricles.
The above results indicate that, from the electrical standpoint, CRT attempted to restore the coupling of the ventricles in the hearts, which did not occur under LBBB. This coupling was enabled by the simultaneous anticipation of LV activation and the delay of RV activation. We believe these findings are of the utmost importance because it was possible to quantitatively demonstrate in detail the altera-tions that occur with global, regional, and inter-regional Figure 3 - Inter-regional LV-RV gradients in sinus rhythm and
biventricular pacing.
Figure 4 -Regional VAT variation for the RV (increased) and LV (decreased).
included in the study population (only 55 patients). Other potential factors may have interfered with our results, such as the timing of the BSPM examinations, which varied from 120 to 300 days after CRT in 95% of the sample, and the lack of data concerning the localization of electrodes implanted in the left ventricle, a factor considered by some authors to be of some importance. Furthermore, new developments in drug therapy may have had implications on cardiac remodeling as well. As a retrospective study, we were unable to perform body surface mapping prior to implantation of the resyn-chronization device. We are also aware that we may have analyzed data from patients who had already undergone some cardiac remodeling; however, our results showed that there was a difference in activation when the devices were not operating. We can, therefore, infer that the differences we found would be even greater had we measured the cardiac electrical activation prior to implantation. Thus, this factor likely does not invalidate our findings and rather indicates that the study outcomes may be underestimated.
Analysis of the ventricular activation times obtained by body surface potential mapping enabled characterization of the ventricular electrical activation phenomenon in patients undergoing cardiac resynchronization therapy. Our results indicated that CRT led to a maximal global reduction by 5.1% and similar regional ventricular activation times in the two ventricular regions studied (78.9 ms and 77.3 ms for the RV and LV regions, respectively), which resulted in enhanced synchronization of the ventricles according to the significant 61.2% reduction in the inter-regional LV-RV gradient.
& AUTHOR CONTRIBUTIONS
Samesima N managed the project, collected and analyzed the data, and wrote the manuscript. Pastore CA coordinated the project and supervised the manuscript writing. Douglas RA performed the BSPM examinations and contributed to the data processing and analysis. Martinelli Filho M supervised the data collection and contributed to its analysis. Pedrosa AA performed a critical analysis of results and discussion.
& REFERENCES
1. Ho KK, Pinsky JL, Kannel WB, Levy D. The epidemiology of heart failure: the Framingham Study. J Am Coll Cardiol. 1993;22(4 Suppl A):6A-13A, http://dx.doi.org/10.1016/0735-1097(93)90455-A. 2. Levy D, Kenchaiah S, Larson MG, Benjamin EJ, Kupka MJ, Ho KKL, et al.
Long-term trends in the incidence of and survival with heart failure. N Engl J Med. 2002;347(18):1397-402.
3. Barker WH, Mullooly JP, Getchell W. Changing incidence and survival for heart failure in a well-defined older population, 1970-1974 and 1990-1994. Circulation. 2006;113(6):799-805, http://dx.doi.org/10.1161/ CIRCULATIONAHA.104.492033.
4. Armstrong PW, Moe GW. Medical advances in the treatment of congestive heart failure. Circulation. 1993;88(6):2941-52, http://dx.doi. org/10.1161/01.CIR.88.6.2941.
5. Dickstein K, Bogale N, Priori S, Aurichio A, Cleland JG, Gitt A, et al. Scientific Committee; National Coordinators. The European cardiac resynchronization therapy survey. Eur Heart J. 2009;30(20):2450-60, http://dx.doi.org/10.1093/eurheartj/ehp359.
patients with heart failure: systematic review. Sa˜o Paulo Med J. 2009;127(1):40-5.
10. Huang Y, Wu W, Cao Y and Qu N. All cause mortality of cardiac resynchronization therapy with implantable cardioverter defibrillator: A meta-analysis of randomized controlled trials. Int J Cardiol. 2010;145:413-7. 11. Saxon LA and Ellenbogen KA. Resynchronization therapy for the treatment of heart failure. Circulation. 2003;108(9):1044-8, http://dx. doi.org/10.1161/01.CIR.0000085656.57918.B1.
12. Bax JJ, Ansalone G, Breithardt OA, Derumeaux G, Leclercq C, Schalij MJ, et al. Echocardiographic evaluation of cardiac resynchronization therapy: ready for routine clinical use? A critical appraisal. J Am Coll Cardiol. 2004;44(1):1-9, http://dx.doi.org/10.1016/j.jacc.2004.02.055. 13. Hawkins NM, Petrie MC, MacDonald MR, Hogg KJ and McMurray JJV.
Selecting patients for cardiac resynchronization therapy: electrical or mechanical dyssynchrony? Eur Heart J. 2006;27:1270-81, http://dx.doi. org/10.1093/eurheartj/ehi826.
14. Chung ES, Leon AR, Tavazzi L, Sun J-P, Nihoyannopoulos P, Merlino J, Abraham WT, et al. Results of the predictors of response to CRT (PROSPECT) trial. Circulation. 2008;117:2608-16, http://dx.doi.org/10. 1161/CIRCULATIONAHA.107.743120.
15. Kashani A, Barold SS. Significance of QRS complex duration in patients with heart failure. J Am Coll Cardiol 2005;46:2183-92, http://dx.doi.org/ 10.1016/j.jacc.2005.01.071.
16. Pratola C, Notarstefano P, Toselli T, Artale P, Squasi P, Baldo E, et al. Noncontact mapping of left ventricle during CRT implant. Pacing Clin Electrophysiol. 2010;33(1):74-84, http://dx.doi.org/10.1111/j.1540-8159. 2009.02578.x.
17. Singh JP, Fan D, Heist KE, Alabiad CR, Taub C, Reddy V, et al. Left ventricular lead electrical delay predicts response to cardiac resynchro-nization therapy. Heart Rhythm. 2006;3:1285-92, http://dx.doi.org/10. 1016/j.hrthm.2006.07.034.
18. van Gelder BM, Meijer A, Bracke FA. The optimized V-V interval determined by interventricular conduction times versus invasive mea-surement by LVdP/dtMAX. J Cardiovasc Electrophysiol. 2008;19(9):939-44, http://dx.doi.org/10.1111/j.1540-8167.2008.01160.x.
19. Sassone B, Gabrieli L, Sacca` S, Boggian G, Fusco A, Pratola C, et al. Value of right ventricular–left ventricular interlead electrical delay to predict reverse remodelling in cardiac resynchronization therapy: the INTER-V pilot study. Europace. 2010;12(1):78-83, http://dx.doi.org/10.1093/ europace/eup347.
20. Pastore CA, Moffa PJ, Tobias NM, Moraes AP, Kaiser E, Cuoco MA, et al. Ana´lise do bloqueio do ramo esquerdo pelo mapeamento eletrocardio-gra´fico de superfı´cie. Comparac¸a˜o com os achados eletrovetorcardio-gra´ficos. [Body surface potential mapping analysis of left bundle-branch block. Comparison with electrovectorcardiographic findings]. Arq Bras Cardiol. 1996;66(5):253-6.
21. Auricchio A, Fantoni C, Regoli F, Carbucicchio C, Goette A, Geller C, et al. Characterization of left ventricular activation in patients with heart failure and left bundle branch block. Circulation. 2004;109(9):1133-9, http://dx.doi.org/10.1161/01.CIR.0000118502.91105.F6.
22. Fantoni C, Kawabata M, Massaro R, Regoli F, Raffa S, Arora V, et al. Right and left ventricular activation sequence in patients with heart failure and right bundle branch block: a detailed analysis using three-dimensional non-fluoroscopic electroanatomic mapping system. J Cardiovasc Electrophysiol. 2005;16(2):112-9, http://dx.doi.org/10. 1046/j.1540-8167.2005.40777.x.
23. Medvegy M, Duray G, Pinter A, and Pre´da I. Body surface potential mapping: Historical background, present possibilities, diagnostic chal-lenges. Ann Noninvasive Electrocardiol. 2002;7:139-51, http://dx.doi. org/10.1111/j.1542-474X.2002.tb00155.x.
24. Pastore CA, Tobias N, Samesima N, Martinelli Filho M, Pedrosa Anı´sio A, Nishioka S, et al. Body surface potential mapping investigating the ventricular activation patterns in the cardiac resynchronization of patients with left bundle-branch block and heart failure. J Electrocardiol. 2006;39(1):93-102, http://dx.doi.org/10.1016/j.jelectrocard.2005.07.004. 25. Varma N, Jia P, Rudy Y. Electrocardiographic imaging of patients with