Evaluation of immediate soft tissue changes after rapid
maxillary expansion
Ki Beom Kim1, Daniel Adams2, Eustaquio A. Araújo3, Rolf G. Behrents4
Objective: To evaluate immediate soft tissue changes following rapid maxillary expansion (RME) in growing patients, using cone beam computed tomography (CBCT). Methods: Twenty-three consecutive patients (10 male, 13 female) treated by RME were selected. Patients were scanned using CBCT prior to placement of the rapid maxillary expander (T0), then immediately following full activation of the appliance (T1). Defined landmarks were then located on the pre- and post-treatment orientated images. Change in landmark position from pre- to post-treatment was then measured. In addition to landmarks, 10 direct measures were made to deter-mine distance change without regard to direction to measure soft tissue change of the lips. Results: Significant transverse expan-sion was measured on most soft tissue landmark locations. All the measures made showed significant change in the lip position with a lengthening of the vertical dimension of the upper lip, and a generalized decrease of anterior-posterior thickness of both the upper and lower lips. Conclusions: Significant changes in the soft tissue do occur with RME treatment. There is a transverse widening of the midface, and a thinning of the lips.
Keywords: Palatal expansion technique. Cone beam computed tomography. Corrective orthodontics.
Submitted: January 26, 2011 - Revised and accepted: August 15, 2011
» Patients displayed in this article previously approved the use of their facial and in-traoral photographs.
» The authors report no commercial, proprietary, or financial interest in the products or companies described in this article.
Contact address: Ki Beom Kim
3320 Rutger Street, Saint Louis, MO 63104, USA E-mail: [email protected]
1 Assistant Professor, Saint Louis University. 2 Private practice, Mesa, Arizona, EUA.
3 Professor Department of Orthodontics Saint Louis University. 4 Professor and Chair Department of Orthodontics Saint Louis University.
How to cite this article: Kim KB, Adams D, Araújo EA, Behrents RG. Evaluation of immediate soft tissue changes after rapid maxillary expansion. Dental Press J Or-thod. 2012 Sept-Oct;17(5):157-64.
Objetivo: avaliar as mudanças imediatas no tecido mole após a expansão rápida da maxila (ERM) em pacientes em fase de cres-cimento, usando tomografia computadorizada de feixe cônico (TCFC). Métodos: vinte e três pacientes (10 do sexo masculino e 13 do feminino) tratados com ERM foram selecionados. Os pacientes foram escaneados por TCFC antes da implantação do expansor maxilar (T0) e imediatamente após a completa ativação do aparelho (T1). Pontos cefalométricos definidos foram localizados nas imagens pré- e pós-tratamento. As mudanças de posição desses pontos do pré- para o pós-tratamento foram, então, analisadas. Adicionalmente aos pontos, 10 medições diretas foram realizadas para determinar a mudança nas distân-cias — independentemente da direção — nos tecidos moles dos lábios. Resultados: uma expansão transversal significativa foi notada na maioria dos pontos demarcados em tecido mole. Todas as medições apresentaram mudança significativa na posição labial, com um aumento da dimensão vertical do lábio superior e uma redução generalizada da espessura anteroposterior dos lá-bios inferior e superior. Conclusão: de fato, mudanças significativas do tecido mole ocorrem no tratamento com ERM. Há um alargamento transversal do terço médio da face e um afinamento dos lábios.
INTRODUCTION
Rapid maxillary expansion (RME) has been shown to produce an increase in arch width and pe-rimeter to allow correction of posterior crossbites and provide space to alleviate crowding of the
den-tition.1,2,3 The hard tissue changes that take place
have been well documented in the literature.1,2,4-10
Compared with the large amount of information available about the hard tissue changes associated with RME, there is a relatively small amount of in-formation available regarding soft tissue changes. Karaman et al evaluated soft tissue changes induced by RME. They used lateral cephalograms taken on 20 patients pre- and post-RME treatment. They found that the nose tip and soft tissue A point fol-lowed the anterior movements of the maxilla and
maxillary incisors.11
Available studies, however, largely neglect struc-tures lateral to the midline. Studies of soft tissue change involving facial regions lateral to the mid-line are limited partly because these structures are not identifiable on traditional two-dimensional
cephalograms.12 Also it is somewhat difficult to
identify soft tissue landmarks reliably due to the
nature of these tissues.13,14
One attempt to measure regions lateral to the
midline in RME cases was made by Berger et al.15
They measured facial changes based on measure-ments made from two dimensional digital photos and found changes in several areas. Using this meth-od they documented some changes that take place in the soft tissue when viewed from a frontal view.
With more information becoming available through the more widespread use of Cone Beam Computed Tomography (CBCT) in orthodontics, there are greater opportunities for study of the ef-fects orthodontic treatment on the soft tissues. Progress in software development now allows for better manipulation and viewing of the CBCT im-ages, which permits the collection of information
that is reliable and precise.16
The purpose of this study was to evaluate the im-mediate soft tissue effects of RME using CBCT.
MATERIAL AND METHODS
Records of 25 patients were collected from an orthodontic private practice, which were
consecu-tively treated with RME. All patients had been diag-nosed with a skeletal transverse discrepancy, or arch length discrepancy and undergone RME treatment according to a standard protocol and performed by a single orthodontist.
Exclusion criteria consisted of patients with severe skeletal asymmetry, including those with craniofacial anomalies. Patients who had orthodontic treatment before treatment with RME were also excluded.
Because of the exclusion criteria, the final sam-ple consisted of 23 patients (10 male, 13 female). The mean age of the patients at the time of the first CBCT image was 12.3 ± 2.6 years, with a range of 8.3 to 17.8 years. The second CBCT image was taken a mean of 22.8 days later with a range of 14 to 37 days.
Each patient had been treated with a fixed rapid maxillary expander. The expander used in all cas-es was manufactured by Dentaurum (Dentaurum Group, Ispringgen, Germany) and contained a 7 mm expansion jackscrew. The stainless steel appliance was soldered to orthodontic bands on the maxillary first molars, with supporting arms extending ante-riorly to the premolar and canine regions (Fig 1).
The rapid palatal expander was activated two one-quarter turns (0.2 mm each one-quarter turn) upon de-livery of the appliance, then by one one-quarter turn twice a day by the patient or parent until the required
expansion was achieved. Each patient received two CBCT scans, one prior to the delivery of the
appli-ance (T0), and one immediately following the active
expansion phase of treatment (T1). All scans were
taken by the same technician with the patient seated in a vertical position. The patients were stabilized with teeth together in centric relation, and with the Frankfort horizontal plane parallel to the floor. The Classic i-CAT CBCT scanner (Imaging Sciences In-ternational, Hatfield, PA) was used for all scans, and required 20 seconds for each scan, with voxel size set at 0.4 mm. Each data set was assigned a number to eliminate the possibility of patient identification and imported to Dolphin Imaging 10.5 software (Dolphin Imaging and Management Solution, Chatsworth, CA). The image was orientated along the mid-sagittal plane (z plane), Frankfort horizontal plane (x plane), and a coronal plane (y plane) extending through the anterior wall of the right and left external meatus. The image was orientated first to the mid-sagittal plane (determined by nasion and sella), then the horizontal plane was created perpendicular to the sagittal plane and rotated until it was parallel to and aligned with Frankfort horizontal plane. Finally the coronal plane was created perpendicular to the two already established planes, and set against the ante-rior wall of the right external meatus (Fig 2).
Landmark assessment
Placement of landmarks was accomplished us-ing Dolphin Imagus-ing software. This allows for points to be defined three-dimensionally using x, y, z Car-tesian coordinate system, based on the 3 planes of orientation. A series of 20 landmarks were placed on each pre- and post-treatment scan and their three-dimensional changes were determined by their x, y, z coordinates (Fig 3). The landmark at the tip of the nose was located on only 8 patients because it was not captured in the field of view on the other 15 patients.
Most of the landmarks change noted as the result of treatment was measured in the transverse plane. To detect changes in the transverse plane, the x co-ordinate values were used. To measure anteropos-terior change the z coordinate values were used. A list and definition of all the landmarks placed can be found on Table 1, this table also shows the plane of measurement used for each landmark.
In addition to the landmarks, 10 direct measures were made between two defined points. One direct measure was also made on the post-treatment im-age of the mesial and distal aspects of the rapid pala-tal expander to assure expansion had taken place. These measures show the change in distance be-tween two points without regard to the direction of change. All but one of these measures was made using
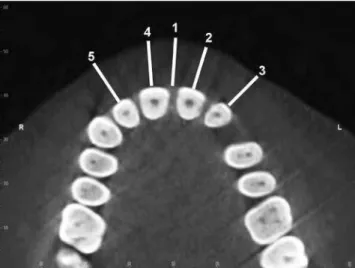
a two-dimensional axial image generated from the three-dimensional CBCT image. These axial images were created parallel to the Frankfort horizontal plane at the level of the centers of the crowns of the incisors in the mandible and maxilla. These were used to mea-sure changes in the thickness of the upper and lower lips. Five measures were made on the upper lip; one measure at the mid-sagittal, and one over each of the four maxillary incisors. This measurement was taken by determining the mesiodistal axis of each tooth and constructing a perpendicular bisector from the tooth
outwardly to a point on the soft tissues. (Fig 4). There were four similar measures taken on the lower lip one over each mandibular incisor (Fig 5). The tenth mea-surement was taken on the frontal view of the three-dimensional image of the soft tissues between subna-sale and stomion. This measurement was used to as-sess changes in the vertical length of the upper lip. All of the measures taken were recorded in millimeters. The change was then averaged for five measures on the upper lip and the four measures on the lower lip to de-scribe the average change in the thickness of each lip. Table 1 - Definitions of anatomic landmarks.
Landmark Definition Measured plane
Exocanthion (Ex) Lateral commissure of the eye recorded bilaterally x
Endocantion (En) Medial commissure of the eye, recorded bilaterally x
Apex of nose (AN) Soft tissue over the junction of the nasomaxillary suture and nasofrontal suture, recorded bilaterally x
Soft tissue nasion (Na) Point of intersection between the sella-nasion line and the soft tissue profile z
Soft tissue zygion (Zy) Soft tissue over most lateral point of the zygomatic arch, point determined from
frontal view, recorded bilaterally x
Bridge of Nose (BN) Soft tissue on mid-sagittal plane over the tip of the nasal bone, extended parallel to FH plane z
Soft tissue over infraorbital foramen (INF)
On frontal view located the superior anterior extent of the infraorbital foramen, landmark placed on soft
tissue over that point, extended parallel to FH plane, recorded bilaterally x, z
Alar base (AB) Viewed frontal and inferiorly where nasal alar meets face on the inferior
border of nose, recorded bilaterally x
Nose tip (NT) Most anterior point of the nose recorded on the mid-sagittal plane z
Subnasale (Sn) Point at which the nasal septum merges, in the mid-sagittal plane, with the upper lip z
Lower midface (LMF) Soft tissue over the center of the upper first molar crown, extending perpendicular from the mesiodistal
plane of the crown, recorded bilaterally x
Lip commissure (LC) Point of union of the upper and lower lip, recorded bilaterally x
Stomion (St) Median point of the mouth when the mouth is closed
Figure 4 - Measurements of the upper lip thickness: 1) midsagittal plane,
2) left central incisor, 3) left lateral incisor, 4) right central incisor, 5) right lateral incisor.
Statistics
For the landmark-based assessments, measure-ments describe the amount of change in the specific plane being investigated. Direct measures between landmarks describe the absolute amount of change between the two points independent of the direc-tion of change. All statistics were calculated using SPSS 14.0 Statistical Software (SPSS, Inc., Chica-go, IL). In order to determine the significance of de-scribed changes, a paired t-test was used. The level of significance was defined as p<0.05.
To asses the accuracy of landmark placement and repeated measures reliability testing was per-formed. Three of the twenty-three patients were randomly selected and all landmarks and mea-surements were duplicated. A Cronbach’s alpha test was executed on repeated measures. A perfect score equals 1.00, while a Cronbach’s alpha greater than or equal to 0.80 is considered an indicator for a reliable technique. Reliability testing was also used to determine the accuracy of the method of orientation. This was calculated by placing land-marks in non-changing areas of the skull, in this case on the anteriosuperior border of the right and left foramen ovale.
RESULTS
All landmarks had a Cronbach’s alpha above 0.80. The intraclass correlation coefficient showed all the landmarks to be reliable. The lowest of the Cronbach’s Alpha measurements reported was 0.84 for subnasale. Reliability testing of the orientation method using the Cronbach’s alpha showed the x and z alignments to be reliable; the y-axis was not show to be reliably located. No measures were taken using the y-axis in this study.
The mean amount of RME in this sample was 5.2 mm with a range of 3.1 mm to 6.4 mm. The descrip-tive statistics for all measures are listed in Table 2. The results of the paired t-tests are shown in Table 3. The measurements for all but four of the landmarks show significant changes (Figs 6 and 7). The four landmarks that did not show significance were soft tissue nasion (Na), the left lip commissure (LC), the right apex of nose (AN), and the right soft tissue over the upper first molar (LMF). All of the measured val-ues for the lips showed a significant change.
The average change of the upper lip was then calculated by taking the mean of the changes seen with the five measures on the upper lip. The average change in thickness of the upper lip was -0.92 mm. The same measure was made in the lower lip and change in thickness was calculated to be -1.04 mm. These demonstrated a mean decrease in upper and lower lips thickness.
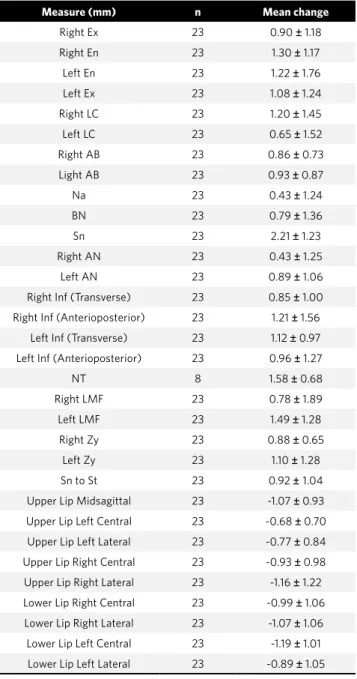
Table 2 - Descriptive statistics.
Measure (mm) n Mean change
Right Ex 23 0.90 ± 1.18
Right En 23 1.30 ± 1.17
Left En 23 1.22 ± 1.76
Left Ex 23 1.08 ± 1.24
Right LC 23 1.20 ± 1.45
Left LC 23 0.65 ± 1.52
Right AB 23 0.86 ± 0.73
Light AB 23 0.93 ± 0.87
Na 23 0.43 ± 1.24
BN 23 0.79 ± 1.36
Sn 23 2.21 ± 1.23
Right AN 23 0.43 ± 1.25
Left AN 23 0.89 ± 1.06
Right Inf (Transverse) 23 0.85 ± 1.00
Right Inf (Anterioposterior) 23 1.21 ± 1.56
Left Inf (Transverse) 23 1.12 ± 0.97
Left Inf (Anterioposterior) 23 0.96 ± 1.27
NT 8 1.58 ± 0.68
Right LMF 23 0.78 ± 1.89
Left LMF 23 1.49 ± 1.28
Right Zy 23 0.88 ± 0.65
Left Zy 23 1.10 ± 1.28
Sn to St 23 0.92 ± 1.04
Upper Lip Midsagittal 23 -1.07 ± 0.93
Upper Lip Left Central 23 -0.68 ± 0.70
Upper Lip Left Lateral 23 -0.77 ± 0.84
Upper Lip Right Central 23 -0.93 ± 0.98
Upper Lip Right Lateral 23 -1.16 ± 1.22
Lower Lip Right Central 23 -0.99 ± 1.06
Lower Lip Right Lateral 23 -1.07 ± 1.06
Lower Lip Left Central 23 -1.19 ± 1.01
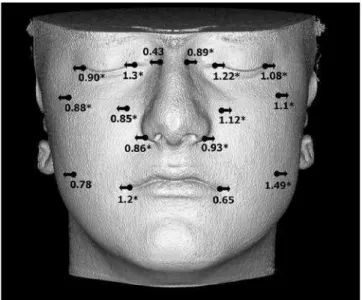
Figure 6 - Transverse change of landmarks (*significant change).
Figure 7 - Anteroposterior change (*significant change).
DISCUSSION
The changes associated with RME in hard tis-sue structures have been described by many
au-thors.1,2,4-10 It has been shown that the soft tissue
does not necessarily follow the changes of the
un-derlying hard tissue.17 Studies on the soft tissue
re-gions lateral to the mid-line are also limited partly because these structures are not identifiable on
tra-ditional two-dimensional cephalograms.12 Further
it is difficult to repeatedly identify soft tissue
land-marks due to the nature of these tissues.12,13
Based on the results of this study the methods that were used to identify landmarks have shown to be reliable. Also the methods used to orientate the pre- and post-treatment CBCT scans to the same orientation have shown to be reliable. The ability to
orientate the T0 and T1 images to the same
orienta-tion allowed changes to be measured in any plane. This sample was unique in that the data pro-vide information directly prior to placement of the appliance, and directly following the active Table 3 - Paired t-test results (*: significance p < 0.05).
Measure t Sig. (2-tailed)
Right Ex 3.66 0.001*
Right En 5.34 0.000*
Left En 3.32 0.003*
Left Ex 4.16 0.000*
Right LC 3.96 0.001*
Left LC 2.06 0.052
Right AB 5.63 0.000*
Left AB 5.19 0.000*
Na 1.66 0.111
BN 2.69 0.014*
Sn 8.63 0.000*
Right AN 1.68 0.107
Left AN 4.02 0.001*
Right Inf (Transverse) 4.08 0.000*
Right Inf (Anterioposterior) 3.73 0.001*
Left Inf (Transverse) 5.53 0.000*
Left Inf (Anterioposterior) 3.62 0.002*
Nose Tip 6.61 0.000*
Right LMF 1.99 0.060
Left LMF 5.59 0.000*
Right Zy 6.56 0.000*
Left Zy 4.12 0.000*
Sn to St 4.25 0.000*
Upper Lip Midsagittal -5.48 0.000*
Upper Lip Left Central -4.65 0.000*
Upper Lip Left Lateral -4.37 0.000*
Upper Lip Right Central -4.59 0.000*
Upper Lip Right Lateral -4.56 0.000*
Lower Lip Right Central -4.46 0.000*
Lower Lip Right Lateral -4.86 0.000*
Lower Lip Left Central -5.65 0.000*
expansion phase of treatment, allowing the assess-ment of immediate changes, directly attributed to RME. The mean time between the scans was 22.8 days with a range of 14 to 37 days. Even though the sample represents growing children, the effects of growth are negligible because of the short time
be-tween the T0 and T1 scans.
Rapid maxillary expansion is designed to in-crease the transverse dimension of the maxilla. The forces applied act along the transverse plane. Past studies have shown that the greatest amount
of change is seen in the transverse dimension.1,2,4-10
The RME devices in this study produced a mean of 5.2 mm of expansion with a range from 3.1 mm to 6.4 mm. Many of the landmarks used in this study were chosen to measure transverse change in the soft tissue corresponding to areas of underlying hard tissues that are known to experience signifi-cant transverse changes.
Transverse change
In the upper midface transverse expansion of the soft tissue did occur. Points associated with the right eye and left eye moved away from the mid-sag-ittal plane representing an increase in the distance between the eyes. The width of the apex of the nose also showed an increase although the landmark movement on the right was not shown to be signifi-cant. A transverse increase was also seen in the final position of both the right and left zygions.
The width of the alar base of the nose also showed an increase. Both the right and left landmarks moved away from the mid-sagittal plane. The right side moved by an average of 0.86 mm and the left by 0.94 mm. Similar findings of transverse expansion was reported in the hard tissue nasal base using metallic
implants by Krebs.8 The soft tissue over the
infraor-bital foramen showed transverse increases. The lips and lower midface also showed a transverse increase, although the right lower midface landmark and left lip commissure movements were not significant (p= 0.06 and p= 0.052 respectively). Significant trans-verse expansion has also been noted in each of these
areas in the hard tissue in previous studies.8,10,12,18
The soft tissue change seen in this sample did not however represent the triangular pattern of
ex-pansion that has been reported for hard tissue.9,10
When seen from a frontal view the hard tissues show a triangular pattern of opening transversely with the apex located close to the maxillo-frontal suture. Transverse expansion in the soft tissue of this sample had a more vertically parallel pattern of expansion than that reported for the hard tissue in
previous studies (Fig 6).8,9,10
Anteroposterior change
Some landmarks located in the mid-sagittal plane also showed significant change. Soft tissue na-sion came forward an average of 0.43 mm however this measure was not significant. The p value of the soft tissue nasion of 0.111 showed that based on this study the change seen in this landmark was not con-sistent. It has been shown that the maxillary halves separate in the vertical plane in a triangular pattern with the apex near the maxillo-frontal suture with progressively with more skeletal separation
inferi-orly.9,10 Soft tissue nasion is located near the apex of
the opening where hard tissue expansion would be expected to be minimal to none at all. Soft tissue na-sion was created by extending the sella-nana-sion line to the soft tissue. Depending on the steepness of the sella-nasion in individual patients the landmark may possibly be higher or lower than the area where expansion occurred, which would affect the consis-tency of recorded results.
The bridge of the nose came forward by 0.80 mm. The tip of the nose moved anteriorly by a mean of 1.59 mm however this value was only able to be mea-sured in 8 patients because it was not captured on other scans. Subnasale moved anteriorly by a mean of 2.21 mm. These findings are in agreement with previous findings in that there is an anterior
dis-placement of the maxilla during RME.9,10,18,19,20
Anterior movement was also reported in the soft tissue over the right and left infraorbital foramina. This also would agree with reported anterior dis-placement of the maxillary complex that has been
described with RME treatment.9,10,18,19,20
Change in the lips
increase of 1.0 mm immediately following the
acti-vation phase of expansion.15
The thickness of both the upper and lower lips showed a significant decrease. The upper lip changed by a mean of -0.92 mm, while the lower lip changed by a mean of -1.04 mm. This change most likely reflects the effect of transverse expansion and stretching of the soft tissue of the mouth. Al-though the measure of the left lip commissure for transverse expansion was not significant (p= 0.052) the mean was 0.65 mm with one outlier showing a change of -4.6 mm which is likely affecting the nificance. The right lip commissure showed a sig-nificant change of 1.20 mm, showing that there is
some transverse change of the lips which could ac-count for a thinning of the lips.
This study only looked at the immediate effects of RME treatment. Many studies suggest that the effects commonly seen with RME treatment have a high level
of relapse.3,8,9,10,15,20,21,22 Future studies on this topic may
look at relapse after a period of time to determine the long term stability of the observed changes.
CONCLUSIONS
Significant changes in the soft tissue do occur with RME. There is a transverse widening of the midface, and a decrease of the thickness of the up-per and lower lips.
1. Gryson JA. Changes in mandibular interdental distance concurrent with rapid maxillary expansion. Angle Orthod. 1977;47:186-92.
2. Adkins MD, Nanda RS, Currier GF. Arch perimeter changes on rapid palatal expansion. Am J Orthod Dentofacial Orthop. 1990;97:194-9.
3. Geran RG, McNamara JA, Jr., Baccetti T, Franchi L, Shapiro LM. A prospective long-term study on the effects of rapid maxillary expansion in the early mixed dentition. Am J Orthod Dentofacial Orthop. 2006;129:631-40.
4. Cross DL, McDonald JP. Effect of rapid maxillary expansion on skeletal, dental, and nasal structures: A postero-anterior cephalometric study. Eur J Orthod. 2000;22:519-528.
5. Davis WM, Kronman JH. Anatomical changes induced by splitting of the midpalatal suture. Angle Orthod. 1969;39:126-32.
6. Haas A. Gross reactions to the widening if the maxillary dental arch of the pig by splitting the hard palate. Am J Orthod. 1959;45:868.
7. Haas A. Rapid expansion of the maxillary dental arch and nasal cavity by opening the midpalatal suture. Angle Orthod. 1961;31:73-90.
8. Krebs A. Midpalatal Suture Expansion Studies by the Implant Method over a Seven-Year Period. Rep Congr Eur Orthod Soc. 1964;40:131-42.
9. Wertz R, Dreskin M. Midpalatal suture opening: A normative study. Am J Orthod. 1977;71:367-81.
10. Wertz RA. Skeletal and dental changes accompanying rapid midpalatal suture opening. Am J Orthod. 1970;58:41-66.
11. Karaman A. I. FAB, I Gelgör, A Demir. Examination of soft tissue changes after rapid maxillary expansion. World J Ortho. 2002;3:217-22.
12. Grayson B, Cutting C, Bookstein FL, Kim H, McCarthy JG. The three-dimensional cephalogram: Theory, technique, and clinical application. Am J Orthod Dentofacial Orthop. 1988;94:327-37.
REFERENCES
13. Betts NJ, Vig KW, Vig P, Spalding P, Fonseca RJ. Changes in the nasal and labial soft tissues after surgical repositioning of the maxilla. Int J Adult Orthodon Orthognath Surg. 1993;8:7-23.
14. Guest E, Berry E, Morris D. Novel methods for quantifying soft tissue changes after orthognathic surgery. Int J Oral Maxillofac Surg. 2001;30:484-9. 15. Berger JL, Pangrazio-Kulbersh V, Thomas BW, Kaczynski R. Photographic analysis
of facial changes associated with maxillary expansion. Am J Orthod Dentofacial Orthop. 1999;116:563-.571.
16. Moss JP. The use of three-dimensional imaging in orthodontics. Eur J Orthod. 2006;28:416-25.
17. Park JU, Hwang YS. Evaluation of the soft and hard tissue changes after anterior segmental osteotomy on the maxilla and mandible. J Oral Maxillofac Surg. 2008;66:98-103.
18. Haas AJ. Palatal expansion: Just the beginning of dentofacial orthopedics. Am J Orthod. 1970;57:219-55.
19. Garib DG, Henriques JF, Janson G, Freitas MR, Coelho RA. Rapid maxillary expansion--tooth tissue-borne versus tooth-borne expanders: A computed tomography evaluation of dentoskeletal effects. Angle Orthod. 2005;75:548-57. 20. Haas AJ. Long-term posttreatment evaluation of rapid palatal expansion. Angle
Orthod. 1980;50:189-217.
21. Bishara SE, Staley RN. Maxillary expansion: Clinical implications. Am J Orthod Dentofacial Orthop. 1987;91:3-14.