Received: June 1, 2011 Accepted: November 15, 2011
Conflict of Interests: The authors state that there are no financial and personal conflicts of interest that could have inappropriately influenced their work.
Copyright: © 2011 Nunes et al.; licensee EDIPUCRS. This is an Open Access article distributed under the terms of the Creative Commons Attribution-Noncommercial-No Derivative Works 3.0 Unported License.
Prevalence of soft tissue calcifications in cone beam
computed tomography images of the mandible
Prevalência de calcificações em tecido mole na região mandibular
avaliadas por dois sistemas de tomografia computadorizada
por feixe cônico
Leiliane Ferreira da Silva Nunes a
Karina Cecília Panelli Santos b
José Luiz Cintra Junqueira a
Jefferson Xavier Oliveira b
a Faculty of Dentistry São Leopoldo Mandic,
Campinas, SP, Brazil
b Faculty of Dentistry, University of São Paulo (USP),
São Paulo, SP, Brazil
Correspondence: Karina Cecília Panelli Santos Faculdade de Odontologia da USP Disciplina de Radiologia
Av. Prof. Lineu Prestes, 2227, Cidade Universitária São Paulo, SP – Brasil
05508-000
E-mail: [email protected]
Abstract
Purpose: To determine the prevalence of soft tissue calcifications in the mandible in cone beam computed tomography (CBCT) scans.
Methods: The sample was composed by 246 CBCT scans of the mandible; 163 were acquired by the NewTom 3G® system, and 83 were acquired by the Classic i-Cat® system. When the
presence of soft tissue calcification was confirmed in the mandible, the anatomical location and the type of calcification (single or multiple) were determined. Elongated styloid process and ossification of the stylohyoid ligament were excluded. Data were analyzed by using Fisher’s exact test and chi-square tests.
Results: A total of 37 out of 246 scans showed soft tissue calcifications in the mandible (prevalence of 15%). Soft tissue calcification is predominant at posterior region of the mandible (18.9%), with no relation to gender and age. From the total of patients with soft tissue calcification, 73% were aged 35-55 year-old. There was no significant difference of diagnostic quality of the images between the CBCT systems (P > 0.05).
Conclusion: The prevalence of soft tissue calcifications was high in this sample using CBCT images for diagnosis in the mandibular region.
Key words: Cone beam computed tomography; hyperdense images; soft tissue calcification
Resumo
Objetivo: Determinar a prevalência de calcificações em tecido mole na região mandibular por meio de análise de imagens axiais provenientes de dois sistemas de tomografia computadorizada por feixe cônico (TCFC), NewTom 3G® e Classic i-Cat®.
Método: Foram avaliadas 246 imagens da região mandibular. Destas, 163 foram adquiridas no aparelho NewTom 3G® e 83 no aparelho Classic i-Cat®. A análise estatística foi baseada
no teste exato de Fisher e no teste Qui-quadrado para comparação das proporções. Resultados: Das 246 imagens, 37 apresentaram calcificações em tecido mole. Não houve diferença significativa entre gêneros em termos de prevalência. Pacientes entre 40-65 anos foram os mais afetados. A prevalência de calcificações em tecido mole na região mandibular foi de 15%, não havendo diferença significante entre os dois sistemas de TCFC quanto à qualidade das imagens para o diagnóstico (P > 0,05).
Conclusão: Os sistemas de TCFC avaliados mostraram-se ferramentas valiosas na identificação de calcificações em tecido mole, embora as imagens não permitam exata localização destas calcificações.
Introduction
Soft tissue calciications are classiied as dystrophic, idiopathic, or metastatic. They might not be accompanied by clinical symptoms or appear on X-rays (1,2). One of the greatest dificulties when diagnosing soft tissue calciications is to determine their exact location. This is especially dificult in panoramic radiographs, since two-dimensional images can create ghost images (3). However, since the last decade, volumetric imaging has been increasingly used as a diagnostic tool. The cone beam computed tomography (CBCT), an imaging method that allows the acquisition of high-quality, high-idelity images using lower doses of radiation, facilitates the acquisition of multiplanar images and may allow a more accurate diagnosis for an effective treatment planning (4).
According to the guidelines of the American Academy of Oral and Maxillofacial Radiology, CBCT images constitute a valuable tool for determining the location of soft tissue calciications by oral and maxillofacial radiology specialists (5).
The objective of the present study was to determine the prevalence of soft tissue calciications in the mandibular region by analyzing CBCT axial images acquired by two different CBCT scanners.
Methods
The study protocol was approved by the Institutional Ethics Committee.
The sample comprised CBCT scans acquired by two different systems: NewTom 3G® (Quantitative Radiology,
Verona, Italy) and Classic i-Cat® (Imaging Sciences
International, Hatield, PA, USA). The NewTom 3G® system
speciications were as follows: scan time of 36 s, ield of view of 9 inches, 120 kVp and 22.85 mAs. The Classic i-Cat® system speciications were: scan time of 40 s; ield of
view of 6 cm; 120 kVp; and 5 mA. Axial slices of 0.4 mm in thickness were obtained with the two systems.
The 163 images acquired by the NewTom 3G® system
and the 83 images acquired by the Classic i-Cat® system
were evaluated on an independent workstation. The axial slices obtained by the NewTom 3G® system were
reconstructed by an in-built program, and the axial slices obtained by the Classic i-Cat® system were reconstructed by
the program i-Cat Vision® (Imaging Sciences International).
The reconstructed images were analyzed by two previously trained observers, which were dental radiologists with a minimum of ive years of experience in CBCT.
In order to acquire the NewTom 3G® scans, the patients
were positioned with the Frankfort plane perpendicular to the ground. A wax roll was placed in the anterior region in order to maintain the maxilla and the mandible apart, thus avoiding artifacts caused by the former. The area to be reconstructed in the mandibular region was selected, the axial slices being parallel to the base of the mandible. The “study” format, which allows the evaluation of serial slices,
as well as of new slices in other planes, was selected. The “wind 3” option, which is more suitable for the observation of calciied structures, was also selected.
The Classic i-Cat® scans were acquired with the patient
sitting upright, with the chin resting on the device, and the scanner light markers serving as a guide for the sagittal and Frankfort planes. The mandible protocol was selected for the scans.
CBCT examinations scanned the entire mandible. The calciications analyzed in the present study were in the anatomical region of the mandible. Elongated styloid process and ossiication of the stylohyoid ligament were excluded.
The data were collected according to the CBCT system: treatment protocol, gender, age, clinical indication for the exam, and presence/absence of calciication. When a calciication was suspected, coronal slices were examined to rule out ossiication of the stylohyoid ligament. When the presence of soft tissue calciication was conirmed, the anatomical location (divided by region) and the type of calciication (single or multiple) were determined.
The following anatomical regions (Fig. 1) were assessed:
• regions A and F, which comprised the vestibular aspect of the mandible, extending from the lower irst premolars to the edge of the scan (distally);
• regions B and E, which comprised the lingual aspect of the mandible, extending from the lower irst premolars to the edge of the scan (distally);
• region C, which comprised the lingual aspect of the anterior teeth, from canine to canine; and
• region D, which comprised the vestibular aspect of the anterior teeth, from canine to canine.
Fig. 1. Schematic illustration of the location of the calcifications in the axial plane.
Data were statistically analyzed by using chi-square test for comparison of proportions (homogeneity) and Fisher’s exact test. The Monte Carlo test was used in cases in which over 20% of the total of table cells had values lower than 5. For all statistical tests, the level of signiicance was set at 5%.
Results
Although there was a signiicant difference between the number of NewTom 3G® scans and that of Classic i-Cat®
scans, there were no signiicant differences between the two CBCT systems in terms of the proportions of individuals with and without soft tissue calcification (P=0.85;
Table 1).
In order to evaluate the quantitative variable “age”, patients were divided into age groups. The mean age of patients with soft tissue calciication was 44.98±11.24 years. The youngest of the patients with calciication was aged
14 year-old, and the oldest was aged 65 year-old. From the total of patients with soft tissue calciication, 73% were aged 35-55 year-old (Table 2).
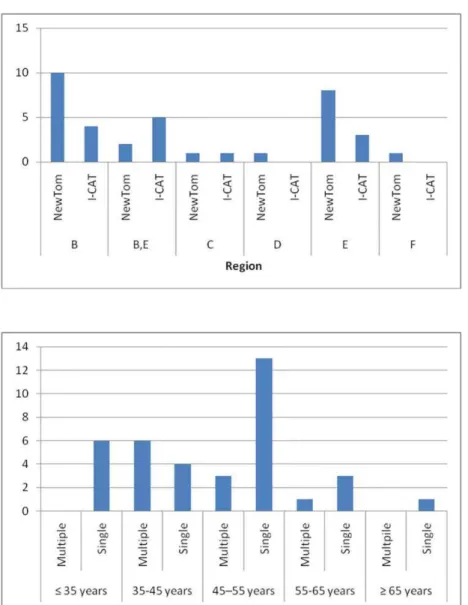
Figure 2 shows that soft tissue calciication was more frequent in regions B and E, 19% of all calciications were observed in these two regions simultaneously. The regions B and E were the only two mandibular regions that were simultaneously affected. Regions D and F were the least frequently affected. No soft tissue calciication was observed in region A (Fig. 2 and 3).
Figure 3 shows no signiicant differences between the two CBCT systems regarding the proportions of soft tissue calciications detected (chi-square test with Monte Carlo simulation, P=0.287).
There were no signiicant differences between the different age groups in terms of the proportions of patients with single or multiple calciications (chi-square test with Monte Carlo simulation, P=0.056) (Fig. 4).
CBCT system Calcification
No Yes Total
NewTom® 139 85.3% 24 14.7% 163 100.0%
i-Cat® 70 84.3% 13 15.7% 83 100.0%
Total 209 85.0% 37 15.0% 246 100.0%
CBCT: cone beam computed tomography
Age groups Calcification
No Yes Total
≤ 35 years 53 89.8% 6 10.2% 59 100.0%
35-45 years 43 81.1% 10 18.9% 53 100.0%
45-55 years 55 77.5% 16 22.5% 71 100.0%
55-65 years 34 89.5% 4 10.5% 38 100.0%
≥ 65 years 24 96.0% 1 4.0% 25 100.0%
Total 209 85.0% 37 15.0% 246 100.0%
Table 1. Relative and absolute frequencies of the presence or absence of soft tissue calcification, as determined by the two observers after the analysis of the images acquired by the two cone beam computed tomography systems evaluated.
Table 2. Relative and absolute frequencies of age groups in which soft tissue calcifications were present or absent
Discussion
Oral and maxillofacial radiologists are faced with a challenge when analyzing CBCT images: to interpret all of the structures depicted (which will vary according to the size of the ield of view). This is mandatory in accordance with the guidelines of the American Academy of Oral and Maxillofacial Radiology (5), and soft tissue calciications are among the relevant indings of a thorough analysis of CBCT images. In the present study, axial CBCT scans were assessed to detect soft tissue calciications in the mandibular region, a procedure that is similar to that used to detect sialolithiasis on helical computed tomography (HCT) images (6,7).
We did not adopt a gold standard for the evaluation of the accuracy of the CBCT systems in detecting soft tissue calciication, which is done when HCT images are compared. In addition, we analyzed scans from individuals who underwent CBCT using either the NewTom 3G® system
or the Classic i-Cat® system, not both. Mischkowski et al. (8)
and Suomalainen et al. (9) took CBCT and HCT scans of
patients and of a cadaver mandible, respectively, to evaluate the diagnostic quality of the images and the precision of the linear measurements. Mischkowski et al. (8) found no signiicant differences between the two methods, whereas Suomalainen et al. (9) reported that CBCT generated less error. Pinsky et al. (10) reported that the images obtained by the Classic i-Cat® system were accurate in detecting bone
defects. These results justify our decision of not using a gold standard for CBCT. Although there are consensus the accuracy of CBCT in detecting small calciied structures in soft tissues, the method has previously been reported as accurate.
The thickness of the slices used in the present study was 0.4 mm. Calciications such as sialoliths can go undetected if thicker slices are used (11). Drage and Brown (12), in the irst report of the use of cone beam computed sialography, highlighted the importance of thin slices for the diagnosis of small sialoliths.
Cases of ossiication of the stylohyoid ligament were excluded due to the dificulty in standardizing these cases,
Fig. 4. Frequency of single and multiple soft tissue calcifications according to the age group.
Fig. 3. Frequency of soft tissue
since there is no consensus regarding the deinition of this phenomenon (13). The reported incidence of stylohyoid ligament ossiication in the general population varies greatly. In addition, there is a large variability in the anatomy of the styloid process as seen in 3D reconstructions of HCT scans (14).
For the statistical analysis performed in the present study, the scans of patients with multiple calciications were allocated to a separate group (7). However, when the cases of multiple calciications in the same individual were evaluated, we added the cases of calciications in more than one region, as well as those of more than one calciication in the same region. There were no signiicant difference of the prevalence of multiple calciications between gender, age group, or CBCT systems (Fig. 4).
On CT scans, tonsilloliths and sialoliths often appear as large and hyperdense masses, which can be bilateral. However, Avrahami et al. (7) found small sialoliths in submandibular glands. Small calciications in the tonsils can incidentally be found on CT scans, and 20% to 30% of all sialoliths are hypodense (3,6,15-17). In the present study, only small calciications were found; in the absence of records of the main complaint or the reason why the CT scan was requested, the presence of symptoms was not considered. In addition, the two CBCT systems evaluated in the present study might not have detected calciications that were even smaller.
The greatest dificulty in the present study was the absence of soft tissue landmarks for the exact location of the calciications. Moreover, CBCT images do not allow specialists to determine whether the calciication is inside a soft tissue lesion, such as a malignant neoplasm, which is one of the differential diagnoses (16). Furthermore, the low-contrast resolution of CBCT images is not suficient to allow the differentiation among soft tissue structures (8).
Despite the absence of soft tissue landmarks, we can assume that the calciications that were closer to the midline, adjacent to the oropharynx, were located in the space that represented the pharyngeal mucosa (which has lymphatic tissue) and, therefore, they were tonsilloliths (18-20). The calciications that were close to the bone surface in the posterior region of the mandible were probably submandibular gland sialoliths, whereas those that were close to the bone surface in the anterior region of the mandible were probably sublingual gland sialoliths. Nevertheless, since the submandibular space also harbors submandibular and sublingual lymph nodes, tonsilloliths should be included in the differential diagnosis. The calciications in the external part of the mandible were probably osteoma cutis.
In the present study, the prevalence of soft tissue calciications was approximately 15% (Table 1). Shigehara et al.1 found that the incidence of osteoma cutis was 28%, which is a igure well above the incidence reported in the literature. The authors reported that this was due to a wrong choice of technique (1). The prevalence of soft tissue calciications found in the present study was also much higher than the reported prevalence, which might be due
to the fact that all calciications were grouped or to the fact that the prevalence of soft tissue calciications has been underestimated in the literature. We found no studies on the incidence of soft tissue calciications, only case reports of soft tissue calciications.
This study showed only two cases of calciications in the buccal part of the mandible. In one of these cases, the calciication appeared to be multiple, which is highly suggestive of osteoma cutis. We found two cases of calciications in region C, which were highly suggestive of sublingual gland sialoliths. Regions B and E, which were posterior regions of the mandible, in the lingual aspect, were the most affected, and the calciications observed might have been sialoliths or tosilloliths, depending on their location (Fig. 2 and 3).
The age range of the 246 patients was extremely wide. Most of the CBCT scans were from patients in the 45-55 year-old age group (71 subjects), with predominance of females (Table 2). Arnheiter et al. (21) found a mean age of 45 ± 21 year-old in the charts of 329 patients who underwent CBCT, with higher frequency in females. In that study, CBCT scans were more common among patients in the 60-69 year-old age group, particularly in the subjects of the 50-59 year-old group (21).
In the present study, the mean age of patients was 44.9 years, and there was no signiicant difference between gender for the prevalence of soft tissue calciication. Bodner (4) and Ledesma-Montes et al. (22) found that most of the patients with sialoliths were in their 40’s or 50’s years-old, and that sialoliths were more common among males.
Since we did not classify the calciications (we only determined their location in the axial plane), these indings cannot be directly compared with those reporting the incidence of tonsilloliths, sialoliths, and osteoma cutis. Knowledge of the anatomy of the maxillofacial region can aid in determining the tissue of origin of a calciication seen on a CBCT scan (23). Nevertheless, because we had no access to the clinical charts or test results that might have conirmed the diagnoses, we limited our analysis to the identiication of calciications. The 15% prevalence of soft tissue calciications found in the present study conirms the importance of carefully observing serial CBCT scans in order to take full advantage of the diagnostic potential of this imaging modality.
Although NewTom 3G® and Classic i-Cat® have different
better spatial resolution, and better contrast resolution, the dose of radiation was higher than the others.
The two CBCT systems evaluated in the present study revealed a similar prevalence of soft tissue calciications, conirming that CBCT can effectively aid in establishing a more accurate diagnosis, regardless of the speciications of the equipment. We found a high prevalence of soft tissue calciications in this sample, which highlight the importance of carefully analyzing CBCT images to detect soft tissue calciications in the mandibular region. Based on these indings, all regions, age groups and gender can be affected, which means that the specialists should perform a thorough analysis of CBCT scans of all patients.
One limitation of the present study is that we did not perform linear measurements of the calciications. Moreover, the same patients had not undergone CBCT using the two systems. Thus, further studies are required to determine the real impact of the image detectors on the diagnosis of soft tissue calciications.
In conclusion, the prevalence of soft tissue calciications was approximately 15% in this sample. Soft tissue calciication was predominant at the posterior region of the mandible (18.9%), with no association with gender or age. There was no signiicant difference between the two CBCT systems (NewTom 3G® and Classic i-Cat®) for the diagnostic
quality of the images.
Shigehara H, Honda Y, Kishi K, Sugimoto T. Radiographic and morphologic studies of 1.
multiple miliary osteomas of cadaver skin. Oral Surg Oral Med Oral Pathol Oral Radiol Endod 1998;86:121-5.
Gokcea C, Sismanb Y, Sipahiogluc M. Styloid process elongation or Eagle’s syndrome: is 2.
there any role for ectopic calcification? Eur J Dent 2008;2:224-8.
Ram S, Siar CH, Ismail SM, Prepageran N. Pseudo bilateral tonsilloliths: a case report and 3.
review of the literature. Oral Surg Oral Med Oral Pathol Radiol Endod 2004;98:110-4. Bodner L. Giant salivary gland calculi: diagnostic imaging and surgical management. Oral 4.
Surg Oral Med Oral Pathol Oral Radiol Endod 2002;94:320-3.
Howerton Jr WB, Mora MA. Use of conebeam computed tomography in dentistry. Gen 5.
Dent 2007;55:54-7.
Carter L, Farman AG, Geist J, Scarfe WC, Angelopoulos C, Nair MK et al. American 6.
Academy of Oral and Maxillofacial Radiology executive opinion statement on performing and interpreting diagnostic cone beam computed tomography. Oral Surg Oral Med Oral Pathol Oral Radiolo Endod 2008;106:561-562.
Avrahami E, Englender M, Chen E, Shabtay D, Katz R; Harell M. CT of submandibular 7.
gland sialolithiasis. Neuroradiology 1996;38:287-90.
Mischkowski RA, Sherer P, Ritter L, Neugebauer J, Keeve E, Zöller JE. Diagnostic quality 8.
of multiplanar reformations obtained with a newly developed cone beam device for maxillofacial imaging. Dentomaxillofacial Radiol 2008;37:1-9.
Suomalainen A, Vehmas T, Kortesniemi M, Robinson S, Peltola J. Accuracy of linera 9.
measurements using dental cone beam and conventional multislice computed tomography. Dentomaxillofacial Radiol 2008;37:10-7.
Pinsky HM, Dyda S, Pinsky RW, Misch KA, Sarment DP. Accuracy of three-dimensional 10.
mesasurements using cone-beam CT. Dentomaxillofacial Radiol 2006;35:410-6. Mandel L; Hatzis G. The role of computerizes tomography in the diagnosis and therapy of 11.
parotid stones: a case report. J Am Dent Assoc 2000;131:479-82.
Drage NA, Brown JE. Cone beam computed sialography of sialoliths. Dentomaxillofac 12.
Radiol 2009;38:301-5.
Vougiouklakis T. Overview of the ossified stylohyoid ligament based in more than 1200 13.
forensic autopsies. J Clin Forensic Med 2006;13:268-70.
Ramandan SU, Gokharman D, Tunçbilek I, Kacar M, Kooar P, Kosar U. Assessment of the 14.
stylohoid chain by 3D-CT. Surg Radiol Anat 2007;29:583-8.
Pérez FJ, Guayo GM, Tabar AO, Broto JP. A propósito de un caso: gran onsilolito en 15.
amígdala palatina. Acta Otorrinolaringol Esp 2002;53:207-10.
Sezer B, Tugsel Z, Bilgen C. An unusual tonsillolith. Oral Surg Oral Med Oral Pathol Oral 16.
Radiol Endod 2003;95:471-3.
Mosca RC, Cabral MV, Mantesso A. Bilateral tonsilloliths in a 77-year-old white man with 17.
edentulous jaws: a case report. Oral Radiol 2006;22:34-6.
Kurubayashi T, Nakamura S, Ogura I, Sasaki T. The sublingual e submandibular spaces. 18.
Oral Radiol 2003,19:130-6.
Kimura Y, Okano T. The pharyngeal mucosal, parapharyngeal, and retropharyngeal 19.
spaces. Oral Radiol 2003;19:106-8.
Okano T. Lesions originating in the head and neck spaces and their differentiation: an 20.
introduction. Oral Radiol 2003;19:104-5.
Arnheiter C, Scarfe WC, Farnam AG. Trends in maxillofacial cone-beam computed 21.
tomography usage. Oral Radiol 2006;22:80-5.
Ledesma-Montes C, Garcés-Ortiz M, Salcido-Garcia JF, Flores F, Hernandéz-22.
Guerrero JC. Giant sialolith: case report and review of the literature. J Oral Maxillofac Surg 2007;65:128-30.
Angelopoulos C. Cone beam tomographic imaging anatomy of the maxillofacial region. 23.
Dent Clin North Am 2008;52:731-52.
Naitoh M, Hirukawa A, Katsumata A, Saburi K, Okumura S, Ariji E. Imaging artifact and 24.
exposure conditions in limited-volume cone-beam computed tomography: comparison between an image intensifier system and a flat panel detector. Oral Radiol 2006;22: 69-74.
Scarfe WC, Farman AG, Sukovic P. Clinical applications of cone-beam computed 25.