Nutrition Support Service and Hemodialysis Unit1, Santa Rita de Cassia
Hospital and Faculty of Medical Sciences of Santa Casa – Vitória/ES, Brazil.
Hospital das Clínicas2, Faculty of Medicine, University of São Paulo – São
Paulo/SP, Brazil.
E-mail: [email protected]
Received for publication on June 03, 2004. Accepted for publication on February 14, 2005.
ORIGINAL RESEARCH
CORRELATION OF NUTRITIONAL STATUS AND
FOOD INTAKE IN HEMODIALYSIS PATIENTS
Alvaro A. C. Morais1, Maria A. T. Silva1, Joel Faintuch2, Erica J. Vidigal1, Rozilene
A. Costa1, Daniele C. Lyrio1, Celia R. Trindade1, and Karoline K. Pitanga1
Morais AAC, Silva MAT, Faintuch J, Vidigal EJ, Costa RA, Lyrio DC, et al. Correlation of nutritional status and food intake in hemodialysis patients. Clinics. 2005;60(3):185-92.
BACKGROUND: Patients in end-stage renal disease often suffer from poor appetite, various comorbidities, and dietary restrictions. Despite regular hemodialysis, nutritional imbalances are frequently reported. Aiming to correlate nutritional status with food ingestion, a prospective study was done in an outpatient group.
METHODS: Stable patients undergoing chronic hemodialysis for at least 3 months (n = 44) were investigated by dietary recall and standard anthropometric, biochemical, and bioimpedance determinations, including subjective and objective global assessment. The mean age of the group was 47.0 ± 16.9 years, and 63.6% were men. Body mass index was 22.2 ± 3.9 kg/m2 (mean± SD), calorie intake was 1471 ± 601 kcal/day (20.7 ± 6.7 kcal/kg/day), and protein ingestion was 74.3 ± 16.6
g protein/day (1.2 g/kg/day). Dietary and clinical findings were correlated with nutritional indices by linear regression analysis.
RESULTS: Malnutrition estimated by subjective global assessment was very common (>90%), despite the fact that body mass index and serum albumin were within an acceptable range in the majority of the population. Objective global assessment yelded roughly comparable numerical findings, with 6.8% being well nourished, 61.4% at nutritional risk or lightly undernourished, 29.6% moderately malnourished, and 2.3% severely malnourished. Total calorie intake was devoid of associations, but protein, carbohydrate, and lipid input positively correlated with triceps skinfold (P=.02). Lipid ingestion
was the only marker directly associated with arm circumference, and it correlated with body mass index, as well as with total body fat (bioimpedance analysis) (P <.001).
CONCLUSIONS: 1) Bioimpedance analysis was useful and was correlated with clinical findings; 2) Lipid intake was the best dietary index in this experience, surpassing protein or total energy; 3) Despite its shortcomings, dietary recall was useful in the assessment of hemodialysis patients.
KEYWORDS: Hemodialysis. Renal insufficiency. Uremia. Nutritional assessment. Subjective global assessment. Bioimpedance analysis.
Patients in end-stage renal disease often suffer from poor appetite, various comorbidities, and dietary restrictions. Despite regular hemodialysis (HD), nutritional imbalances are frequently reported.1-4 Inflammation and infection,
meta-bolic acidosis, and oxidative stress may cause further
com-plications,5,6 resulting in a poor quality of life and in
in-creased morbidity and mortality.4,7
Actual prevalence of protein-calorie malnutrition in chronic hemodialysis patients is disputed, partly because of poor agreement between different assessment tools.3,8,9
Especially discussed is the validity of standard whole-body bioimpedance analysis (BIA) and even more recent modalities, such as BIA spectroscopy and segmental analy-sis, in the investigation of body composition changes in such population.10,11
METHODS
Stable outpatient uremic adults undergoing chronic HD were recruited for this study. Criteria for inclusion were ages 18 to 85 years; men and women; HD for at least 3 months, 3 times/week; ambulatory and receiving an oral diet; re-sidual renal clearance <1.5 mL/min; no blood transfusion or iron therapy in the previous 30 days; the study was ap-proved by the Institutional Ethics Committee and informed consent was obtained from every patient. Exclusion crite-ria were severe sepsis, shock, multiple organ failure, coma, clinical or surgical hospitalization in the last 30 days, on-going enteral or parenteral nutrition, cardiac pacemaker, advanced senility or dementia interfering with application of the nutritional questionnaire, refusal to cooperate with the study. Forty-four consecutive patients fulfilled the above conditions and were enrolled in the protocol. There were no exclusions.
General and demographic information collected in-cluded age, gender, diagnosis, comorbidities , renal func-tion, and clinical and dialysis history. Nutritional variables were weight, height, BMI, mid-arm circumference (AC), tri-ceps skinfold (TSF), modified subjective global assessment (SGA), and objective global assessment (OGA).
Biochemical determinations included albumin (ALB), transferrin (TRANS), ferritin (FERR), total cholesterol, HDL cholesterol, and LDL cholesterol (CHOL, HDL, LDL), triglycerides (TRIG), and C-reactive protein (CRP). A total lymphocyte count (LYMPH) was also performed.
The SGA questionnaire is divided into 2 parts. In the first part (history), information is gathered about recent weight loss, food intake, gastrointestinal symptoms, func-tional status, and influence of disease on nutrifunc-tional needs; the second part is a brief physical examination.8,9
For OGA, 3 recommended parameters were analyzed (se-rum albumin, transferrin, and total lymphocyte count), and results were classified into 4 levels: normal, slight deple-tion, moderate reducdeple-tion, and severe decrease.8
Bioimpedance analysis (BIA) included variables of body composition including resistance, reactance, phase angle, body fat, lean body mass, total water, extracellular and intracellular water, and body cell mass.
For vascular access, a vascular surgeon constructed a fis-tula between the radial artery and cephalic vein, with a minimum flux of 300 mL/min; it was used after a 4 to 5 week maturation interval.
Dialysis treatment consisted of 3 weekly sessions using bicarbonate buffer dialyzers that were reprocessed using the proxitane technique (Fresenius, São Paulo, Brazil), and bio-chemical and microbiological control of the water followed the recommendations of the Brazilian Ministry of Health.9
Dialysis duration was 3 to 5 hours depending on the indi-vidual prescription. Dialysis dose delivery was estimated from the urea Kt/V10. Blood flow was 300 mL/min., and
dia-lysate flow was 500 mL/min. Standard dialysis machines (Gambro- Brazil, model AK95) were used. Polyacrylonitrile membranes (1.6 m2) were available (Fresenius, São Paulo,
Brazil). The dialysate composition was 139 mEq/L sodium, 2 mEq/L potassium, 2.5 mEq/L calcium, 200 mg/dL glu-cose, and 39 mEq/L bicarbonate (Fresenius). The efficacy of dialysis was confirmed by standard pre- and post-dialytic biochemical tests.
Blood was collected after an overnight fast before HD and promptly sent to the laboratory. Anthropometry and BIA were documented after the procedure. Conventional (sin-gle-current) whole-body BIA was assessed by the BIA-Quantum apparatus using the classic tetrapolar technique and fluids software (RJL Systems, Clinton Twp, MI, USA).11
Regarding statistical analysis, values were presented as mean ± SD . Continuous measurements with normal distri-bution according to Kolmogorov-Smirnov test were com-pared using the Student t test (features of infected versus noninfected patients). Pearson´s linear regression analysis was utilized for comparison of CRP, body composition, and nutritional indices after confirmation of normal distribution by the Kolmogorov-Smirnov test. In all circumstances a sig-nificance of 5% (P <.05) was adopted.
RESULTS
Preliminary findings: The mean age of participants was 47.0 ± 16.9 years (range, 18-82), with 63.6% being men (28/ 44). Hemodialysis was maintained for 34.1 ± 39.4 months (range, 3-172). The main etiology of renal failure was sys-temic arterial hypertension (77.2%, 34/44), followed by dia-betes mellitus (15.9%, 7/44), and miscellaneous diseases. Comorbidities were identified in 45.5% (20/44), with a mean frequency of 1.8 ± 0.8/patient in the affected group (0-3), or 0.7 ± 1.0/patient for the entire population. The main comorbidity types encountered were arterial hypertension (95.0%, 19/20), coronary artery disease (25.0%, 5/20), and congestive heart failure (15.0%, 3/20). Minor acute infections were recognized in 9 subjects (20.5%), mostly were related to the arteriovenous fistula (15.9% of the patients, 7/44).
BMI was 22.2 ± 3.9 kg/m2 (range, 14.9-29.6). Usual body
weight was 60.9 ± 13.4 kg, current weight was 57.0 ± 17.3 kg, and height was 1.65 ± 0.10 m. Triceps skinfold was 14.0 ± 5.3 mm and mid-arm circumference was 25.0 ± 4.0 cm.
(4.6%) as severely malnourished. OGA produced roughly comparable numerical findings, with 6.8% classified (3/44) as well nourished, 61.4% (27/44) at nutritional risk or lightly malnourished, 29.6% (13/44) as moderately mal-nourished, and 2.3% (1/44) as severely malnourished.
The BIA revealed no obviously deranged measurement. Total body fat was relatively low (21.2% of body weight), con-sistent with the equally modest BMI, but total body water was within the normal range (56.8% of body weight). (Table 1).
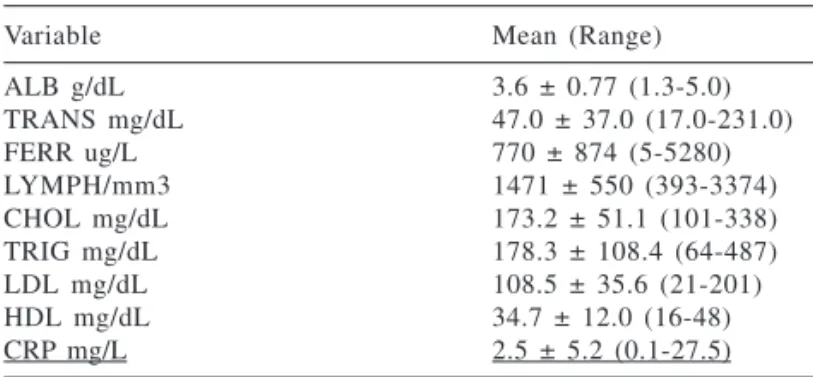
The levels of serum albumin, transferrin, ferritin, total lymphocyte count, total cholesterol, HDL, LDL, triglycerides, and CRP are listed in Table 2.
Dietary intake
Total energy ingestion was low (1471.7 ± 601.4 kcal/ day or 20.7 ± 6.7 kcal/kg/day), but protein in the diet was quite acceptable (74.3 ± 16.6 g protein/day or 1.2 ± 0.6 g/ kg/day) (Table 3).
Linear regression analysis
Correlations between feeding patterns and biochemical features concerning nutritional assessment, comorbidity, and other parameters were investigated (Tables 4-7).
As shown, SGA was positively correlated with age and comorbidity (p= 0.02), and negatively correlated with BMI, AC, TSF, LYMPH (p= 0.02 for each one), and ALB (p<0.005). The OGA numbers were in line with those for BMI (p<0.001), LYMPH (p<0.005), ALB, TRANSF (p<0.001 for each of those), CHOL, and TRIG (p= 0.01 for Table 1 - Bioimpedance analysis.
Variable Results
Resistance (ohm) 582.6 ± 104.7
Reactance (ohm) 60.6 ± 22.3
Phase angle (degree) 6.0 ± 2.4
Total body fat (kg) 13.0 ± 7.4
Lean body mass (LBM) (kg) 48.4 ± 11.8
Body cell mass (kg) 21.7 ± 5.3
Total body water (TBW) (L) 34.6 ± 7.0 Intracellular water (L) 19.8 ± 4.8 Extracellular water (ECW) (L) 14.6 ± 4.9
Table 2 - General biochemical determinations.
Variable Mean (Range)
ALB g/dL 3.6 ± 0.77 (1.3-5.0)
TRANS mg/dL 47.0 ± 37.0 (17.0-231.0)
FERR ug/L 770 ± 874 (5-5280)
LYMPH/mm3 1471 ± 550 (393-3374)
CHOL mg/dL 173.2 ± 51.1 (101-338)
TRIG mg/dL 178.3 ± 108.4 (64-487)
LDL mg/dL 108.5 ± 35.6 (21-201)
HDL mg/dL 34.7 ± 12.0 (16-48)
CRP mg/L 2.5 ± 5.2 (0.1-27.5)
ALB Serum albumin; TRANS Serum transferrin; FERR Serum ferritin; LYMPH Total lymphocyte count; CHOL Total cholesterol; TRIG Triglyceride concentration; LDL Low-density lipoprotein; HDL High density lipoprotein; CRP C-reactive protein.
Table 3 - Intake of main nutrients.
Total energy (kcal/day) 1471.7 ± 601.4 Carbohydrates (g/day) 208.3 ± 126.5 Carbohydrates (kcal/day) 833.2 ± 506.0 Carbohydrates (% daily kcal) 56.6 ± 34.4%
Lipids (g/day) 37.9 ± 25.3
Lipids (kcal/day) 341.1 ± 227.7
Lipids (% daily kcal) 23.2 ± 15.5%
Protein (g/day) 74.3 ± 16.6
Protein (kcal/day) 297. 2 ± 66.4
Protein (% daily kcal) 20.2% ± 4.5%
Table 4 - Regression analysis of the modified subjective global assessment (SGA).
Variable Pearson index (r) Significance
Age 0.309 P = 0.20
BMI –0.335 P = 0.2<.05
TSF –0.311 P = 0.2<.05
AC –0.329 P = 0.2<.05
LYMPH –0.371 P = 0.2<.05
ALB –0.450 P <.005
COMORB 0.333 P = 0.2<.05
BMI Body mass index; TSF Triceps skinfold; AC Mid-arm circumference; LYMPH Total lymphocyte count; ALB Serum albumin; COMORB Comorbidities.
Table 5 - Regression analysis of objective global assessment (OGA).
Variable Pearson index (r) Statistical probability
BMI 0.549 P <.001
LYMPH 0.490 P <.005
ALB 0.556 P <.001
TRANS 0.549 P <.001
CHOL 0.420 P = 0.1<.01
TRIG 0.427 P = 0.1<.01
BMI Body mass index; LYMPH Total lymphocyte count; ALB Serum albumin; TRANSF Serum transferrin; CHOL Total cholesterol.
Table 6 - Correlations of C-Reactive Protein.
Variable Pearson index (r) Statistical probability
COMORB 0.367 P = 0.2<.0
TRANS –0.398 P = 0.1<.01
ALB –0.565 P <.001
SGA 0.545 P <.001
each). However, C-reactive protein was positively correlated with comorbidities (p = 0.02) and SGA ( p= 0.01), but it negatively with ALB and TRANS (p< 0.001 for each one). Comorbidities followed changes in CRP and SGA (p = 0.02), but exhibited links with bioimpedance parameters.
Interestingly, time on hemodialysis directly correlated to FERR and indirectly with CHOL, but not to other indi-ces of nutritional status or body composition.
Dietary recall failed to demonstrate any correlation with total daily energy. Protein and carbohydrate associations were disappointing, with positive results for TSF only. On the other hand, lipid ingestion (Table 7) significantly signaled not only measurements linked to body lipids (to-tal fat, TSF), but also to those more dependent on protein input (AC, BMI).
Infected patients were no different from noninfected pa-tients regarding BMI(20.9 ± 3.0 vs 22.5 ± 4.0 kg/m2, NS),
SGA (14.1 ± 6.2 vs 13.1 ± 4.0, NS), or time on dialysis (12.5 ± 16.2 vs 34.0 ± 39.4 months, NS). Energy consumption (1263.5 ± 667.6 vs 1514.1 ± 644.3 kcal/day) and protein intake (63.0 ± 30.8 vs 78.2 ± 17.6 g/day) were somewhat lower for the infected population, but these changes were not statistically significant.
DISCUSSION
Renal replacement therapy including hemodialysis, peri-toneal dialysis, and renal transplantation are accepted and successful modalities for supporting patients with end-stage renal disease. They have changed its outlook over the last decades, offering new hope and additional years of life for affected patients.3,4 However, factors such as age,
comorbidity with emphasis on cardiovascular diseases, and malnutrition still cause serious complications and mortal-ity in this population.4,7,12
For many years, undernutrition was predominantly viewed in the light of insufficient intake because of poor appetite, dietary restrictions, and dialytic losses of amino acids and proteins. These aspects have not lost their
rel-evance, and careful adjustment of calories and nitrogen are still a mainstay of therapy in this context.8,13 Hemodialysis
dose and frequency must be regarded as nutritional vari-ables, and prescribed accordingly.3,14
Nevertheless, deterioration of body composition and biochemical markers cannot be extricated from a larger and more complex context, encompassing malnutrition, inflam-mation, and cardiovascular disease.5,7,15,16 Inflammatory
markers tend to display a high degree of prognostic sig-nificance in this population and have been carefully docu-mented in recent years.5,7,15-17
In the present cross-sectional study, various objective and subjective nutritional tools were applied to the popu-lation, aiming to highlight the multifactorial influences that end-stage renal disease and hemodialysis per se impart on the patients. As mentioned, CRP was markedly elevated in some of the subjects.
Many of the registered parameters, as well as a large share of the demonstrated associations, pertained to bioimpedance analysis. This approach has been criticized for its lack of precision in extreme situations, namely in severe malnutrition, advanced obesity, or frequent fluid shifts, because devices fitted with standard equations may fail in nonstandard settings. In this series, massive adipos-ity was uncommon, but malnutrition was not. At the same time, hemodialysis itself removes fluid and periodically modifies body compartments.1,2
All these limitations notwithstanding, bioimpedance seemed useful and reliable for the nutritional screening of this population, in agreement with other protocols.10,18
Ma-jor aberrations were absent, as dietary guidance and dialytic assistance were generally adequate in this series.
Average energy intake was actually low,3,8,13,14 and the
consequence can be seen in the acceptable but low figures for BMI (anthropometry) and total body fat (Table 1). On the other hand, no third space water or exaggerated extra-cellular compartment was identified, consistent with good balancing of dietary fluid intake and dialysis prescription.
According to Panzetta et al.,19 35 kcal/kg/day and 1.0
to 1.2 g/kg/day are ideal for hemodialysis populations. Car-bohydrates should represent 45% to 50% and lipids 35% to 40% of the total energy input. In the current circum-stances, calorie ingestion fell behind the recommendations, while the protein level was adequate, or even high, if rela-tive instead of absolute intake is considered. When the con-tribution of nutrient sources is examined, carbohydrates were excessive and lipids contributed less than the 35% of total calories (Table 3).
This imbalance should be corrected in the future, not only because insufficient energy is a factor for undernutri-tion, but also because intake of too much carbohydrate has Table 7 - Correlations of macronutrient ingestion (Pearson
index (r) and statistical probability).
Variable Lipids Carbohydrates Proteins BMI 0.280 (P = 0.3 <.0)
AC 0.306 (P = 0.2<.0)
TSF 0.474 (P <.005) 0.312 0.337
(P = 0.2<.05) (P = 0.2<.01)
Body fat 0.545 (P <.001)
been associated with undesirable fat accumulation during peritoneal dialysis.20 Total body fat was within the normal
range in this experience (Table 1), but it should be noted that this was a malnourished population; therefore, lower values should be expected.20
Other Brazilian studies confirm a larger deficit of calo-ries than of protein in the diet of hemodialysis subjects. In the experience of Valenzuela et al.,21 protein input was an
acceptable 1.3 ± 0.4 g/kg/day, very close to current findings, whereas energy gain was higher than in our study but defi-nitely inadequate (29.5 ± 10.2 kcal/kg/day). For non-dialysed chronic renal-disease patients,22 calorie ingestion was even
lower and almost identical to the present series (22.4 ± 7.2 kcal/kg/d), whereas diet protein content was less affected. The authors support the contention that selective underreporting of energy intake occurred with many patients.
Many of the respected international cooperative protocols of hemodialysis populations, are compatible with our findings, even discarding any underestimation hypoth-esis. The HEMO team reports not more than 22.7 ± 8.2 kcal/ kg/day and 0.9 ± 0.4 grams of protein/kg/day in their most recent communication23 and a quite similar 23.0 ± 8.4 kcal/
kg/day and 0.9 grams of protein/kg/day in their previous computation.24
It is true that patients in our study had comparatively diminished body weights, with a low-normal BMI of 22.2 ± 3.9 kg/m2. This explains why not only relative (per kg
body weight) daily calories but especially absolute (total) daily calories seem particularly low, in contrast to other in-vestigations concerning better nourished populations.
Poor appetite and hypermetabolism are unquestionably deleterious for food intake in the context of chronic hemodialysis, especially in public hospitals and Social Se-curity services.1,4-7 The fact that calorie intake may be more
compromised that protein alimentation has received less at-tention.22 In any case, such imbalances should be dealt with
by a multidisciplinary team, as recommended for other high-risk populations.25
The SGA revealed only 36% of patients with normal findings, with 51% displaying mild malnutrition, and 13% in advanced nutritional deficit. Older patients and those with more comorbidities were the most affected, but reduced body weight, hypoalbuminemia, and increased CRP were also suggestive of the deleterious impact of chronic renal impairment.
The OGA is not often employed with HD subjects, but in the present series, it confirmed what anthropometry and biochemical work-up had already anticipated, namely an elevated proportion of undernourished patients. The ex-pected correlation between this measurement and indi-vidual objective tests is shown in Table 5.
All these observations fit in the general picture of a re-ported multicenter clinical trial26 involving 1,000 patients,
in which all anthropometrics were reduced in chronic HD cases, with the exception of diabetic patients, who were overweight. Duration of HD and comorbidities were dem-onstrated to have an impact on these results.
Whereas hypoalbuminemia is accepted as one of the indi-ces of depressed nutritional status in these circumstanindi-ces,27,28
some have disputed the existence of hypoalbuminemia out-side the context of infection and inflammation.29 Indeed, with
rare exceptions, serum albumin is reported as not correlated to anthropometric indices, but is a strong and independent pre-dictor of mortality in HD groups.27-29
The combined analysis of serum albumin and transfer-rin, along with total lymphocyte count, revealed that not more than between 20% and 40% of the values corre-sponded to expectations. When serum lipids were examined, the panorama became less straightforward, because about one quarter of the current population was overweight, and in addition hyperlipidemia is not unusual in end-stage re-nal disease. Still, almost half of the population had low lev-els of total cholesterol and triglycerides (Table 2).
The SGA correlated with age and comorbidities, which is intuitive and corresponds to other studies.1,21 Less
under-standable was the negative correlation to BMI, serum al-bumin, and lymphocyte count, given the fact that these are classical tools for nutritional screening. Although, a lack of association has been found in some contexts, and sub-jective assessment maintains a substantial degree of inde-pendence from objective measurements,10 a negative
corre-lation is less common and should be further investigated.30
Although not specifically mentioned, serum albumin exhibited a low Pearson index regarding BMI, other nutri-tional markers, and demographic and clinical variables ex-cept those shown in Tables 4 and 5, reinforcing the suspi-cion that serum albumin is not as reliable a nutritional marker during HD as it is in other circumstances.9,17,29
It was noticed that HD of long duration had a positive impact on ferritin concentrations and a negative one on to-tal cholesterol. As a marker of iron status, ferritin is influ-enced by anti-anemic prescriptions, but augmented findings correlate with CRP as well.31 However, no correlation with
duration of HD could be found in other series. Also with regard to cholesterol, a negative association between CRP and HDL has been reported,32 but total cholesterol is
deemed to be diminished only within the context of a non-specific malnutrition-inflammation complex syndrome.16
The same table implies that a higher comorbidity in-dex and the SGA result are linked to elevated CRP values. The profile of more comorbidity fits the pattern of more se-verely ill subjects with a higher risk of mortality, while CRP has been noted as a non-specific marker of clinical mor-bidity.27 The opposite should be expected for SGA, and
cur-rent findings differ from those reported by others.26,27 It
should be noted that in spite of its widespread use, SGA is observer-dependent and tends to be only poorly correlated with the objective assessment of patients.18
There is no obvious explanation for the poor correlations of total energy, protein, and carbohydrates with anthropo-metric and bioimpedance variables in our study (Table 7). To the best of our knowledge, such correlations have not been attempted in other studies; consequently, it is not pos-sible to indicate whether or not this trend will be confirmed in the future. The same applies to lipid intake, which in this study was the best dietary parameter, correlating with body mass index, total body fat, and other determinations.13,33
RESUMO
Morais AAC, Silva MAT, Faintuch J, Vidigal EJ, Costa RA, Lyrio DC, et al. Correlação entre estado nutricional e ingestão alimentar em pacientes de hemodiálise. Clinics. 2005;60(3):185-92.
OBJETIVOS: Pacientes em fase final de enfermidade re-nal frequentemente sofrem de falta de apetite, várias comorbidades e restrições dietéticas, e a despeito de hemodiálise regular, desequilíbrios nutricionais são frequen-temente relatados. Com o propósito de correlacionar esta-do nutricional com ingestão alimentar, um estuesta-do prospectivo foi realizado com pacientes ambulatoriais. MÉTODOS: Doentes estáveis sibmetidos a hemodiálise crô-nica por no mínimo 3 meses (n= 44) foram investigados me-diante recordatório alimentar e determinações convencionais antropométricas, bioquímicas e de bioimpedância , incluin-do-se avaliação global subjetiva e também objetiva. A idade do grupo era de 47.0 ± 16.9 anos com 63.6% de homens. O índice de massa corporal situava-se em 22.2 ± 3.9 kg/m2, a
ingestão calórica foi de 1471 ± 601 kcal/dia (20.7 ± 6.7 kcal/ kg/dia) e o consumo proteico atingiu 74.3 ± 16.6 g proteina/ dia (1.2 g/kg/dia) . As variáveis dietéticas e clínicas foram correlacionadas com os índices nutricionais através da aná-lise de regressão linear.
REFERENCES
1 . Morais AAC, Costa RA, Grilo MG, Faintuch J. Measurement of body changes during hemodialysis by bioimpedance analysis. Rev Hosp Clin Fac Med S Paulo. 1996;51:121-4.
2 . Morais AAC, Comarella AP, Pitanga KC, Faintuch J. Interest of conventional clinical, biochemical and bioimpedance measurements as indicators of mortality risk critical patients. Rev Hosp Clin Fac Med S Paulo. 1998;53:176-80.
3 . Sanaka T. Nutritional effect of dialysis therapy. Artif Organs. 2003;27:224-6.
4 . Laws RA, Tapsell LC, Kelly J. Nutritional status and its relationship to quality of life in a sample of chronic hemodialysis patients. J Ren Nutr. 2000;10:139-47.
5 . Danielski M, Ikizler TA, McMonagle E, Kane JC, Pupim L, Morrow J, et al. Linkage of hypoalbuminemia, inflammation, and oxidative stress in patients receiving maintenance hemodialysis therapy. Am J Kidney Dis. 2003;42:286-94.
6 . Lin SH, Lin YF, Chin HM, Wu CC. Must metabolic acidosis be associated with malnutrition in haemodialysed patients? Nephrol Dial Transplant. 2002;17:2006-10.
7 . Pifer TB, McCullough KP, Port FK, Goodkin DA, Maroni BJ, Held PJ, et al. Mortality risk in hemodialysis patients and changes in nutritional indicators: DOPPS. Kidney Int. 2002 62:2238-45. 8 . O‘Keefe A, Daigle NW. A new approach to classifying malnutrition
in the hemodialysis patient. J Ren Nutr. 2002;12:248-55. 9 . Brasil. Leis Decretos, etc. Portaria MS/GM 82 ¾ð 03/01/2000.
Regulamento técnico para o funcionamento dos serviços de diálise e as normas para cadastramento destes junto ao Sistema Único de Saúde. Diário Oficial da União, Brasília (DF), 8 fev. 2000. Seção 1, p. 13.
10. Huidobro A, Velasco N, Rojas T. Prevalencia de desnutricion calorico-proteica en pacientes en hemodialisis cronica. Rev Med Chil. 2001;129:495-502.
11. Dittmar M. Comparison of bipolar and tetrapolar impedance techniques for assessing fat mass. Am J Hum Biol. 2004;16:593-7.
12. Prichard SS. Comorbidities and their impact on outcome in patients with end-stage renal disease. Kidney Int. 2000;57(suppl 74):S100-S104.
13. Vendrely B, Chauveau P, Barthe N, El Haggan W, Castaing F, de Precigout V, et al. Nutrition in hemodialysis patients previously on a supplemented very low protein diet. Kidney Int. 2003;63:1491-8.
14. Nakao T, Matsumoto H, Okada T, Kanazawa Y, Yoshino M, Nagaoka Y, et al. Nutritional management of dialysis patients: balancing among nutrient intake, dialysis dose, and nutritional status. Am J Kidney Dis. 2003;41(3 Suppl 1):S133-6.
15. Sezer S, Ozdemir FN, Arat Z, Turan M, Haberal M. Triad of malnutrition, inflammation, and atherosclerosis in hemodialysis patients. Nephron. 2002;91:456-62.
16. Kalantar-Zadeh K, Stenvinkel P, Pillon L, Kopple JD. Inflammation and nutrition in renal insufficiency. Adv Ren Replace Ther. 2003;10:155-69.
17. Memoli B, Guida B, Saravo MT, Nastasi A, Trio R, Liberti R, et al. Predictive and diagnostic factors of malnutrition in hemodialysis patients. G Ital Nefrol. 2002;19:456-66.
18. Pupim LCB, Ribeiro CB, Kent P, Ikizler TA . Atualização em diálise: Uso da impedância bioelétrica em pacientes em diálise. J Bras Nefrol. 2000;22:249-56.
19. Panzetta G, Maschio G. Dietary problems of the dialysis patient. Blood. 1985;3:63-74.
20. Soreide R, Dracup B, Svarstad E, Iversen BM. Increased total body fat during PD treatment. Adv Perit Dial. 1992;8:173-6. 21. Valenzuela RGV, Giffoni AG, Cuppari L, Canziani MEF. Estado
nutricional pacientes com insuficiência renal crônica em hemodiálise no Amazonas. Rev Med Bras. 2003;49:72-8. 22. Avesani CM, Kamimura MA, Draibe SA, Cuppari L. Is energy
intake underestimated in nondialyzed chronic kidney disease patients? J Ren Nutr. 2005 Jan;15(1):159-65.
CONCLUSÕES: 1) 0s teores de proteinas, lípides e carboidratos na dieta exibiram um certo número de corre-lações com variáveis antropométricas e de bioimpedância; 2) A ingestão lipídica foi o melhor índice nesta experiên-cia, ultrapassando a proteina ou o ganho energético total; 3) Em que pesem algumas limitações, o recordatório
ali-mentar foi útil na avaliação destes pacientes de hemodiálise;
23. Rocco MV, Dwyer JT, Larive B, Greene T, Cockram DB, Chumlea WC, et al. The effect of dialysis dose and membrane flux on nutritional parameters in hemodialysis patients. Results of the HEMO study. Kidney Int. 2004;65:2321-24.
24. Dwyer JT, Larive B, Leung J, Rocco M, Burrowes JD, Chumlea WC, et al. Nutritional status affects quality of life in hemodialysis (HEMO) study patients at baseline. J Ren Nutr. 2002;12:213-23. 25. King K. Multidisciplinary contributions to rehabilitation: a National Foundation survey of the dialysis health care team. Adv Ren Replace Ther. 2003;10:78-83.
26. Chumlea WC, Dwyer J, Bergen C, Burkart J, Paranandi L, Frydrych A, et al. Nutritional status assessed from anthropometric measures in the HEMO study. J Ren Nutr. 2003;13:31-8.
27. Qureshi AR, Alvestrand A, Danielsson A, Divino-Filho JC, Gutierrez A, Lindholm B, et al. Factors predicting malnutrition in hemodialysis patients: a cross-sectional study. Kidney Int. 1998;53:773-82.
28. Santos NS, Draibe SA, Kamimura MA, Canziani ME, Cendoroglo M, Junior AG, et al. Is serum albumin a marker of nutritional status in hemodialysis patients without evidence of inflammation? Artif Organs. 2003;27:681-6.
29. Fernandez-Reyes MJ, Alvarez-Ude F, Sanchez R, Mon C, Iglesias P, Vazquez A. Estado nutricional, comorbilidad y inflamacion en hemodialisis. Nefrologia. 2000;20:540-9.
30. Don BR, Kaysen GA. Assessment of inflammation and nutrition in patients with end stage renal disease. J Nephrol. 2000;13:249-59. 31. Kalantar-Zadeh K, Rodriguez RA, Humphreys MH. Association between serum ferritin and measures of inflammation, nutrition and iron in haemodialysis patients. Nephrol Dial Transplant. 2004;19:141-9.
32. Zimmermann J, Herrlinger S, Pruy A, Metzger T, Wanner C. Inflammation enhances cardiovascular risk and mortality in hemodialysis patients. Kidney Int. 1999;55:648-58.