CLINICAL INVESTIGATION
www.bjournal.com.br
www.bjournal.com.br
Braz J Med Biol Res, July 2012, Volume 45(7) 591-600
doi:
10.1590/S0100-879X2012007500059
Percent body fat is a better predictor of cardiovascular risk factors
than body mass index
Qiang Zeng, Sheng-Yong Dong, Xiao-Nan Sun, Jing Xie and Yi Cui
Institutional Sponsors
The Brazilian Journal of Medical and Biological Research is partially financed by
Faculdade de Medicina de Ribeirão Preto Campus
Ribeirão Preto
Explore High - Performance MS Orbitrap Technology In Proteomics & Metabolomics
Brazilian Journal of Medical and Biological Research (2012) 45: 591-600 ISSN 0100-879X
Percent body fat is a better predictor of
cardiovascular risk factors than
body mass index
Qiang Zeng*, Sheng-Yong Dong*, Xiao-Nan Sun, Jing Xie and Yi Cui
International Medical Center, Chinese PLA General Hospital, Beijing, China
Abstract
The objective of the present study was to evaluate the predictive values of percent body fat (PBF) and body mass index (BMI) for
cardiovascular risk factors, especially when PBF and BMI are conflicting. BMI was calculated by the standard formula and PBF
was determined by bioelectrical impedance analysis. A total of 3859 ambulatory adult Han Chinese subjects (2173 males and 1686 females, age range: 18-85 years) without a history of cardiovascular diseases were recruited from February to September
2009. Based on BMI and PBF, they were classified into group 1 (normal BMI and PBF, N = 1961), group 2 (normal BMI, but abnormal PBF, N = 381), group 3 (abnormal BMI, but normal PBF, N = 681), and group 4 (abnormal BMI and PBF, N = 836).
When age, gender, lifestyle, and family history of obesity were adjusted, PBF, but not BMI, was correlated with blood glucose
and lipid levels. The odds ratio (OR) and 95% confidence interval (CI) for cardiovascular risk factors in groups 2 and 4 were 1.88 (1.45-2.45) and 2.06 (1.26-3.35) times those in group 1, respectively, but remained unchanged in group 3 (OR = 1.32, 95%CI = 0.92-1.89). Logistic regression models also demonstrated that PBF, rather than BMI, was independently associated
with cardiovascular risk factors. In conclusion, PBF, and not BMI, is independently associated with cardiovascular risk factors, indicating that PBF is a better predictor.
Key words: Obesity; Body composition; Body mass index; Cardiovascular disease; Risk factor; Percent body fat; Bioelectrical impedance
Introduction
Correspondence: Qiang Zeng, International Medical Center, Chinese PLA General Hospital, 28 Fuxing Road, Beijing 100853, China. E-mail: zq301@hotmail.com
*These authors contributed equally to this study.
Received October 3, 2011. Accepted April 9, 2012. Available online April 20, 2012. Published July 2, 2012. Obesity, a metabolic disorder characterized by the
accumulation of excessive body fat, is closely associated with metabolic derangement-related diseases, and may also lead to cardiovascular diseases, diabetes, and joint problems. The prevalence of obesity is increasing rapidly in the world, exacting a heavy toll both socially and economi-cally. In the United States, recent trends in obesity indicate that the prevalence of obesity or overweight among 20- to 74-year-old adults increased to almost 66% from 1980 to 2004, and it has been estimated that obesity accounts for 5 to 15% of total annual deaths (1,2). In China, more than one third of the adults are overweight or obese, and 10 to 20% of the adult population has diseases related to meta-bolic disorders (3). Stewart et al. (4) have warned that if we fail to address continued increases in obesity, we may risk eroding the pattern of steady gains in health, which we
have achieved since the early 20th century.
is limited; it cannot accurately categorize individuals who have a normal body weight with too much body fat but too little muscle and those who have an excessive body weight with too little body fat but too much muscle (7,8). Recently, a meta-analysis of 32 different samples comprising a total of 31,968 patients revealed that the commonly used BMI cutoff values to diagnose obesity fail to identify half of the people with excess percent body fat (PBF) (9).
Although BMI appears to be a good indicator of the deposition of excess energy as fat in adult white men and women in Europe and North America, several studies suggest that BMI is less appropriate for Asian populations who differ in body build and body proportions (10,11), a fact that could result in misclassification because of the different contributions of bone mass, muscle mass, and fluid to body weight. In a recent study, it was demonstrated that the currently recommended BMI cutoff scores to define overweight and obesity overestimated overweight and obesity prevalence in African-American men and women, and underestimated prevalence in Asian-Indian men and women, Asian women and Hispanic women, indicating a racial/ethnic bias of the universal overweight and obesity BMI cutoff scores (8). Therefore, it is necessary to develop and redefine appropriate country-specific and ethnicity-specific BMI cutoff values and assess the validity and utility of other measures such as PBF, in order to facilitate the development of preventive and therapeutic strategies to minimize the health risks resulting from obesity.
PBF is defined as the proportion of individual fat mass over body weight. Previous studies have shown that PBF more accurately reflects body composition than BMI, al -though both BMI and PBF have been used for the evaluation of human health risks such as cardiovascular risk in clinical practice (12,13). A higher PBF and/or BMI often indicates a higher level of cardiovascular risk (14). However, the relationship between PBF and BMI is not linear (15,16). A high PBF does not necessarily mean a high BMI, and vice versa. Thus, there is a need to accurately determine the cardiovascular risk in individuals who have a normal PBF but a high BMI or a high PBF but a normal BMI. In other words, whether BMI or PBF more accurately predicts cardiovascular risk factors needs to be evaluated.
Since the 1990s, a bioelectrical impedance technique has been widely used to measure the content of different tissues noninvasively, based on their differences in electric conductivity and it may provide an index of total body water, from which the fat-free mass and PBF can be derived (17). Using this technique, we previously demonstrated that PBF better reflected cardiac function and arterial compliance than other currently used indices such as BMI (18).
In the present study, we determined the correlations of BMI and PBF with cardiovascular risk factors such as hy-pertension, dyslipidemia and hyperglycemia by measuring the body composition of 3859 subjects using the bioelectri-cal impedance technique. Furthermore, we evaluated the
predictive values of PBF and BMI for the cardiovascular risk factors.
Material and Methods
Subjects
All ambulatory adult subjects aged over 18 years who underwent a routine thorough health examination at the Chi-nese PLA General Hospital, Beijing, China, from February to September 2009 were enrolled. However, subjects with the following conditions were excluded: a history of acute coronary syndromes and/or cardiac infarction, any cardiac and renal dysfunction, a stroke history within the previous 6 months, a history of malignancy, severe hepatic disease, chronic consumptive diseases, anemia and severe malnu-trition, pregnancy, and a history of hyperthyroidism and/ or hypothyroidism. In addition, those who were previously diagnosed and treated for hypertension, type II diabetes mellitus and dyslipidemia were also excluded from the study. The subjects who did not meet the exclusion criteria were informed of the research contents and enrolled in the study after they signed an informed consent form. Ethical approval for this study was provided by the Institutional Review Board of Chinese PLA General Hospital, Beijing, China (Chairman Prof. Kun-Lun He) on January 25, 2009.
Measurement of body composition and categorizations of PBF and BMI
Body composition was measured by appropriately trained medical care providers at the Health Examination Center of the Chinese PLA General Hospital. All subjects wore light clothing and stood in the upright position without shoes during the measurement. Height, waist circumference and hip circumference were measured to an accuracy of 0.1 cm and body weight to an accuracy of 0.1 kg. BMI and waist-hip ratio (WHR) were calculated from the following two equations, respectively: BMI = body weight/height2 (kg/
m2), and WHR = waist circumference/hip circumference
Percent body fat predicts cardiovascular risk 593
body weight x 100.
Obesity was diagnosed if a subject had a BMI ≥25 kg/ m2 (both male and female) or PBF ≥25% (male) or ≥30%
(female) according to Asian BMI criteria (19) and the U.S. National Institutes of Health criterion standards for PBF (20). In addition, the subjects were further separated into four groups: group 1 (both normal BMI and PBF) = BMI <25 kg/m2 and PBF <25% (male) or <30% (female); group
2 (normal BMI, but abnormal PBF) = BMI <25 kg/m2 and
PBF ≥25% (male), or ≥30% (female); group 3 (abnormal BMI, but normal PBF) = BMI ≥25 kg/m2 and PBF <25%
(male), or <30% (female), and group 4 (both abnormal BMI and PBF) = BMI ≥25 kg/m2 and PBF ≥25% (male),
or ≥30% (female).
Measurement and definition of cardiovascular risk
factors
After the subjects were seated and rested for 10 min, systolic blood pressure (SBP) and diastolic blood pressure (DBP) were measured on the right arm using an electronic sphygmomanometer. Fasting blood samples were obtained in the early morning via the antecubital vein, preserved in a pre-chilled EDTA anticoagulation tube, and submitted to the Clinical Laboratory of PLA General Hospital for analysis. Fasting plasma glucose (FPG), total cholesterol (TC), triglyc-eride (TG), and high-density lipoprotein cholesterol (HDL-C) were determined using an Architect Ci8200-intergrated system (Abbott Laboratories, USA). Low-density lipoprotein cholesterol (LDL-C) concentration was calculated using the Friedewald equation (LDL-C (mM) = TC - [HDL-C + TG / 2.2]) (21). Then, cardiovascular risk factors includ-ing hypertension, hyperglycemia, and dyslipidemia were defined on the basis of the above listed variables in the present study (22).
In the present study, cardiovascular risk factors were defined as abnormal blood pressure and serum biochemical parameters such as lipids and glucose. The critical values of cardiovascular risk factors were designated as follows according to the 2009 American Diabetes Association Stan-dards of Medical Care in Diabetes (23), the 2007 European Hypertension Guideline (22), and the 2007 Prevention and Treatment Guideline for Blood Lipid Abnormality in Chinese Adults (24): hypertension = SBP ≥130 mmHg and/or DBP ≥85 mmHg; hyperglycemia = FPG ≥5.6 mM (100 mg/dL); dyslipidemia = TC ≥5.18 mM (200 mg/dL), and/or TG ≥1.70 mM (150 mg/dL) and/or LDL-C ≥3.37 mM (130 mg/dL) and/ or HDL-C <1.04 mM (40 mg/dL). In the present study, the criteria of the Prevention and Treatment Guideline for Blood Lipid Abnormality in Chinese Adults (24) were considered to be more suitable although the expert group from the National Cholesterol Education Program Adult Treatment Panel III (NCEP ATP III) (25) used different diagnostic criteria for dyslipidemia.
In addition, gender, age, lifestyle (including smoking, drinking and exercise), and family history of obesity were
also considered as confounding risk factors in the present study. Smoking was defined as daily smoking of 10 or more cigarettes, cigars or pipes for at least 12 months at the time of the study (26). Drinking was defined as moderate to heavy alcohol consumption (an average of at least 15 g/day) at the time of the study. Exercise was defined as an average of at least moderate-intensity aerobic (endurance) physical activity for a minimum of 30 min on 5 days within a week (requiring ≥3 metabolic equivalents an hour, including brisk walking) at the time of the study (27). A family history of obesity, type 2 diabetes, hypertension, stroke, and coronary heart disease was also included in the study.
Statistical analysis
Categorical variables were reported as frequency and percentages while numerical variables were reported as means ± SD when they were normally distributed and as median and range if the data were abnormally distributed. The difference in numerical variables between two groups was analyzed using the Student t-test, and the difference between multiple groups was analyzed by analysis of vari-ance (ANOVA), with post hoc multiple comparisons being performed using the Student-Newman-Keuls test. The chi-square test was used to analyze the differences in gender, age composition, lifestyle, family history, and cardiovascular risk factors among groups.
The odds ratio (OR) of cardiovascular risk factors in groups 2, 3, and 4, compared to group 1 (used as a refer-ence) was analyzed by a multivariate logistic regression model where gender, age, lifestyle (including smoking, drinking and exercise), and BMI-PBF-based grouping were set as independent variables. Correlations of BMI and PBF with blood pressure, glucose and lipids were calculated using Pearson correlation analysis, and partial correlation analysis was used to adjust for gender, age, lifestyle, and family history. Several logistic regression models as well as the Poisson regression model were applied to determine if there was a difference in the OR of cardiovascular risk factors between BMI and PBF by setting different depen-dent and independepen-dent variables in the logistic regression analysis. All statistical analyses were conducted using the SPSS software (version 10; SPSS Inc., USA). A P value of <0.05 (two-tailed) was considered to be statistically significant.
Results
General characteristics and metabolic parameters of the study subjects in relation to the categorization by BMI and PBF
1, whereas there were more females than males in group 2 (83.7%) and more males than females in groups 3 (89.7%) and 4 (60.3%). Approximately 90% of subjects were aged 30-60 years in the four groups. The proportions of smokers and drinkers were highest in group 3 and lowest in group 2. There appeared to be no difference in the proportion of subjects who exercised and with a family history of obesity, type 2 diabetes, hypertension, stroke, and coronary heart disease among the four groups.
The following body composition indices such as BMI, PBF and WHR and cardiovascular risk variables, such as age, SBP, DBP, FPG, TC, TG, HDL-C, and LDL-C are also shown in Table 1. There were significant differences in all variables among the four groups (all P < 0.05). Post hoc
multiple comparison further showed that age and PBF were the highest in group 2. BMI, WHR, blood pressure, FPG,
TC, and LDL-C were the highest in group 4 and the lowest in group 1. Compared to group 3, HDL-C was higher, and the other risk factor variables (except TC) were lower in group 2 (Table 1).
Cardiovascular risk factors of the study subjects
A total of 2633 (68.2%) of the 3859 study subjects were found to have one or more cardiovascular risk factors. The rates were 79.4% (1725/2173) in males and 53.9% (908/1686) in females. The prevalence of hypertension, hyperglycemia, dyslipidemia, and two or more concomitant cardiovascular risk factors was higher in males than in females (all P< 0.001; Figure 1).
The proportions of subjects with hypertension, hyperg-lycemia and dyslipidemia among subjects were 16.0 (N = 618), 34.6 (N = 1334), and 49.5% (N = 1910), respectively
Table 1. General characteristics and metabolic parameters of the study subjects in relation to the classification by body mass index
(BMI) and percent body fat (PBF).
Variables (N = 3859) Group 1 [normal BMI/
normal PBF (N = 1961)] abnormal PBF (N = 381)]Group 2 [normal BMI/ Group 3 [abnormal BMI/normal PBF (N = 681)] abnormal PBF (N = 836)]Group 4 [abnormal BMI/ P value
Gender <0.001
Male 996 (50.8) 62 (16.3) 611 (89.7) 504 (60.3)
Female 965 (49.2) 319 (83.7) 70 (10.3) 332 (39.7)
Age group <0.001
Less than 30 years 208 (10.6) 10 (2.6) 34 (5.0) 50 (6.0)
30-44 years 1092 (55.7) 173 (45.4) 382 (56.1) 391 (46.8)
45-59 years 605 (30.9) 181 (47.5) 251 (36.9) 367 (43.9)
60 years and above 56 (2.9) 17 (4.5) 14 (2.1) 28 (3.3)
Lifestyle
Smoking 375 (19.1) 30 (7.9) 231 (33.9) 225 (26.9) <0.001
Drinking 251 (12.8) 25 (6.6) 137 (20.1) 119 (14.2) <0.001
Exercise 564 (28.8) 103 (27.0) 210 (30.8) 245 (29.3) 0.692
Family history 225 (11.5) 51 (13.4) 84 (12.3) 107 (12.8) 0.629
Age (years) 40.85 ± 9.14† 45.16 ± 8.03¶ 42.66 ± 7.85‡ 43.75 ± 8.69§ <0.001 BMI (kg/m2) 21.88 ± 2.04† 23.22 ± 1.23‡ 26.46 ± 1.25§ 27.94 ± 2.18¶ <0.001 PB (%) 20.53 ± 6.01† 31.76 ± 3.16¶ 22.31 ± 3.05‡ 31.01 ± 4.47§ <0.001 WHR 0.81 ± 0.05† 0.85 ± 0.03‡ 0.91 ± 0.03§ 0.96 ± 0.06¶ <0.001 SBP (mmHg) 109.81 ± 11.21† 111.81 ± 11.46‡ 116.52 ± 9.77§ 118.07 ± 10.00¶ <0.001 DBP (mmHg) 72.04 ± 8.05† 73.23 ± 7.72‡ 77.35 ± 6.93§ 77.95 ± 7.15§ <0.001 FPG (mM) 5.34 ± 0.43† 5.42 ± 0.45‡ 5.50 ± 0.40§ 5.54 ± 0.41§ <0.001 TC (mM) 4.58 ± 0.88† 4.80 ± 0.88‡ 4.84 ± 0.85‡§ 4.91 ± 0.90§ <0.001 TG (mM) 1.22 ± 0.85† 1.30 ± 0.79† 1.87 ± 1.16§ 1.76 ± 1.05‡ <0.001 HDL-C (mM) 1.48 ± 0.38§ 1.50 ± 0.36§ 1.18 ± 0.27† 1.27 ± 0.30‡ <0.001 LDL-C (mM) 2.54 ± 0.78† 2.71 ± 0.79‡ 2.80 ± 0.82§ 2.85 ± 0.81§ <0.001
Data are reported as number with percent in parentheses or means ± SD. P values were obtained from comparisons among the four groups. The chi-square test was used to analyze categorical variables and ANOVA was used to analyze numerical variables. †, ‡, §, and ¶ were derived from post hoc multiple comparisons (S-N-K). The level of significance was 0.05. In a row, different symbols indicate statistically significant differences. Group 1 (both normal BMI and PBF): BMI <25 kg/m2 and PBF <25% (male) or <30% (female);
group 2 (normal BMI but abnormal PBF): BMI <25 kg/m2 and PBF ≥25% (male) or ≥30% (female); group 3 (abnormal BMI but normal
PBF): BMI ≥25 kg/m2 and PBF <25% (male) or <30% (female); group 4 (both abnormal BMI and PBF): BMI ≥25 kg/m2 and PBF ≥25%
Percent body fat predicts cardiovascular risk 595
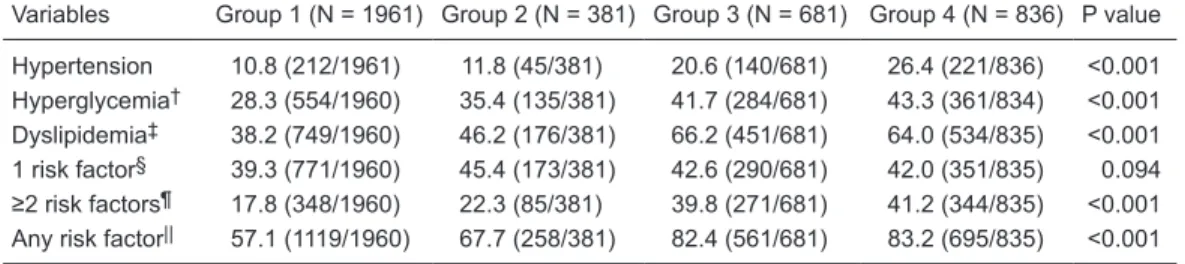
(Table 2). Whereas 41.1% (N = 1585) of the subjects were found to have a single cardiovascular risk factor, 27.2% (N = 1048) had two or more cardiovascular risk factors. The probability of having only one risk factor did not differ among groups. However, the probability of having two or more risk factors was significantly different among groups (P< 0.001), being the lowest (17.8%) in group 1 and the highest (41.2%) in group 4 (Table 2). The prevalence of hypertension, hy-perglycemia and dyslipidemia was the lowest in group 1. The prevalence of hypertension and hyperglycemia was the highest in group 4, while the prevalence of dyslipidemia was the highest in group 3 (Table 2).
In the risk analysis, when group 1 (low BMI and PBF) was used as the reference, and gender, age and lifestyle
(including smoking, drinking and exercise) were adjusted by logistic regression analysis, the risk for any of the car-diovascular risk factors in groups 2 (low BMI, but high PBF) and 4 (high BMI and PBF) were 1.88 (95%CI = 1.45-2.45, P< 0.001) and 2.06 (95%CI = 1.26-3.35, P= 0.004) times those in group 1, respectively. No significant difference in cardiovascular risk factors was found between group 3 (high BMI, but low PBF) and group 1 (OR = 1.32, 95%CI = 0.92-1.89, P= 0.128; Figure 2).
Correlations between BMI/PBF and blood pressure, glucose and lipid
In order to further determine the difference in the evalu-ation of cardiovascular risk factors between BMI and PBF,
Figure 1. The prevalence of cardiovascular risk factors among males and females. *The P value was
ob-tained from the chi-square test. †Data were lost for 3 individuals. ‡Data were lost for 2 individuals. §Data
of blood glucose and lipids were lost for 2 individuals. 1 risk factor = subjects with a single cardiovascular risk factor. ≥2 risk factors = subjects with two or more simultaneous cardiovascular risk factors. Any risk factor = subjects with one or more simultaneous cardiovascular risk factors.
Table 2. Cardiovascular risk factors of the study subjects in relation to classification by body mass index and
percent body fat.
Variables Group 1 (N = 1961) Group 2 (N = 381) Group 3 (N = 681) Group 4 (N = 836) P value
Hypertension 10.8 (212/1961) 11.8 (45/381) 20.6 (140/681) 26.4 (221/836) <0.001 Hyperglycemia† 28.3 (554/1960) 35.4 (135/381) 41.7 (284/681) 43.3 (361/834) <0.001
Dyslipidemia‡ 38.2 (749/1960) 46.2 (176/381) 66.2 (451/681) 64.0 (534/835) <0.001
1 risk factor§ 39.3 (771/1960) 45.4 (173/381) 42.6 (290/681) 42.0 (351/835) 0.094
≥2 risk factors¶ 17.8 (348/1960) 22.3 (85/381) 39.8 (271/681) 41.2 (344/835) <0.001
Any risk factor|| 57.1 (1119/1960) 67.7 (258/381) 82.4 (561/681) 83.2 (695/835) <0.001
Groups 1-4 are identified in Table 1. Data are reported as percent (number of abnormal subjects/number of
subjects in group x 100). The Pvalue was obtained from the chi-square test. †Data for 3 individuals were lost. ‡Data for 2 individuals were lost. §Subjects with a single cardiovascular risk factor. ¶Subjects with two or more
cardiovascular risk factors simultaneously. ||Subjects with one or more cardiovascular risk factors
correlations between BMI/PBF and major cardiovascular risk variables including blood pressure, glucose and lipids were first analyzed. We found that BMI was negatively correlated with HDL-C while PBF showed no correlation with HDL-C. Both BMI and PBF were positively corre-lated with the other variables (Table 3). After other confounding factors such as age, gender, lifestyle, and family history were adjusted by partial cor-relation analysis, BMI was found to be positively correlated with SBP and DBP, and negatively correlated with HDL-C; however, it showed no correlations with TC, TG, LDL-C, or FPG. On the other hand, PBF was positively correlated with TG, TC, LDL-C, and FPG, and nega-tively correlated with HDL-C, although it showed no correlations with SBP and DBP (Table 3).
Logistic regression of independent
factors associated with cardiovas
-cular risk factors
We further carried out a logistic regression analysis using one or more risk factors as dependent variables, with the absence of any of the three cardio-vascular risk factors set as 0 and the presence of one or more risk factors of the three cardiovascular risk factors as 1. The confounding factors such as gender, age, WHR, BMI, PBF, smoking, drinking, exercise, and family history were treated as independent variables. BMI*PBF was also included in the logistic regression analysis in order to determine whether there was an interaction between BMI and PBF in terms of association with cardiovascular risk factors, and the effect of PBF on the association of BMI with cardiovascular risk factors.
Cardiovascular risk factors were not associated with BMI (OR = 1.01, 95%CI = 0.91-1.12, P= 0.870), but were correlated with gender, age, PBF, and smoking, as the OR of cardiovascular risk factors about PBF was 1.04 (95%CI = 1.00-1.07, P= 0.028). Moreover, no interaction was found between the BMI and PBF association with cardiovascular risk factors (OR = 1.00, 95%CI =
0.90-1.13, P = 0.955) (Table 4). Poisson regression analysis also revealed that cardiovascular risk factors were associated
with PBF rather than BMI (Supplementary Table S1). Furthermore, when the probability of having hyperten-sion, dyslipidemia, or hyperglycemia was set as a dependent
Figure 2. Risks for any of the cardiovascular risk factors according to subject groups
classified by body mass index (BMI) and percent body fat (PBF). *P < 0.01; gender,
age, and lifestyle (including smoking, drinking and exercise) were adjusted by the logistic regression analysis (Wald test). Low BMI and PBF was set as a reference.
Low BMI and PBF = BMI <25 kg/m2, and PBF <25% (male) or <30% (female); low
BMI and high PBF = BMI <25 kg/m2, and PBF ≥25% (male) or ≥30% (female); high
BMI and low PBF = BMI ≥25 kg/m2 and PBF <25% (male) or <30% (female); high BMI
and PBF = BMI ≥25 kg/m2 and PBF ≥25% (male) or ≥30% (female). 95%CI = 95%
confidence interval.
Table 3. Correlations between body mass index/percent body fat and blood pressure,
glucose and lipids.
Body mass index Percent body fat
Correlation
coefficient Partial correlation coefficient Correlation coefficient Partial correlation coefficient
SBP (mmHg) 0.403† 0.071† 0.098† -0.006
DBP (mmHg) 0.409† 0.054† 0.075† 0.008
FPG (mM) 0.249† 0.02 0.088† 0.038*
TC (mM) 0.169† -0.019 0.112† 0.078†
TG (mM) 0.350† -0.021 0.049† 0.051†
HDL-C (mM) -0.432† -0.063† -0.003 -0.050†
LDL-C (mM) 0.189† 0.016 0.097† 0.079†
P values were obtained from Pearson correlation analysis and partial correlation analysis. *P < 0.05 and †P < 0.01 (t-test). Confounding factors such as age, gender,
lifestyle, and family history were adjusted in the partial correlation analysis. SBP = sys
Percent body fat predicts cardiovascular risk 597
variable separately, PBF was able to predict the probability of hypertension (OR = 1.03, 95%CI = 1.01-1.04, P= 0.001), dyslipidemia (OR = 1.05, 95%CI = 1.02-1.09, P= 0.001) and hyperglycemia (OR = 1.03, 95%CI = 1.00-1.07, P= 0.038), whereas BMI failed to predict the probability of hypertension (OR = 1.09, 95%CI = 0.99-1.20, P= 0.076), dyslipidemia (OR = 0.97, 95%CI = 0.87-1.07, P= 0.511) and hyperglycemia (OR = 1.09, 95%CI = 0.99-1.20, P= 0.083) (Table 4).
Discussion
BMI and PBF are both used clinically to identify the presence of obesity in individuals. However, persons with a normal BMI but a high PBF, or a high BMI but a normal PBF can be identified when both parameters are used. In the present study, more than one quarter (27.5%) of the 3859 subjects fell into normal BMI and high PBF or high BMI and normal PBF. We showed that individuals with a normal BMI but a high PBF exhibited a cardiovascular risk profile similar to that of those with a high BMI and a high PBF, whereas individuals with a high BMI but a normal PBF showed a cardiovascular risk profile similar to that of those with a normal BMI and a normal PBF (Figure 2). Moreover, partial correlation analysis revealed that PBF was more closely correlated with blood pressure, glucose and lipids than BMI (Table 3), and logistic regression analysis also revealed that PBF, rather than BMI, was independently associated with cardiovascular risk factors (Table 4). These findings indicate that PBF should be a better predictor of cardiovascular risk factors than BMI among these subjects.
The present study also demonstrated that females predominated (83.7%) in group 2 (high PBF but normal BMI) and males predominated (89.7%) in group 3 (high BMI but normal PBF; Table 1). This finding agrees with previ -ous observations that more females have a high PBF but normal BMI and more males have a high BMI but normal PBF (7,10,15). Our data also indicate that the prevalence of cardiovascular risk factors was higher in males than in females (Figure 1). Since males dominated in group 3 (high BMI but normal PBF), it is not a surprise that the overall prevalence of cardiovascular risk factors in group 3 (high BMI but normal PBF) was higher than in group 2 (Table 2). Since age and lifestyle may also influence the comparison, the results of cardiovascular risk factors among the four groups (28,29), gender, age, and lifestyle were adjusted in the logistic regression analysis, which showed that the cardiovascular risk was relatively higher in group 2 (low BMI, but high PBF) than in group 3 (high BMI, but low PBF) when group 1 (low BMI and PBF) was used as a reference (Figure 2).
BMI is only an indirect measure of body fat mass and thus may not accurately reflect cardiovascular risks and hu -man metabolic disorders (30). Wang et al. (31) investigated 4907 Chinese subjects and found that BMI had limited
in-terpreting power for subjects with BMI in the mid-range (24 and 27.9 kg/m2) although it correlated very well with PBF.
PBF, on the other hand, reflects body composition and is directly correlated with cardiovascular risks (12,13,32). We previously demonstrated that PBF better reflected cardiac function and arterial compliance than BMI (18).
In the present study, we showed that, although BMI was correlated with blood pressure, glucose and lipid in univariate correlation analysis, the correlation disappeared when confounding factors such as age, gender, lifestyle, and family history were adjusted (Table 3) and logistic re-gression analysis further demonstrated that BMI was not associated with cardiovascular risk factors (Table 4). PBF, on the other hand, was well correlated with cardiovascular
Table 4. Logistic regression analysis of variables independently
associated with cardiovascular risk factors.
Model χ2 value P value Odds ratio (95%CI)
Model 1†
BMI (kg/m2) 0.027 0.870 1.01 (0.91-1.12)
PBF (%) 4.850 0.028 1.04 (1.00-1.07) BMI*PBF 0.003 0.955 1.00 (0.90-1.13) Model 2‡
BMI (kg/m2) 3.140 0.076 1.09 (0.99-1.20)
PBF (%) 10.862 0.001 1.03 (1.01-1.04) BMI*PBF 0.103 0.748 0.98 (0.89-1.09) Model 3§
BMI (kg/m2) 0.433 0.511 0.97 (0.87-1.07)
PBF (%) 10.147 0.001 1.05 (1.02-1.09) BMI*PBF 1.136 0.287 0.95 (0.85-1.05) Model 4¶
BMI (kg/m2) 3.008 0.083 1.09 (0.99-1.20)
PBF (%) 4.305 0.038 1.03 (1.00-1.07) BMI*PBF 0.119 0.730 0.98 (0.89-1.09)
The inclusion criterion for variables was 0.05 and the exclusion criterion was 0.10. †The probability of having one or more risk
factors was set as a dependent variable, and the confounding factors such as gender, age, waist-hip ratio (WHR), body mass index (BMI), percent body fat (PBF), BMI*PBF, smoking, drinking, exercise, and family history were set as independent variables. BMI*PBF represented the interaction between PBF and BMI in terms of association with cardiovascular risk factors. ‡The
prob-ability of having hypertension was set as a dependent variable, and gender, age, WHR, BMI, PBF, BMI*PBF, smoking, drinking, exercise, family history, dyslipidemia, and hyperglycemia were set as independent variables. §The probability of having
dyslipi-demia was set as a dependent variable, and gender, age, WHR, BMI, PBF, BMI*PBF, smoking, drinking, exercise, family history, hypertension and hyperglycemia were set as independent vari-ables. ¶The probability of having hyperglycemia was set as a
de-pendent variable, and gender, age, WHR, BMI, PBF, BMI*PBF, smoking, drinking, exercise, family history, hypertension, and
risk factors even when confounding factors were considered (Table 3). We found that increased PBF was associated with increased cardiovascular risk factors (Table 4). Indeed, Romero-Corral et al. and others (33,34) reported that indi-viduals with a high body fat content but a normal BMI (i.e., normal weight obesity) were more predisposed to type II diabetes mellitus and cardiovascular disease.
Individuals routinely practicing vigorous exercise would be considered overweight or obese when assessed by BMI but they may be considered normal if assessed by PBF. The excessive body weight in these muscular individuals who have a normal fat mass does not influence their car -diovascular risks. For example, Segal et al. (35) reported that the cardiovascular risk of males with a normal PBF but a high BMI was comparable to that of males with normal PBF and BMI. Oreopoulos et al. (32) studied 140 patients with cardiac failure and found that those with a high lean mass had a longer survival. In the present study, we also showed that individuals with a high BMI but a normal PBF did not exhibit an appreciably enhanced cardiovascular risk compared to those with a normal body weight after gender, age and lifestyle were adjusted (Figure 2).
Several limitations of the present study should be rec-ognized. The application of the bioelectrical impedance method for the determination of PBF has been reported to be less accurate than underwater weighing, dual-energy X-ray absorptiometry or air replacement plethysmography (36), and its validity has been doubted for use in large epi-demiological studies (37). However, due to its efficiency, feasibility and safety, the method is being still widely ap-plied in various recent studies for the measurement of body composition, estimation of visceral fat area, assessment of certain diseases such as liver steatosis and local arterial stiffness, and prediction of cell viability during ischemia and reperfusion in rat liver (38-40). In a previous study, we also used this technique to study the correlation of body compo-sition and cardiac function in 325 healthy subjects (18). In the present study, we used the same method to study 3859 subjects and, consistent with our previous study, we found that PBF would probably be a better predictor than BMI of cardiovascular risk factors in the study subjects. It should be
kept in mind that some kinds of variance such as race and medical conditions would be expected at the individual level, which might impact the PBF measurement by bioelectrical impedance analysis, and thus the subsequent outcome of the relationship between PBF and cardiovascular risk fac-tors. However, in the present study, all subjects were of the Han nationality, and certain diseases were excluded, and thus the results obtained here were less influenced by race and underlying medical conditions. In addition, there was no widely accepted standard criterion or cutoff of PBF for defining overweight or obesity by the PBF method. In the present study, we used the cutoff of PBF ≥25% (male) or ≥30% (female) to define abnormal fat using the National Institutes of Health criteria for PBF, which does state that “Most health care providers agree that men with more than 25 percent body fat and women with more than 30 percent body fat are considered obese” (20).
In conclusion, after adjustment of confounding factors such as age, gender, lifestyle, and family history, BMI is positively correlated with SBP and DBP, and negatively correlated with HDL-C, but lacks any correlations with TC, TG, LDL-C, and FPG, whereas PBF is positively correlated with TG, TC, LDL-C, and FPG, and negatively correlated with HDL-C. Moreover, logistic regression analysis reveals that PBF, and not BMI, is independently associated with cardiovascular risk factors. Therefore, in clinical practice, we should pay more attention to the measurement of body composition and PBF, in an attempt to predict cardiovascular risk factors, particularly when BMI and PBF contradict each other in Chinese people.
Acknowledgments
The authors gratefully acknowledge the skillful assis-tance of the doctors and staff of the International Medical Center in the Chinese PLA General Hospital for technical help with measurements of body composition. We thank Medjaden Bioscience Limited for assisting with the prepara-tion of the manuscript. Research supported in part by the National Natural Science Foundation of China (#30570738; http://www.nsfc.gov.cn/Portal0/default124.htm).
References
1. Ogden CL, Yanovski SZ, Carroll MD, Flegal KM. The epidemiology of obesity. Gastroenterology 2007; 132: 2087-2102.
2. Flegal KM, Graubard BI, Williamson DF, Gail MH. Excess deaths associated with underweight, overweight, and obe-sity. JAMA 2005; 293: 1861-1867.
3. Jia WP, Wang C, Jiang S, Pan JM. Characteristics of obesity and its related disorders in China. Biomed Environ Sci 2010; 23: 4-11.
4. Stewart ST, Cutler DM, Rosen AB. Forecasting the effects of obesity and smoking on U.S. life expectancy. N Engl J Med
2009; 361: 2252-2260.
5. Steinberger J, Kelly AS. Cardiovascular risk at the extremes of body composition. J Pediatr 2006; 149: 739-740. 6. Whitlock G, Lewington S, Sherliker P, Clarke R, Emberson
J, Halsey J, et al. Body-mass index and cause-specific
mortality in 900,000 adults: collaborative analyses of 57 prospective studies. Lancet 2009; 373: 1083-1096. 7. Romero-Corral A, Somers VK, Sierra-Johnson J, Thomas
Percent body fat predicts cardiovascular risk 599
8. Jackson AS, Ellis KJ, McFarlin BK, Sailors MH, Bray MS.
Body mass index bias in defining obesity of diverse young
adults: the Training Intervention and Genetics of Exercise Response (TIGER) study. Br J Nutr 2009; 102: 1084-1090. 9. Okorodudu DO, Jumean MF, Montori VM, Romero-Corral A,
Somers VK, Erwin PJ, et al. Diagnostic performance of body
mass index to identify obesity as defined by body adiposity:
a systematic review and meta-analysis. Int J Obes 2010; 34: 791-799.
10. Who Expert Consultation. Appropriate body-mass index for Asian populations and its implications for policy and inter-vention strategies. Lancet 2004; 363: 157-163.
11. Low S, Chin MC, Ma S, Heng D, Durenberg-Yap M.
Ratio-nale for redefining obesity in Asians. Ann Acad Med Singa-pore 2009; 38: 66-69.
12. Imamura Y, Uto H, Oketani M, Hiramine Y, Hosoyamada K, Sho Y, et al. Association between changes in body composi-tion and the increasing prevalence of fatty liver in Japanese men. Hepatol Res 2008; 38: 1083-1086.
13. Bandyopadhyay A. Anthropometry and body composition in soccer and volleyball players in West Bengal, India. J Physiol Anthropol 2007; 26: 501-505.
14. Akay AF, Gedik A, Tutus A, Sahin H, Bircan MK. Body mass index, body fat percentage, and the effect of body fat mass on SWL success. Int Urol Nephrol 2007; 39: 727-730. 15. Meeuwsen S, Horgan GW, Elia M. The relationship between
BMI and percent body fat, measured by bioelectrical
imped-ance, in a large adult sample is curvilinear and influenced
by age and sex. Clin Nutr 2010; 29: 560-566.
16. Adams TD, Heath EM, Lamonte MJ, Gress RE, Pendleton R, Strong M, et al. The relationship between body mass index and percent body fat in the severely obese. Diabetes Obes Metab 2007; 9: 498-505.
17. Sun G, French CR, Martin GR, Younghusband B, Green RC, Xie YG, et al. Comparison of multifrequency bioelectrical impedance analysis with dual-energy X-ray absorptiometry for assessment of percentage body fat in a large, healthy population. Am J Clin Nutr 2005; 81: 74-78.
18. Zeng Q, Sun XN, Fan L, Ye P. Correlation of body composi-tion with cardiac funccomposi-tion and arterial compliance. Clin Exp Pharmacol Physiol 2008; 35: 78-82.
19. Wen CP, David Cheng TY, Tsai SP, Chan HT, Hsu HL, Hsu CC, et al. Are Asians at greater mortality risks for being
overweight than Caucasians? Redefining obesity for Asians. Public Health Nutr 2009; 12: 497-506.
20. US Department of Health and Human Services, National Institutes of Health. WIN Weight Control Network. Under-standing Adult Obesity. NIH Publication No. 01-3680. http:// win.niddk.nih.gov/publications/PDFs/adultobesbw1201.pdf. Accessed October 14, 2001.
21. Friedewald WT, Levy RI, Fredrickson DS. Estimation of the concentration of low-density lipoprotein cholesterol in plasma, without use of the preparative ultracentrifuge. Clin Chem 1972; 18: 499-502.
22. Mancia G, De Backer G, Dominiczak A, Cifkova R, Fagard R, Germano G, et al. 2007 Guidelines for the Management of Arterial Hypertension: The Task Force for the Management of Arterial Hypertension of the European Society of Hyper-tension (ESH) and of the European Society of Cardiology (ESC). J Hypertens 2007; 25: 1105-1187.
23. American Diabetes Association. Standards of medical care in diabetes - 2009. Diabetes Care 2009; 32 (Suppl 1):
S13-S61.
24. United Committee for Compilation of Prevention and Treat-ment Guideline for Blood Lipid Abnormality in Chinese Adults. Prevention and treatment guideline for blood lipid abnormality in Chinese adults. Chinese J Cardiol 2007; 35: 390-419.
25. Executive Summary of the Third Report of the National Cholesterol Education Program (NCEP). Expert panel on detection, evaluation, and treatment of high blood choles-terol in adults (adult treatment panel III). JAMA 2001; 285: 2486-2497.
26. Liu T, Wang H, Qiu Q, Tan LL, Chen W, Yu XQ, et al. [Me -diation of abdominal obesity on the association between cigarette smoking and beta-cell function]. Zhonghua Liu Xing Bing Xue Za Zhi 2010; 31: 988-991.
27. Haskell WL, Lee IM, Pate RR, Powell KE, Blair SN, Franklin BA, et al. Physical activity and public health: updated recom-mendation for adults from the American College of Sports Medicine and the American Heart Association. Med Sci Sports Exerc 2007; 39: 1423-1434.
28. Vyssoulis GP, Karpanou EA, Liakos CI, Kyvelou SM, Tzamou VE, Michaelides AP, et al. Cardiovascular risk factor(s) prevalence in Greek hypertensives. Effect of gen-der and age. J Hum Hypertens 2011 [Epub ahead of print]. 29. Wijndaele K, Brage S, Besson H, Khaw KT, Sharp SJ,
Lu-ben R, et al. Television viewing and incident cardiovascular disease: prospective associations and mediation analysis in the EPIC Norfolk Study. PLoS One 2011; 6: e20058. 30. Palaniappan LP, Wong EC, Shin JJ, Fortmann SP,
Lau-derdale DS. Asian Americans have greater prevalence of metabolic syndrome despite lower body mass index. Int J Obes 2011; 35: 393-400.
31. Wang C, Hou XH, Zhang ML, Bao YQ, Zou YH, Zhong WH, et al. Comparison of body mass index with body fat percent-age in the evaluation of obesity in Chinese. Biomed Environ Sci 2010; 23: 173-179.
32. Oreopoulos A, Ezekowitz JA, McAlister FA, Kalantar-Zadeh K, Fonarow GC, Norris CM, et al. Association between direct measures of body composition and prognostic factors in chronic heart failure. Mayo Clin Proc 2010; 85: 609-617. 33. Romero-Corral A, Somers VK, Sierra-Johnson J, Korenfeld
Y, Boarin S, Korinek J, et al. Normal weight obesity: a risk factor for cardiometabolic dysregulation and cardiovascular mortality. Eur Heart J 2010; 31: 737-746.
34. Cho YG, Song HJ, Kim JM, Park KH, Paek YJ, Cho JJ, et al. The estimation of cardiovascular risk factors by body mass index and body fat percentage in Korean male adults.
Metabolism 2009; 58: 765-771.
35. Segal KR, Dunaif A, Gutin B, Albu J, Nyman A, Pi-Sunyer FX. Body composition, not body weight, is related to cardiovas-cular disease risk factors and sex hormone levels in men. J Clin Invest 1987; 80: 1050-1055.
36. Jebb SA, Elia M. Techniques for the measurement of body composition: a practical guide. Int J Obes Relat Metab Dis-ord 1993; 17: 611-621.
37. Dehghan M, Merchant AT. Is bioelectrical impedance accu-rate for use in large epidemiological studies? Nutr J 2008; 7: 26.
38. Minematsu K, Kaneko Y, Nakazato M, Maeda T, Maeda T, Christopher NJ, et al. Percentage body fat assessed by bio-electrical impedance analysis as a new health index for rural
2009; 54: 39-44.
39. Nagai M, Komiya H, Mori Y, Ohta T, Kasahara Y, Ikeda Y. Estimating visceral fat area by multifrequency bioelectrical impedance. Diabetes Care 2010; 33: 1077-1079.