261
O
riginala
rticleCopyright © 2009 by Sociedade Brasileira de Pediatria
abstract
Objective: To verify the impact of obesity on metabolic syndrome components and adipokine levels in prepubertal children.
Methods: This cross-sectional study compared 30 obese, 31 overweight and 33 eutrophic children attending a university hospital-based outpatient pediatric clinic. Parameters assessed included glucose, serum lipids, insulin, homeostasis model assessment-insulin resistance (HOMA-IR), glucose/insulin relation, adiponectin, and leptin. We compared the frequency of acanthosis nigricans and changes in waist, blood pressure, glucose, serum lipids, and insulin. The correlation between body mass index (BMI) z score and adipokines was evaluated.
results: Among obese children, there was a difference in the mean values of HDL cholesterol and adiponectin, whereas among the eutrophic children, there was a difference in the mean values of insulin, HOMA-IR, glucose/insulin relation, and leptin (p < 0.001). A difference was also observed regarding the frequency of acanthosis nigricans and alteration in waist and HDL cholesterol (p < 0.005) in the obese group. The BMI z score showed a positive correlation with leptin (p < 0.001) and a negative correlation with adiponectin (p = 0.001). In multiple linear regression, this correlation was maintained only for leptin; HDL-cholesterol correlated with adiponectin (p = 0.007) and HOMA-IR correlated with both variables (p < 0.05).
conclusion: These indings provide evidence of the inluence of obesity on metabolic syndrome components and on adipokine levels in prepubertal children, indicating that these components may contribute to the beginning of cardiovascular diseases.
J Pediatr (Rio J). 2009;85(3):261-268: Adiponectin, cardiovascular diseases, risk factors, homeostasis, body mass index, insulin, leptin, insulin resistance.
impact of obesity on metabolic syndrome components
and adipokines in prepubertal children
isabel r. Madeira,1 cecilia n. M. carvalho,2 Fernanda M. gazolla,3
liana W. Pinto,4 Marcos a. Borges,5 Maria alice n. Bordallo6
1. Mestre. Professora assistente, Departamento de Pediatria, Faculdade de Ciências Médicas, Universidade do Estado do Rio de Janeiro (UERJ), Rio de Janeiro, RJ, Brazil.
2. Doutora. Professora adjunta, Departamento de Nutrição Aplicada, Instituto de Nutrição (INU), UERJ, Rio de Janeiro, RJ, Brazil.
3. Médica pediatra e endocrinologista, Unidade Docente Assistencial de Endocrinologia e Metabologia, Hospital Universitário Pedro Ernesto (HUPE), UERJ, Rio de Janeiro, RJ, Brazil.
4. Doutora. Professora convidada, Departamento de Tecnologias da Informação e Educação em Saúde, UERJ, Rio de Janeiro, RJ, Brazil. 5. Biólogo, Unidade Docente Assistencial de Endocrinologia e Metabologia, HUPE, UERJ, Rio de Janeiro, RJ, Brazil.
6. Doutora. Professora adjunta, Unidade Docente Assistencial de Endocrinologia e Metabologia, Departamento de Medicina Interna, Faculdade de Ciências Médicas, UERJ, Rio de Janeiro, RJ, Brazil.
This study is part of the doctoral dissertation project of the main author, Isabel R. Madeira, under the guidance of coauthor Maria Alice N. Bordallo.
Institution: Study performed at the Outpatient Clinic for Childhood Obesity Research as a partnership research project involving the Endocrinology and Metabology Teaching Support Unit of the Department of Internal Medicine, the Department of Pediatrics, both at Faculdade de Ciências Médicas, Universidade do Estado do Rio de Janeiro, and the Department of Applied Nutrition at Instituto de Nutrição, Universidade do Estado do Rio de Janeiro, Rio de Janeiro, RJ, Brazil.
Financial support: The dissertation project of which this study is part received research support (APQ1) from Fundação Carlos Chagas Filho de Amparo à Pesquisa do Estado do Rio de Janeiro (FAPERJ), protocol no. 170491/2007.
No conflicts of interest declared concerning the publication of this article.
Suggested citation: Madeira IR, Carvalho CN, Gazolla FM, Pinto LW, Borges MA, Bordallo MA. Impact of obesity on metabolic syndrome components and adipokines in prepubertal children. J Pediatr (Rio J). 2009;85(3):261-268.
introduction
Obesity has become a prevalent health problem in our present-day society. In Brazil, over recent years, a decline in malnutrition has been observed among children and adolescents. In the latter, data from the Brazilian Family Expenditure Survey 2002/2003 of the Brazilian Institute of
Geography and Statistics (Instituto Brasileiro de Geograia
e Estatística, IBGE) showed prevalence of overweight in 16.7%.1
This disorder is associated with a set of diseases, such as hypertension, dyslipidemias and type 2 diabetes mellitus, in the so-called metabolic syndrome, in which insulin resistance and hyperinsulinemia explain the relationship between obesity and other abnormalities.2
Insulin resistance is suspected in view of clinical evidence.
Conirmation is obtained through insulin resistance indices,
which have been widely studied in children.3 The most
applied indices are those based on fasting glucose and insulin concentrations, such as the homeostasis model assessment of insulin resistance (HOMA-IR) and the relation of glucose and insulin, already validated for the age group.4
In the pediatric age group, obesity seems to be an important trigger of insulin resistance,3 ranking obese
children as a risk group. However, a consensus on the
deinition of metabolic syndrome in children is currently
lacking. A recent review of this subject found 40 different
deinitions adapted from those proposed for adults.5
The components of this syndrome are risk factors for cardiovascular disease. Some epidemiological longitudinal studies, such as the Bogalusa Heart Study, have investigated cardiovascular risk factors. That study showed presence of atherosclerosis in the aorta and coronary arteries of children, particularly of those who already presented the previously mentioned risk factors, suggesting that the disease starts in childhood.6 Thus, these risk factors would have been in
action since the pediatric age group.3
The pathophysiology of obesity involves imbalance of energy intake and expenditure. Several neuroendocrine factors have been involved in this energy imbalance, such as adipokines, which are proteins produced by the visceral adipose tissue. Examples of these proteins include leptin and adiponectin, which regulate the physiological processes connected to the carbohydrate and fat metabolism.7
Leptin would be related to the regulation of body weight, since weight gain causes leptin levels to rise, and the hypothalamus might decode this rise as a sign to reduce food intake and enhance energy expenditure and sympathetic tonus. In contrast, weight loss leads to lower leptin levels, and, thus, the hypothalamus would respond by increasing food intake, reducing energy expenditure and increasing corticotropin-releasing hormones, growth hormone and gonadotropins, in addition to increasing parasympathetic tonus.8 Elevated leptin levels are observed in obese people.
The defect might be resistance to or impaired transport of this substance to the central nervous system.9
Adiponectin would be a cytokine that enhances insulin
sensitivity, along with anti-inlammatory and antiatherogenic
properties.10 Its levels correlate negatively with obesity,
hyperinsulinism, insulin resistance, levels of triglycerides and LDL cholesterol, and positively with HDL cholesterol.10,11
Studies with obese young children have demonstrated changes in adiponectin levels in the absence of lipid changes, leading us to believe that cytokine changes are likely to precede lipid changes in obesity, which would place cytokines on top of the metabolic syndrome process.12
Therefore, the objective of this study is to verify the impact of obesity on metabolic syndrome components and both leptin and adiponectin levels in prepubertal children.
Methods
This cross-sectional, observational study was conducted in an outpatient clinic for childhood obesity research of a public university hospital with children attending the outpatient pediatric clinic of this same hospital. The sample included obese and overweight children, aged between 2 and 11 years, in the prepubertal stage (according to Tanner stage of pubertal development).13 Obesity and overweight were deined according to the patterns from
the Centers for Disease Control and Prevention (CDC),
for the year 2000, in the United States, which deine
obesity and overweight according to the body mass index (BMI). This index is obtained as a result of the weight (kg) divided by the square of the height (m). Obesity
was then deined as BMI ≥ 95th percentile; overweight as BMI ≥ 85th percentile, but < 95th percentile.14 The
children were considered healthy with respect to other aspects, were not included in any weight reduction program
and were selected in a irst-come irst-serve order of
admission to the outpatient clinic for childhood obesity research. The group of prepubertal eutrophic children was
composed of healthy children, BMI ≥ 10th percentile and
< 85th percentile for age and sex, attending the same outpatient clinic. The total sample size, 94 children, was
considered suficient to achieve statistical power of 80%, with a level of signiicance set at 5%, for an error of
5%, based on the total population of children attended in the outpatient pediatric clinic.15
Subjects wearing light clothing and no shoes were weighed on a Filizola®scale. Height was measured without
shoes using a Tonelli® Harpenden-type wall-mounted
stadiometer. The waist circumference measurement was taken immediately above the upper lateral border of the iliac crest, at the end of a normal expiration, according to the recommendations by the U.S. Third National Health and Nutrition Examination Survey,17 using a Mabbis® Gulik-type
anthropometric tape measure (mm).
Blood pressure was measured at the right arm, the children in the sitting position and at rest, with a Tycos®
sphygmomanometer using cuffs with adequate size. The auscultatory method was applied, with systolic and diastolic blood pressure corresponding to Korotkoff phases I and
V. To deine increased blood pressure, we adopted the
criterion recommended by the I Directive on the Prevention of Atherosclerosis in Childhood and Adolescence of the Brazilian Society of Cardiology.18
The cutoff points adopted for fasting glycemia, cholesterol, HDL cholesterol, LDL cholesterol, triglycerides, and insulin were those recommended by the I Directive on the Prevention of Atherosclerosis in Childhood and Adolescence of the Brazilian Society of Cardiology: increased glycemia, values from 100 to 125 mg/dL; altered cholesterol,
values ≥ 150 mg/dL, values between 150 and 169 are considered borderline and ≥ 170, increased, altered LDL cholesterol: values ≥ 100 mg/dL, values between 100 and 129 are considered borderline and ≥ 130, increased; low
HDL cholesterol, values < 45 mg/dL; altered triglycerides,
values ≥ 100 mg/dL, values between 100 and 129 are considered borderline and ≥ 130, increased; increased insulin, values ≥ 15 µIU/mL.18
HOMA-IR index was calculated from the formula: fasting
glucose (mmol/L) x fasting insulin (µIU/mL)/22.5.19 The
glucose/insulin relation was calculated as fasting glucose
(mg/dL) divided by fasting insulin (µIU/mL).4
Blood for laboratory analysis was collected a few days after the clinical evaluation, after 12 h of fasting. The following assays were performed: measurements of serum glucose, total and HDL cholesterol, triglycerides, leptin and adiponectin.
For the irst four assays, we performed routine automated
methods in the clinical laboratory at the study hospital. LDL cholesterol was calculated using the Friedwald formula: LDL cholesterol = total cholesterol – (HDL cholesterol + triglycerides/5).20
Biochemical analyses were performed on a Konelab autoanalyzer, BT 3000 Winer model kit, using: for glucose, GOD-PAP enzymatic method (oxidase); for cholesterol, CHOP-POD enzymatic method (esterase/oxidase); for triglycerides, GPO-PAP enzymatic method (oxidase); and for HDL cholesterol, enzymatic calorimetric method with no precipitation (Winterlab, Rosário, Santa Fé, Argentina).
Insulin was measured in the endocrine laboratory at the study hospital on a GAMA-C12, with a model kit using the Coat-A-Count method, a solid-phase 125 I-labeled radioimmunoassay (DPC, Los Angeles, CA, USA).
L e p t i n a n d a d i p o n e c t i n w e r e m e a s u r e d b y radioimmunoassay, in the same laboratory, on a GAMA-C12, with model kits using the PEG double antibody method (Linco Research, St. Charles, MO, USA), in a saline solution properly stored for this purpose. The leptin kit used 125 I-labeled human leptin and human leptin antiserum, and the adiponectin kit used 125 I-labeled rabbit adiponectin and a rabbit anti-adiponectin polyclonal antiserum.
The data collected were entered on Excel spreadsheets version 7 (MapInfo Corporation, Troy, NY, USA). The Epi-Info software version 3.4.1 (CDC, Atlanta, GA, USA) was used to calculate BMI z score. Linear regression statistical analyses were performed using SPSS software version 15.0.0 (SPSS Inc., Chicago, IL, USA). The additional statistical analyses were performed using the Statistica software version 7.1 (Stat Soft Inc, Teusa, OK, USA).
For each group, mean and standard deviation of the following continuous variables was calculated: age, BMI z score, glucose, cholesterol, triglycerides, HDL cholesterol, LDL cholesterol, insulin, glucose/insulin relation, and HOMA-IR.
As for the categorical variables, frequency of sex, skin color and acanthosis nigricans was calculated for each group. Increased frequency of blood pressure, waist circumference, glucose, and insulin was calculated for each group, as well as altered frequency of: cholesterol, triglycerides, and HDL and LDL cholesterol.
The means of the continuous variables were compared between the obese, overweight and control groups, using ANOVA followed by Fisher’s exact test to identify different groups, except for leptin, for which the Kruskal-Wallis test was used to compare means, followed by the Mann-Whitney test to identify different groups.
Pearson chi-square was used to compare, within groups, frequency of acanthosis nigricans and of increased and
altered classiications of the categorical variables.
Simple linear regression was used to analyze the correlation of BMI z score with leptin and adiponectin. Multiple linear regression was performed taking both leptin and adiponectin as the dependent variable, and BMI z score, HDL-cholesterol and HOMA-IR, waist, age and sex as the independent variables.
The level of signiicance was set at p < 0.05.
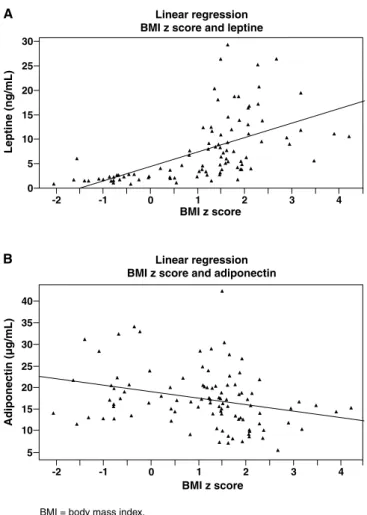
Figure 1 - Linear regression: A) BMI z score and leptine; B) BMI z score and adiponectin
BMI = body mass index.
results
The study group was composed of 94 children: 30 obese, 31 overweight and 33 eutrophic. The obese group was composed of 22 (73.33%) boys and 8 (26.67%) girls, with a median age of 6.3±2.6 years (minimum age, 2 years; maximum age, 11 years), 11 (36.67%) of these were white and 19 (63.33%) were non-white. The overweight group was composed of 14 (45.16%) boys and 17 (54.84%) girls, with a median age of 6.2±2.2 years (minimum age, 2 years; maximum age, 10 years), 17 (54.84%) of these were white and 14 (45.16%) were non-white, with a median age of 6.4±2.7 years (minimum age, 2 years; maximum age, 11 years). In the eutrophic group, 20 (60.61%) were boys and 13 (39.39%) were girls, 13 (39.39%) of these were white and 20 (60.61%) were non-white.
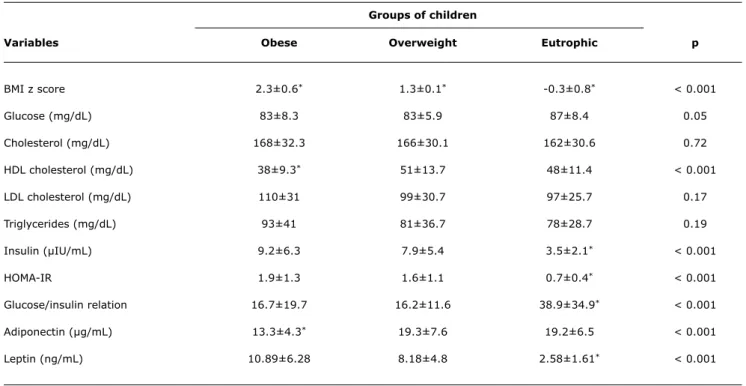
Table 1 shows comparisons of mean values between clinical and metabolic continuous variables in the obese, overweight and eutrophic groups.
Table 2 shows comparisons of the frequency of alteration in each clinical and metabolic categorical variable in the
obese, overweight and eutrophic groups.
BMI z score of the entire study group correlated positively to leptin (p < 0.001, r2 = 0.535) and negatively to adiponectin
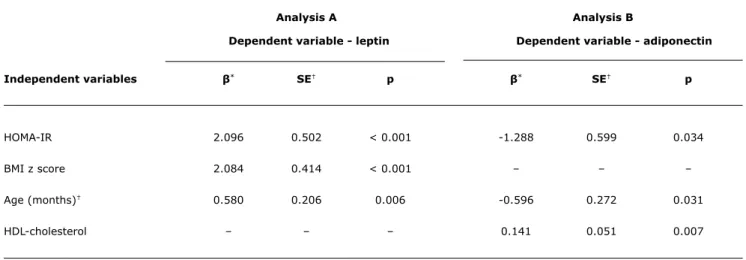
(p = 0.001, r2 = 0.123), as shown in Figure 1. In multiple
linear regression analysis, when adjusted for HDL cholesterol,
HOMA-IR, waist, age and sex, correlation was signiicant to
leptin (p < 0.001). The same pattern was not observed in
relation to adiponectin, when the signiicant variables were
HOMA-IR, age and HDL-cholesterol (Table 3).
Discussion
We studied a group of young children, in which obesity is not so severe, thus making it an ideal group to study the initial phase of the metabolic syndrome, despite of the
groups of children (%)
Variables Obese Overweight eutrophic p
Waist* 66.67 12.90 - < 0.001
Blood pressure* 6.67 3.23 - 0.32
Acanthosis nigricans† 30 16.13 - 0.004
Glycemia* 3.33 - 9.09 0.403
Total cholesterol‡ 73.33 70.97 60.61 0.510
HDL cholesterol§ 80 32.26 42.42 < 0.001
LDL cholesterol‡ 60 45.16 51.51 0.834
Triglycerides‡ 40 25.81 21.21 0.234
Insulin* 13.33 12.90 - 0.094
table 2 - Comparisons of frequency of alteration in each clinical and metabolic categorical variable between the groups of obese, overweight and eutrophic children
* Increased.
† Present.
‡ Altered = borderline + increased. § Decreased.
groups of children
Variables Obese Overweight eutrophic p
BMI z score 2.3±0.6* 1.3±0.1* -0.3±0.8* < 0.001
Glucose (mg/dL) 83±8.3 83±5.9 87±8.4 0.05
Cholesterol (mg/dL) 168±32.3 166±30.1 162±30.6 0.72
HDL cholesterol (mg/dL) 38±9.3* 51±13.7 48±11.4 < 0.001
LDL cholesterol (mg/dL) 110±31 99±30.7 97±25.7 0.17
Triglycerides (mg/dL) 93±41 81±36.7 78±28.7 0.19
Insulin (µIU/mL) 9.2±6.3 7.9±5.4 3.5±2.1* < 0.001
HOMA-IR 1.9±1.3 1.6±1.1 0.7±0.4* < 0.001
Glucose/insulin relation 16.7±19.7 16.2±11.6 38.9±34.9* < 0.001
Adiponectin (µg/mL) 13.3±4.3* 19.3±7.6 19.2±6.5 < 0.001
Leptin (ng/mL) 10.89±6.28 8.18±4.8 2.58±1.61* < 0.001
table 1 - Comparisons of mean values of clinical and metabolic continuous variables between the groups of obese, overweight and eutro-phic children
analysis a analysis B
Dependent variable - leptin Dependent variable - adiponectin
Independent variables β* Se† p β* Se† p
HOMA-IR 2.096 0.502 < 0.001 -1.288 0.599 0.034
BMI z score 2.084 0.414 < 0.001 – – –
Age (months)† 0.580 0.206 0.006 -0.596 0.272 0.031
HDL-cholesterol – – – 0.141 0.051 0.007
table 3 - Multiple linear regression analysis in prepubertal obese, overweight and eutrophic children, taking leptin (analysis A) and adi-ponectin (analysis B) as the dependent variable
BMI = body mass index; HOMA-IR = homeostasis model assessment-insulin resistance; SE = Standart error.
* Coefficient of regression (dependent variable variation corresponding to one unit of variation of the independent variable in question, whereas all other independent variables are constant).
† Only the variables showing a significant p value in multiple linear regression analysis were included in the final model (leptin: model coefficient of correlation
r2 = 0.519; adiponectin: model coefficient of correlation r2 = 0.181).
the inding of risk factors for cardiovascular disease, as
observed in this group, is a worrying issue.
By analyzing increase in waist size, high prevalence was observed in the obese group and low prevalence in the overweight group, whereas the eutrophic group did not show this alteration. This result corroborates the importance of this measurement as an indicator of obesity in children, as previously mentioned in the literature.17
The high prevalence of acanthosis nigricans in the obese group, a marker of insulin resistance even in children,21
also requires attention. Few children under study presented elevated blood pressure and hyperglycemia, which may be explained by their young age and because they were not considered severely obese.
There was no statistical difference between the mean values of cholesterol, LDL cholesterol and triglycerides in the three groups studied. However, the mean values of cholesterol in the three groups were above the cutoff point recommended as the normal range for children in Brazil,18 though below the U.S. cutoff point.22 Prevalence
of altered cholesterol, LDL cholesterol and triglycerides was also important, with no statistical difference between the groups studied. When comparing the mean values of cholesterol, HDL cholesterol, LDL cholesterol, and triglycerides from the U.S. reference (153, 55, 90 and 48 mg/dL, respectively) to those from the eutrophic group, worse values were observed in our sample. These data point out the inadequate current eating habits observed even in children who are not considered obese3 and that
dyslipidemia may precede obesity.23 Dyslipidemia would be
a marker of altered metabolism, which would later result in excess of adiposity.24
Regarding HDL cholesterol, there was statistically
signiicant difference between the mean values of the obese
and the overweight groups, as well as between the mean values of the obese and the eutrophic groups. The same was observed regarding adiponectin, which showed a lower mean in the obese group. Prevalence of altered HDL cholesterol was much higher in the obese group when compared with
both the overweight and eutrophic groups. These indings
add to obesity as a risk factor for atherogenesis, since it is common knowledge that HDL cholesterol fraction is antiatherogenic,2 and recent studies have demonstrated
this same role in relation to adiponectin,12 although further
studies on adiponectin in prepubertal children are currently lacking.
In the analysis of insulinemia, means were higher, with
statistical signiicance, in the obese and overweight groups
when compared with those of the eutrophic group, but not when comparing the obese group with the overweight group. The same was observed regarding HOMA-IR and leptin, which showed lower means in the eutrophic group. For the glucose/insulin relation, lower means were observed in the obese and overweight groups, also with statistical
signiicance only between the eutrophic group and the other
two groups. None of the children in the eutrophic group had hyperinsulinemia, in contrast to what was observed in the
references
1. Brasil. Ministério do Planejamento. Orçamento e Gestão. Instituto Brasileiro de Geograia e Estatística. [página na internet]. http:// ibge.gov.br. Access: 4/9/2008.
2. Reaven GM. Role of insulin resistance in human disease. Diabetes. 1988;37:1595-607.
3. Ten S, MacLaren N. Insulin resistance syndrome in children. J Clin Endocrinol Metab. 2004;89:2526-39.
4. Uwaifo GI, Fallon EM, Chin J, Elberg J, Parikh SJ, Yanovski JA.
Indices of insulin action, disposal, and secretion derived from fasting samples and clamps in normal glucose-tolerant black and white children. Diabetes Care. 2002;25:2081-7.
5. Ford ES, Li C. Deining the metabolic syndrome in children and
adolescents: will the real deinition please stand up? J Pediatr.
2008;152:160-4.
6. Berenson GS, Srinivasan SR, Bao W, Newman WP 3rd, Tracy RE, Wattigney WA. Association between multiple cardiovascular risk factors and atherosclerosis in children and young adults. The Bogalusa Heart Study. N Engl J Med. 1998;338: 1650-6. 7. Fonseca-Alaniz MH, Takada J, Alonso-Vale MI, Lima FB. Adipose
tissue as an endocrine organ: from theory to practice. J Pediatr (Rio J). 2007;83:S192-203.
8. Negrão AB, Licino J. Leptina: o diálogo entre adipócitos e neurônios. Arq Bras Endocrinol Metab. 2000;44:205-14.
9. Caro JF, Kolaczynski JW, Nyce MR, Ohannesian JP, Opentanova I, Goldman WH, et al. Decreased cerebrospinal-luid/serum leptin ratio in obesity: a possible mechanism for leptin resistance. Lancet. 1996;348:159-61
10. Yamamoto Y, Hirose H, Saito H, Nishikai K, Saruta T. Adiponectin, an adipocyte-derived protein, predicts future insulin resistance: two-year follow-up study in Japanese population. J Clin Endocrinol Metab. 2004;89:87-90.
11. Stefan N, Bunt JC, Salbe AD, Funahashi T, Matsuzawa Y, Tataranni PA. Plasma adiponectin concentrations in children: relationships with obesity and insulinemia. J Clin Endocrinol Metab. 2002;87:4652-6.
12. Cianlone K, Lu H, Smith J, Yu J, Wang H. Adiponectin, acylation stimulating protein and complement C3 are altered in obesity in very young children. Clin Endocrinol (Oxf). 2005;62:567-72. 13. Marshall WA, Tanner JM. Variations in the pattern of pubertal
changes in girls. Arch Dis Child. 1969;44:291-303.
14. Rosner B, Prineas R, Loggie J, Daniels SR. Percentiles for body mass index in U.S. children 5 to 17 years of age. J Pediatr. 1998;132:211-22.
could also be explained by the fact that the children were not considered severely obese; however, it also reinforces the hypothesis that insulin resistance starts in overweight children, contributing to the beginning of multiple risk factors for cardiovascular diseases.3,25 The inding of a positive
correlation between BMI z score and leptin in both simple and multiple linear regression, in accordance with data from the literature,26 corroborates the previous statements.
However, the same was not observed in the analysis of adiponectin. In simple linear regression, adiponectin correlated negatively to BMI z score, in accordance with other studies,12 but in multiple linear regression, this correlation lost statistical signiicance, possibly due to the
presence of statistical confounding factors between these variables. This issue, however, is not easily resolved because the relationship between traditional risks for cardiovascular
disease and adiponectin is yet to be clariied. Nevertheless,
some of these confounding sources are already known, such as age and sex, since it is common knowledge that younger children have higher adiponectin levels,12 and that
girls have higher levels than boys.26
The positive correlation between adiponectin and HDL cholesterol (p = 0.034) in multiple linear regression, regardless of BMI z score, HOMA-IR, leptin, waist, age or sex, is in accordance with other studies, which also showed that hypoadiponectinemia is more strongly related to dyslipidemia than to the degree of obesity.27
Thus, adiponectin would play its antiatherogenic role by interacting with the lipid metabolism.
Both leptin and adiponectin correlated to HOMA-IR in the regression analyses performed, suggesting that adipokines play a role in the pathophysiology of insulin resistance, as indicated in the literature.7,8
Together with data from the literature, our results conirm
the trend of variations in adipokine levels according to age12,29 by showing that, in the multivariate linear regression
analyses performed, age correlated positively to leptin and negatively to adiponectin.
The proile found shows that obesity has a remarkable
impact on metabolic syndrome components and on adipokine levels in prepubertal children, indicating some repercussion even on the overweight group.
A distinguishing characteristic of this study is the young age of our sample, which included only prepubertal children, different from most of the studies on this subject, especially from those which analyze the role of adipokines. Particularly, it contributes to elucidate the role of adipokines as new candidates for cardiovascular risk factor, although prospective studies should be conducted to further evaluate this subject.
Since a consensus on the deinition of metabolic
syndrome in children is currently lacking, studies with individuals at this age group can contribute substantially to
this purpose, in order to better identify children at higher
cardiovascular risk and, from there, to better deine the
components of the syndrome and their cutoff points. These children should be candidates for higher surveillance and intervention, focusing on change of lifestyle, since it has been already demonstrated, through longitudinal studies, that children with characteristics of metabolic syndrome become adults with this syndrome.30
The reduced number of children in our sample implied methodological limitations to the study, as well as caution in the transposition of the conclusions to the general population. Adipokine measurements in samples larger than the one used in the present study may shed some further light on the subject.
acknowledgements
Correspondence: Isabel Rey Madeira Rua João da Mata, 128
CEP 20511-260 - Rio de Janeiro, RJ - Brazil Tel.: +55 (21) 2238.4906, +55 (21) 9994.8572, +55 (21) 2587.6447
E-mail: [email protected] 15. Fleiss JL, Levin BA, Levin B, Paik MC. Statistical methods for rates
and proportions. 3rd ed. Oxford: Wiley-InterScience; 2003. 16. Burke JP, Hale DE, Hazuda HP, Stern MP. A quantitative scale of
acanthosis nigricans. Diabetes Care. 1999;22:1655-9.
17. Fernández JR, Redden DT, Pietrobelli A, Allison DB. Waist circumference percentiles in nationally representative samples of African-American, European-American, and Mexican-American children and adolescents. J Pediatr. 2004;145: 439-44. 18. Sociedade Brasileira de Cardiologia. I Diretriz de Prevenção da
Aterosclerose na Infância e na Adolescência. Arq Bras Cardiol. 2005;85 Supl 6:1-36.
19. Matthews DR, Hosker JP, Rudenski AS, Naylor BA, Treacher DF, Turner RC. Homeostasis model assessment: insulin resistance and ß-cell function from fasting plasma glucose and insulin concentrations in man. Diabetologia. 1985;28:412-9.
20. Friedewald WT, Levy RI, Fredrickson DS. Estimation of the concentration of low-density lipoprotein cholesterol in plasma without use of preparative ultracentrifugate. Clin Chem. 1972;18:499-502.
21. Yamazaki H, Ito S, Yoshida H. Acanthosis nigricans is a reliable cutaneous marker of insulin resistance in obese Japanese children.
Pediatr Int. 2003;45:701-5.
22. Daniels SR, Greer FR; Committee on Nutrition. Lipid screening and cardiovascular health in children. Pediatrics. 2008;122:198-208.
23. Friedland O, Nemet D, Gorodnitsky N, Wolach B, Eliakin A. Obesity
and lipid proiles in children and adolescents. J Pediatr Endocrinol
Metab. 2002;15:1011-6.
24. Tershakovec AM, Jawad AF, Stouffer NO, Elkasabany A, Srinivasan SR, Berenson GS. Persistent hypercholesterolemia is associated with the development of obesity among girls: the Bogalusa Heart Study. Am J Clin Nutr. 2002;76:730-5.
25. Ferreira AP, Oliveira CE, França NM. Metabolic syndrome and risk factors for cardiovascular disease in obese children: the relationship with insulin resistance (HOMA-IR). J Pediatr (Rio J). 2007;83:21-6.
26. Fleisch AF, Agarwal N, Roberts MD, Han JC, Theim KR, Vexler A, et al. Inluence of serum leptin on weight and body fat growth in children at high risk for adult obesity. J Clin Endocrinol Metab. 2007;92:948-54.
27. Tsou P, Jiang Y, Chang C, Wei J, Sung F, Lin C, et al. Sex-related differences between adiponectin and insulin resistance in schoolchildren. Diabetes Care. 2004;27:308-13.
28. Pilz S, Horejsi R, Möller R, Almer G, Scharnagl H, Stojakovic T, et al. Early atherosclerosis in obese juveniles is associated with low serum levels of adiponectin. J Clin Endocrinol Metab. 2005;90:4792-6.
29. Clayton PE, Gill MS, Hall CM, Tillman V, Whatmore AJ, Prince DA.
Serum leptin through childhood and adolescence. Clin Endocrinol (Oxf). 1997;46:727-33.