www.jped.com.br
ORIGINAL ARTICLE
Trends of underweight, overweight, and obesity in Brazilian
children and adolescents
夽
Larissa S. Flores
a,∗, Anelise R. Gaya
b, Ricardo D.S. Petersen
c, Adroaldo Gaya
daMaster’s Degree in Human Movement Sciences, Universidade Federal do Rio Grande do Sul (UFRGS), Porto Alegre, RS, Brazil bPhD in Physical Activity and Health, Universidade do Porto, Porto, Portugal
cPhD at University of Maryland and Associate Professor 3, UFRGS, Porto Alegre, RS, Brazil
dPhD in Sports Sciences - Pedagogical Specialty, Universidade do Porto, Portugal, and Full Professor, UFRGS, Porto Alegre, RS,
Brazil
Received 17 December 2012; accepted 27 February 2013 Available online 10 July 2013
KEYWORDS
BMI;
Malnutrition; Overweight; Obesity; Children and adolescents
Abstract
Objective: To describe and analyze the trends of occurrence of underweight, overweight, and obesity in schoolchildren.
Methods: This was a longitudinal study of trends conducted in a voluntary sample of Brazilian children and adolescents. The sample was grouped by year of collection (period I: 2005 and 2006; period II: 2007 and 2008, and period III: 2009-2011), age category (children: 7 to 10 years, and adolescents: 11 to 14 years), and stratified by gender. The body mass index was used to classify the nutritional profile. Trend analysis was verified using multinomial logistic regression (p < 0.05).
Results: Mean occurrences were 2.11% for underweight, 22.27% for overweight, and 6.8% for obesity. There was a decrease of underweight in male adolescents from period I to II, as well as an increase in female children from period II to III. Regarding overweight, there was an increase followed by a decrease in male children. Regarding obesity, there was an increase from period I to II in all age groups and for both genders.
Conclusion: The prevalence of underweight was less than 5% in all categories of age and gen-der. However, the categories of overweight and obesity showed higher values, and together comprised almost 30% of the young Brazilian population; moreover, a trend toward increase in prevalence of obesity was observed up to the year 2008, followed by the maintenance of these high prevalence rates.
© 2013 Sociedade Brasileira de Pediatria. Published by Elsevier Editora Ltda. All rights reserved.
夽 Please cite this article as: Flores LS, Gaya AR, Petersen RD, Gaya AC. Trends of underweight, overweight, and obesity in Brazilian children and adolescents. J Pediatr (Rio J). 2013;89:456---61.
∗Corresponding author.
E-mail:[email protected] (L.S. Flores).
PALAVRAS-CHAVE
IMC; Desnutric¸ão; Sobrepeso; Obesidade; Crianc¸as e adolescentes
Tendência do baixo peso, sobrepeso e obesidade de crianc¸as e adolescentes brasileiros
Resumo
Objetivo: Descrever e analisar a tendência da ocorrência do baixo peso, sobrepeso e obesidade de escolares.
Métodos: Estudo longitudinal de tendência realizado em uma amostra voluntária de crianc¸as e adolescentes brasileiros. A amostra foi agrupada em ano de coleta (Período I: 2005 e 2006; Período II: 2007 e 2008; e Período III: 2009 a 2011), categoria de idade (crianc¸as: sete a 10 anos, e adolescentes: 11 a 14 anos), e estratificada por sexo. O índice de massa corporal foi utilizado para classificar o perfil nutricional. A análise da tendência foi verificada através da Regressão Logística Multinomial (p < 0,05).
Resultados: As médias de ocorrências foram de 2,11% no baixo peso, 22,27% no sobrepeso e 6,8% na obesidade. Identificou-se chance do baixo peso diminuir do período I para o II nos adolescentes do sexo masculino, e de aumentar nas crianc¸as do sexo feminino do período II para o III. No sobrepeso, encontramos chance de aumento seguida de diminuic¸ão nas crianc¸as do sexo masculino. Na obesidade, em todas as categorias de idade e em ambos os sexos, houve chance de aumento do período I para o II.
Conclusão: A prevalência do baixo peso apresenta valores menores que 5% em todas as cate-gorias de idade e sexo. No entanto, na categoria do sobrepeso e da obesidade, encontramos ocorrências mais elevadas, atingindo, juntas, quase 30% da populac¸ão infanto-juvenil brasileira; além disso, evidenciamos uma chance de aumento na prevalência da obesidade até o ano de 2008 e, após, uma manutenc¸ão destas altas prevalências.
© 2013 Sociedade Brasileira de Pediatria. Publicado por Elsevier Editora Ltda. Todos os direitos reservados.
Introduction
The study of the nutritional profile of children and young individuals has been justified by its usefulness in the con-text of public health, human development, and also due to its contribution to different areas of science.1 Studies
that analyze representative population samples allow for the mapping and assessment of the magnitude of nutritional disorders and, additionally, when evaluated over systematic periods, the identification of trends of nutritional disorders. The Brazilian population is undergoing a nutritional tran-sition, characterized by a decrease in malnutrition and increase in childhood overweight and obesity.2---5
Malnutri-tion, considered a severe problem in the last century, has shown a decrease of over 60% from 1996 to 2007,4differently
from overweight and obesity, which have increased at an alarming rate among young individuals in recent decades.6,7
Studies have shown an increased risk of children and adoles-cents with overweight and obesity to become obese adults.8
Obesity is also a risk factor for the development of other diseases, such as metabolic syndrome9 and cardiovascular
disease,10 which makes it extremely important to develop
strategies to fight this nutritional disorder. Oliveira et al.11
suggested that interventions should be performed in chil-dren younger than ten years or in adolescence, rather then in adulthood, as it would further reduce the severity of dis-eases associated with obesity.
The understanding of the nutritional profile throughout time seems to be the main basis for the development of effective public health actions. In population studies, mon-itoring the body mass index (BMI) has been established as an important diagnostic method for nutritional profile
assessment,12whose use is justified by its simplicity. Its
effi-ciency and importance have been recognized by the main global health organizations, such as the World Health Orga-nization (WHO) and the Centers for Disease Control and Prevention (CDC).13,14
Thus, this study aimed to describe and analyze the trend of occurrence of underweight, overweight, and obesity in Brazilian children and adolescents during the period of 2005-2011.
Methods
Population and Sample
The data of the present study were obtained from the Brazil Sports Project database (Projeto Esporte Brasil - PROESP-Br),15 a permanent recording of indicators of growth, and
body and motor development, as well as of the nutri-tional status of Brazilian children and adolescents aged 6 to 17 years. Assessments are carried out by schoolteach-ers who voluntarily contact the project through the website (www.proesp.ufrgs.br).16There, teachers can seek
informa-tion on the tests applied by the project, interpretainforma-tion of results, and procedures used to send the collected data, which is performed at the teacher’s discretion.
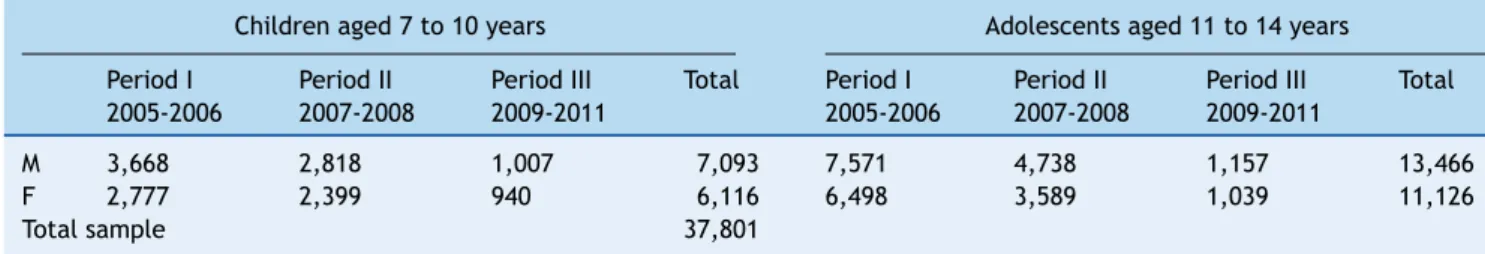
Table 1 Sample characteristics stratified by years of data collection.
Children aged 7 to 10 years Adolescents aged 11 to 14 years
Period I 2005-2006
Period II 2007-2008
Period III 2009-2011
Total Period I 2005-2006
Period II 2007-2008
Period III 2009-2011
Total
M 3,668 2,818 1,007 7,093 7,571 4,738 1,157 13,466 F 2,777 2,399 940 6,116 6,498 3,589 1,039 11,126
Total sample 37,801
F, females; M, males.
Northeast). The voluntary sample was categorized into age groups (children - 7 to 10 years - and adolescents - 11 to 14 years), divided into three data collection periods (period I ---data collected in 2005 and 2006, period II - ---data collected in 2007 and 2008, and period III - data collected in 2009, 2010 and 2011), and stratified by gender, as shown in Table 1.
Nutritional Profile
Body mass and height were assessed by teachers at schools, according to the instructions described in the PROESP-Br manual.15 Height was measured in centimeters (cm) using
a stadiometer, a measuring tape, or a measuring tape fixed to the wall. The subjects were positioned along the wall, barefoot, with heels touching the wall, and the value was recorded in centimeters to one decimal place. Body mass was measured in kilograms (kg) using a portable scale with a resolution of up to 500 grams. The students were wear-ing light clothes and were barefoot. The value was recorded in kg to one decimal place, and the BMI (weight/(height)2)
was subsequently calculated. The subject was classified as underweight, normal weight, overweight, or obese, accord-ing to the categories proposed by Conde and Monteiro.17
All ethical guidelines were followed. The PROESP-Br was approved by the Research Ethics Committee (CEP-PROPESQ) under protocol No. 2008010.
Statistical analysis
Descriptive statistics (mean±standard deviation) were used to characterize the sample in different time periods. The association between the categories of the nutritional pro-file and the time periods was analyzed using Pearson’s chi-squared test. The identification of the trend of occur-rence of underweight, overweight, and obesity among the time periods (2005-2006, 2007-2008, 2009-2011) was per-formed using multinomial logistic regression, with BMI as the dependent variable; the different time periods were included in the model as the predictor variable. The sig-nificance level was set at␣= 5% for all procedures, and the
Statistical Package for Social Sciences (SPSS), release 18.0 for Windows, was used in all statistical analyses.
Results
The anthropometric characteristics of the sample, such as mean and minimum and maximum values, are shown in Table 2. The number of subjects included in the analysis
was 37,801, of which 20,559 were males and 17,242 were females. There was an interdependence association between time periods and nutritional profile in all age groups and in both genders (male children:2(6) = 29.08, p < 0.001;
male adolescents: 2 (6) = 27.671, p < 0.001; female
chil-dren:2(6) = 21.216, p = 0.002, and females adolescent:2
(6) = 22.853, p = 0.001).
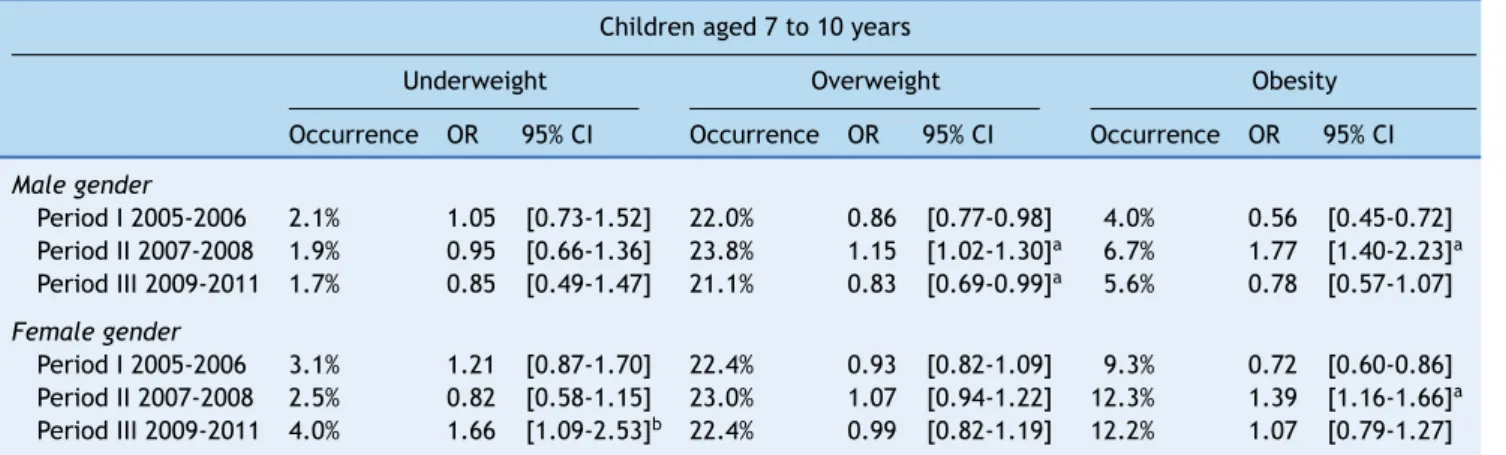
Tables 3 and 4 show the trends of underweight, over-weight, and obesity for each age category and study period, stratified by gender. In the analysis of underweight, a sig-nificant increase in occurrence, from 2.5% to 4.0%, was observed in female children from period II to period III (Table 3). A significant decrease in underweight, from 1.5% to 1.0%, was observed in male adolescents from period I to period II (Table 4).
Regarding overweight, a significant increase in occur-rence, from 22.0% to 23.8% from period I to II was observed in male children, followed by a significant decrease, from 23.8% to 21.1% from period II to III (Table 3).
Regarding obesity, a significant increase from period I to II in all age groups and in both genders was observed, from 4.0% to 6.7% in male children and from 9.3% to 12.3% in female children (Table 3); among adolescents, the increase was from 3.6% to 5.0% for males and from 4.8% to 6.9% in females (Table 4).
Discussion
The longitudinal analysis of underweight, overweight, and obesity allowed for the description of the nutritional profile trend throughout a six-year period in a sample of Brazilian schoolchildren participating in PROESP-Br.
The prevalence of underweight was low, considered acceptable by the WHO,14 with a mean of 2.5% for
chil-dren (7 to 10 years) and 1.65% for adolescents (11 to 14 years). These findings are consistent with the studies by Marinho18 and by Anjos et al.19 A significant decrease in
occurrence was observed from period I to II in male ado-lescents, which supports the latest survey conducted in the country, the Household Budget Survey (HBS),7 indicating
that in this age category, underweight has declined, ceas-ing to be the main nutritional problem. In female children, an increase in occurrence was observed from period II to III, although the rate remained below 5%, which is consid-ered acceptable by the WHO.14 The study by Frota et al.20
Table 2 Sample anthropometric characteristics.
Children aged 7 to 10 years Adolescents aged 11 to 14 years
Gender Mean±SD Min. Max. Mean±SD Min. Max.
Height (cm)
I 2005-2006 M 136.8±8.9 111.0 175.0 156.1±11.2 119.0 194.0 F 136.8±9.8 105.2 169.4 155.5±8.5 120.0 187.0 II 2007-2008 M 135.4±8.9 110.0 170.0 156.1±11.2 120.0 194.4 F 135.6±9.7 107.0 166.0 155.4±8.2 120.5 189.0 III 2009-2011 M 135.8±8.6 109.0 172.0 156.5±11.6 124.0 187.0 F 135.2±9.7 112.0 167.0 156.5±8.3 128.0 188.0
Body mass (kg)
I 2005-2006 M 33.0±8.5 17.0 84.0 47.3±12.4 17.1 111.3 F 32.5±8.5 16.0 71.3 47.2±10.5 20.0 111.0 II 2007-2008 M 32.9±9.0 15.8 81.2 47.8±12.6 21.0 115.1 F 32.5±8.6 16.0 70.0 47.9±10.5 22.0 95.6 III 2009-2011 M 32.5±8.4 16.3 70.4 48.8±13.3 22.0 109.0 F 32.5±8.9 17.7 75.0 49.4±10.4 21.0 102.7
BMI (kg/m2)
I 2005-2006 M 17.4±3.0 10.0 37.3 19.1±3.4 9.0 38.5 F 17.2±2.9 10.0 32.2 19.3±3.2 9.5 35.7 II 2007-2008 M 17.7±3.3 10.7 35.4 19.3±3.5 9.2 38.3 F 17.4±3.0 11.1 33.4 19.7±3.4 12.0 36.3 III 2009-2011 M 17.5±3.2 10.9 34.0 19.5±3.6 12.0 35.9 F 17.4±3.2 11.0 36.0 19.9±3.3 11.9 36.4
BMI, body mass index; F, female sex; M, male sex; Max., maximum values; Min., minimum values; SD, standard deviation.
Regarding the analysis of excess weight (overweight and obesity), worrisome data were observed: approximately 20% of subjects presented overweight, and the occurrence of obesity ranged from 5.5% to 12.2% in the last evalu-ated period (2009-2011), representing a mean prevalence of excess weight of 27.6% in males and of 33.8% in females. These results are consistent with data observed in studies of Brazilian regions, such as by Fagundes et al.,21 by Oliveira
et al.,22 and by Rech et al.,23 as well as those verified in
countries where obesity has already been defined as a preva-lent disease, such as the studies by Davis et al.24 and by
Ogden et al.25 The results of Brazilian schoolchildren thus
characterize a new public health problem.
When analyzing the trend, small variations were observed in the occurrence of overweight for male children, with a significant increase in occurrence from 22% to 23.8% from period I to II, and a decrease to 21.1% in the last evaluated period (2009 to 2011), indicating the absence of a plateau for this profile, as demonstrated by Kunesová et al.26This is
different from the results regarding obesity, in which a sig-nificant increase in occurrence was observed from period I to II (2005-2006 to 2007-2008) in both age categories (children
Table 3 Prevalence of underweight, overweight, and obesity in the children.
Children aged 7 to 10 years
Underweight Overweight Obesity
Occurrence OR 95% CI Occurrence OR 95% CI Occurrence OR 95% CI
Male gender
Period I 2005-2006 2.1% 1.05 [0.73-1.52] 22.0% 0.86 [0.77-0.98] 4.0% 0.56 [0.45-0.72] Period II 2007-2008 1.9% 0.95 [0.66-1.36] 23.8% 1.15 [1.02-1.30]a 6.7% 1.77 [1.40-2.23]a Period III 2009-2011 1.7% 0.85 [0.49-1.47] 21.1% 0.83 [0.69-0.99]a 5.6% 0.78 [0.57-1.07]
Female gender
Period I 2005-2006 3.1% 1.21 [0.87-1.70] 22.4% 0.93 [0.82-1.09] 9.3% 0.72 [0.60-0.86] Period II 2007-2008 2.5% 0.82 [0.58-1.15] 23.0% 1.07 [0.94-1.22] 12.3% 1.39 [1.16-1.66]a Period III 2009-2011 4.0% 1.66 [1.09-2.53]b 22.4% 0.99 [0.82-1.19] 12.2% 1.07 [0.79-1.27]
Table 4 Prevalence of underweight, overweight, and obesity in the adolescents.
Adolescents aged 11 to 14 years
Underweight Overweight Obesity
Occurrence OR 95% CI Occurrence OR 95% CI Occurrence OR 95% CI
Male gender
Period I 2005-2006 1.5% 1.21 [1.06-2.09] 22.7% 1.02 [0.93-1.11] 3.6% 0.71 [0.60-0.86] Period II 2007-2008 1.0% 0.67 [0.47-0.94]a 22.1% 0.98 [0.89-1.07] 5.0% 1.39 [1.17-1.66]a Period III 2009-2011 1.0% 0.97 [0.50-1.61] 24.1% 1.12 [0.97-1.31] 5.5% 1.13 [0.85-1.51]
Female gender
Period I 2005-2006 2.4% 1.06 [0.63-1.61] 20.9% 0.96 [0.87-1.24] 4.8% 0.66 [0.56-0.79] Period II 2007-2008 2.2% 0.94 [0.71-1.24] 21.1% 1.03 [0.94-1.15] 6.9% 1.5 [1.26-1.79]a Period III 2009-2011 2.2% 1.00 [0.62-1.61] 22.0% 1.04 [0.88-0.24] 6.0% 0.86 [0.66-1.15]
asignificant difference for p < 0.005 when the reference category was period I. CI, confidence interval; OR, odds ratio.
and adolescents) and in both genders, suggesting a main-tenance of this prevalence in the last evaluated period (2009-2011). Studies using Brazilian data (HBS 2008-2009)7
indicate an approximate 10% increase in obesity in the child and adolescent population, when compared with data from 1974-75, but there is no analysis indicating an increase in the last evaluated periods.
However, the study by Ogden et al.27showed results
sim-ilar to those of the present study, demonstrating that during the 12 years of analysis, there was a significant trend of increase in the prevalence of obesity in children and adoles-cents and, again similar to the present findings, there was no significant increase between the years 2007-2008 and from 2009 to 2010.
The explanations for the phenomenon of increase in prevalence of overweight and obesity appear to be based on the literature, as shown by Coelho et al.28 and Malta
et al.,29 where these authors state that this phenomenon
was the result of new life habits, such as the increase in the consumption of unhealthy foods and decreased daily energy expenditure. However, the existence of a possible plateau in the prevalence of obesity still deserves further studies; the authors believe that this fact can be considered primary prevention, characterized by decreased incidence, which directly affects prevalence.
Nevertheless, the high occurrence of overweight and obesity in children and adolescents are still a matter of concern, particularly due to their rapid increase in the Brazilian population, justifying the study of these profiles, mainly because this population is at high risk of remaining obese as adults, as shown by Conde and Borges30 and by
The et al.31 The present findings are difficult to compare;
no other studies that included representative samples of Brazilian schoolchildren could be retrieved, as well as the fact that the studies conducted to date differ regarding the methodology used, especially in relation to the adopted pro-file criteria, i.e., the use of a single category for overweight and obesity (termed excess weight), and the lack of the study of trends.
Finally, this study contributes with the following conclu-sions: the prevalence of underweight is declining and remains within acceptable WHO standards14 (below 5%), in
contrast to the high values found for overweight and obe-sity, which together include almost 30% of the population of children and adolescents. Regarding the study of the trend of obesity, a significant increase in the occurrence was observed in all age groups and in both genders during the period comprising the years 2005-2006 to 2007-2008; the prevalence remained high during the subsequent period (2009-2011).
Funding
Coordenac¸ão de Pessoal de Nível Superior (Capes) and Con-selho Nacional de Desenvolvimento Científico e Tecnológico (CNPq).
Conflict of interest
The authors declare no conflict of interest.
Acknowledgements
The authors would like to thank the teachers of the insti-tutions participating in the PROESP-Br for applying the test and creating the database. They would also like to thank the members of the PROESP-Br study group, and CAPES and CNPq for the scholarships and scientific productivity grants.
References
1. Ribas DL, Philippi ST, Tanaka AC, Zorzatto J. Saúde e estado nutricional infantil de uma populac¸ão da região Centro-Oeste do Brasil. Rev Saude Publica. 1999;33:358---65.
2. Gigante DP, Victora CG, Araújo CL, Barros FC. Tendências no perfil nutricional das crianc¸as nascidas em 1993 em Pelotas, Rio Grande do Sul, Brasil: análises longitudinais. Cad Saude Publica. 2003;19:141---7.
4. Monteiro CA, Benicio MH, Konno SC, Silva AC, Lima AL, Conde WL. Causas do declínio da desnutric¸ão infantil no Brasil, 1996-2007. Rev Saude Publica. 2009;43:35---43.
5. Moreira RB. Composic¸ão corporal de escolares de 10 a 15 anos: um estudo longitudinal. [Dissertation]. Porto Alegre: Universi-dade Federal do Rio Grande do Sul; 2009.
6. Bamidele JO, Asekun-Olarinmoye EO, Olajide FO, Abodunrin OL. Prevalence and socio-demografic determinants of under-weight and pre-obesity among in -school adolescents in Olorunda local goverment area, Osun state, Nigeria. TAF Prev Med Bull. 2011;10:397---402.
7. Instituto Brasileiro de Geografia e Estatística (IBGE). Pesquisa de orc¸amentos familiar 2008-2009: antropometria e estado nutri-cional de crianc¸as, adolescentes e adultos no Brasil. Rio de Janeiro: IBGE; 2010.
8. Singh AS, Mulder C, Twisk JW, van Mechelen W, Chinapaw MJ. Tracking of childhood overweight into adulthood: a systematic review of the literature. Obes Res. 2008;9:474---88.
9. Costa RF, Santos NS, Goldraich NP, Barski TF, Andrade KS, Kruel LF. Metabolic syndrome in obese adolescents: a compar-ison of three different diagnostic criteria. J Pediatr (Rio J). 2012;88:303---9.
10. Fernandes RA, Rosa CS, Silva CB, Bueno DR, Oliveira AR. Desempenho de diferentes valores críticos de índice de massa corporal na identificac¸ão de excesso de gordura corporal e obesidade abdominal em adolescentes. Rev Assoc Med Bras. 2007;53:515---9.
11. Oliveira RP, Dias AS, Bosco AD, Angelich AG, Ullsefer S, Magal-hães FC, et al. Avaliac¸ão da capacidade respiratória, obesidade e capacidade física em crianc¸as de 8 a 11 anos de idade. Ciência em Movimento. 2010;23:7---18.
12. Barbosa RM, Soares EA, Lanzillotti HS. Avaliac¸ão do estado nutri-cional de escolares segundo três referências. Rev Paul Pediatr. 2009;27:243---50.
13. Barbosa Filho VC, Quadros TM, Souza EA, Gordia AP, Campos W. A utilizac¸ão do critério da Organizac¸ão Mundial da Saúde para classificac¸ão do estado nutricional em crianc¸as. Motriz: Rev Educ Fis (online). 2010;16:811---9.
14. World Health Organization (WHO). The world health report 1995: bridging the gaps. Geneva: World Health Organization; 1995.
15. Gaya AC. Projeto Esporte Brasil. Manual de aplicac¸ão de medidas e testes, normas e critérios de avaliac¸ão. Porto Alegre; 2009. [cited 16 July 2011]. Available from: http://www.proesp.ufrgs.br/proesp/images/pdf/ MANUALDOPROESP-BR 2012.pdf
16. Projeto Esporte Brasil (PROESP-BR)[Internet].Brazil [cited 2013 Jun12]. Available from: http://www.proesp.ufrgs.br
17. Conde WL, Monteiro CA. Body mass index cutoff for evaluation of nutricional status in Brazilian children and adolescents. J Pediatr (Rio J). 2006;82:266---72.
18. Marinho CL. Estado nutricional de crianc¸as de 0 a 10 anos acom-panhadas pelo Sistema de Vigilância Alimentar e Nutricional
(SISVAN) na 1acoordenadoria regional de saúde do estado do Rio Grande do Sul, Brasil. [Course conclusion article]. Porto Alegre: Universidade Federal do Rio Grande do Sul; 2008.
19. Anjos LA, Castro IR, Engstrom EM, Azevedo AM. Crescimento e estado nutricional em amostra probabilística de escolares no município do Rio de Janeiro, 1999. Cad Saude Publica. 2003;19:S171---9.
20. Frota MA, Mota RM, Albuquerque CD, Silveira VG, Oliveira IC. Crianc¸as desnutridas: percepc¸ão da família quanto ao cuidado. Cienc Cuid Saude. 2011;10:233---9.
21. Fagundes AL, Ribeiro DC, Naspitz L, Garbelini LE, Vieira JK, Silva AP, et al. Prevalência de sobrepeso e obesidade em escolares da região de Parelheiros do município de São Paulo. Rev Paul Pediatr. 2008;26:212---7.
22. Oliveira AP, Oliveira AA, Oliveira ER, Azambuja MA, Rinaldi W. Estado nutricional de escolares de 6 a 10 anos em Cruzeiro do Oeste-PR. Rev Bras Promo Saúde. 2011;24:289---95.
23. Rech RR, Halpern R, Costanzi CB, Bergmann ML, Alli LR, Mat-tos AP, et al. Prevalência de obesidade em escolares de 7 a 12 anos de uma cidade Serrana do RS, Brasil. Rev Bras Crescimento Desenvov Hum. 2010;12:90---7.
24. Davis AM, Bennett KJ, Befort C, Nollen N. Obesity and related health behaviors among urban and rural children in the United States: data from the National Health And Nutrition Exam-ination Survey 2003-2004 and 2005-2006. J Pediatr Psychol. 2011;36:669---76.
25. Ogden CL, Carroll MD, Curtin LR, Lamb MM, Flegal KM. Preva-lence of high body mass index in US children and adolescents, 2007-2008. JAMA. 2010;303:242---9.
26. Kuneˇsová M, Vignerová J, Paˇrízková J, Procházka B, Braunerová R, Riedlová J, et al. Long-term changes in prevalence of over-weight and obesity in Czech 7-year-old children: evaluation of different cut-off criteria of childhood obesity. Obes Res. 2011;12:483---91.
27. Ogden CL, Carroll MD, Kit BK, Flegal KM. Prevalence of obesity and trends in body mass index among US children and adoles-cents, 1999-2010. JAMA. 2012;307:483---90.
28. Coelho LG, Cândido AP, Machado-Coelho GL, de Freitas SN. Association between nutritional status, food habits and physical activity level in schoolchildren. J Pediatr (Rio J). 2012;88:406---12.
29. Malta DC, Sardinha LM, Mendes I, Barreto SM, Giatti L, Cas-tro IR, et al. Prevalência de fatores de risco e protec¸ão de doenc¸as crônicas não transmissíveis em adolescentes: resulta-dos da Pesquisa Nacional de Saúde do Escolar (PeNSE), Brasil, 2009. Cien Saude Colet. 2010;15:3009---19.
30. Conde WL, Borges C. The risk of incidence and persistence of obesity among Brazilian adults according to their nutri-tional status at the end of adolescence. Rev Bras Epidemiol. 2011;14:71---9.