PANOECONOMICUS, 2013, 6, pp. 759-773
Received: 27 April 2012; Accepted: 07 December 2012.
UDC 338.23:336.74 (061.1 EU) (497.11) DOI: 10.2298/PAN1306759O Original scientific paper
Saša Obradović
Faculty of Economics, University of Kragujevac, Serbia
Vladimir Mihajlović Faculty of Economics, University of Kragujevac, Serbia
This paper is part of research project No. 179015 (Challenges and prospects of structural changes in Serbia: Strategic directions for economic development and harmonization with EU requirements), financed by the Ministry of Science and Education of the Republic of Serbia.
Synchronization of Business
Cycles in the Selected European
Countries
Summary: The synchronization of business cycles represents one of the con-ditions that countries have to fulfil to become part of an optimum currency area, as well as a condition for the efficient implementation of a common economic policy in these countries. This paper examines the extent to which Serbia and its neighbouring countries fulfil these conditions, taking the euro area as an optimum currency area. By applying the Hodrick-Prescott and the band-pass filters, as well as the Pearson correlation coefficient and the Spearman rank correlation coefficient, this paper examines the synchronization of business cycles in these countries. Taking Serbia as an example, the influence of the foreign trade volume between two countries on the similarity of their business cycles is tested. The results show a lower harmonization of business cycles in Serbia with those in the euro area, when compared with the selected neigh-bouring countries, and do not confirm the thesis on the influence of the foreign trade volume on the harmonization of business cycles.
Key words:Business cycles, Serbia, Euro area, Optimum currency area, HP filter, BP filter, Rolling correlation, Convergence.
JEL: E01, E32, F44.
Recent studies have often tried to examine the extent to which the business cycles of two or more countries are coordinated and synchronized. The synchronization of business cycles in certain countries is one of the criteria for establishing an optimum currency area (OCA). From an OCA perspective, Jean-Pierre Allegret and Alain Sand-Zantman (2008) suggest that foreign shocks engender a near-common business cycle in Latin American countries, which tend to react similarly to the same foreign shocks. This paper examines the harmonization of business cycles as a condition for a country to become a part of an OCA. Specifically, it examines the extent to which business cycles in Serbia are synchronized with business cycles in the euro area (which is a precondition for Serbia to become a member of the euro area), and it compares the cycles in Serbia and in some of the surrounding countries (Bulgaria, Romania, Croatia, Hungary, and Slovenia). The extent to which the cycles in the neighbouring countries are synchronized with the euro area (Euro 15) is also examined, to show the position of Serbia according to that criterion. Moreover, this paper examines the convergence between the business cycles in Serbia and selected countries according to their volume of foreign exchange. More specifically, the paper tests the following three hypotheses:
760 Saša Obradović and Vladimir Mihajlović
(2) The convergence between business cycles in Serbia and selected neighbouring countries (as well as the common European cycle) increased during the observed period;
(3) Business cycles in Serbia are more synchronized with the cycles in the countries with which Serbia has a greater volume of foreign exchange.
The analysis carried out in this paper shows that the degree of synchronization of business cycles in Serbia is relatively highly correlated with the cycles of the countries under consideration. However, the correlation coefficients, as well as their statistical significance, depend on the method of filtration used in the calculation. This paper also shows a convergence between the business cycles in Serbia and the rest of the considered countries (in terms of increasing the degree of their synchronization). On the other hand, all countries except Romania registered growth in the synchronization of business cycles with the euro area. Finally, the analysis does not confirm that the synchronization of business cycles in Serbia would be higher if the volume of foreign exchange is larger.
1. Overview of the Relevant Literature
A number of papers have explored the harmonization between business cycles in the euro area and certain countries, as well as in the euro area itself. For instance, Jesús Crespo-Cuaresma and Octavio Fernández-Amador (2010) analysed business cycles and obtained results indicating a convergence of business cycles in European countries that lasted until the establishment of the European Monetary Union (EMU). Jacob de Haan, Robert Inklaar, and Richard Jong-a-Pin (2005) conclude that the degree of synchronization of business cycles within the euro area increased, and emphasize, as the main reason, the intensification of mutual trade among these countries. Michael Artis (2003) also tried to answer the question of whether “the European business cycle“ exists. He concludes, however, that one cannot say a lot in its favour. An extensive analysis of the European business cycle is also provided by Michael Dueker and Katrin Wesche (2001), Michael Artis, Massimiliano Marcellino, and Tommaso Proietti (2003), Michael U. Bergman (2004), and Paul Omerod (2005).
761
Synchronization of Business Cycles in the Selected European Countries
euro. Zsolt Darvas and György Szapáry (2004) studied business cycles in the EMU, particularly in 12 countries and 8 Central European countries. They demonstrated that the business cycles of the countries under consideration after the accession to the Union show a tendency towards an increase in synchronization with the older member states. William C. Gruben, Jahyeong Koo, and Eric Millis (2002) come to a similar conclusion, but they consider that the impact of international trade is not of so much importance to the increase in business cycle correlation.
The literature that treats the problem of business cycles in Serbia as well as their synchronization with other countries is very scarce. Therefore, this study aimed to examine this particular issue in order to determine the facts and funds of knowledge regarding the subject. In doing so, the methodology used is that encountered in the majority of cases in the relevant literature.
2. Data and Methodology
This paper measures the harmonization of business cycles by the correlation coefficient between the corresponding time series for real gross domestic product (GDP). By applying the method of rolling correlation, the paper examines whether the convergence between Serbia and the countries under consideration increases, i.e., whether the similarity between their business cycles increases. The aim is to assess the level and statistical significance of the correlation between these time series.
This paper also tests a position that is often present in the literature, i.e., a position that indicates that a greater intensity of mutual trade between two countries leads to an increased synchronization of their business cycles. The intent, partly, is to demonstrate the level that Serbia currently is at in terms of its “readiness” to adopt a common monetary policy and unique currency of the European Union.
In the analysis of business cycles, the most commonly used data are related to real GDP as an aggregate measure of economic activity in a country. The quarterly data for real GDP have been used in this paper.
The period covered by the analysis depends on the availability of the data. When the total and rolling coefficient of the correlation between time series in Serbia and other countries included in the analysis are calculated, the observed period of time is conditioned by the data available for Serbia, and encompasses the first quarter of 2001 to the fourth quarter of 2009 (2001Q1–2009Q4). This is done so that the observed period would be the same for all the countries. The data come from Eurostat’s base for all the countries, except for Serbia, for which the data used come from the Statistical Office of the Republic of Serbia. On the other hand, when trend values and business cycles for individual countries are calculated, the covered period depends on the availability of the data provided by Eurostat, and for all the countries, it is in the range of 1995Q1–2010Q4, except for Romania (2000Q3–2010Q4) and Croatia (2000Q1–2010Q4). Thus, the study includes 15 euro area countries.
762 Saša Obradović and Vladimir Mihajlović
filtering is conducted twice: first, using the original data, and then, the cyclical component. Upon the second filtering, the trend component is obtained, and it is composed of the oscillations that are largely explained by business cycle, and by the so-called random component, as a result of different shocks that can particularly be associated with the transition process that the countries under consideration went through during the covered period. To calculate the correlation coefficient, the trend component values from the second filtering step are used. In applying the HP filter, the so-called “smoothness“ parameter (λ) is used, with the value of 1600 when the filter is applied to quarterly data.
The second filter is the band-pass (BP) or Baxter-King filter. This filter removes from the time series those fluctuations that have frequencies that are too high or too low, thus leaving the trends that are the consequence of the business cycle. In this paper, when the BP filter is applied, two thresholds are used. For the quarterly data, the lower threshold value is 6, and the upper is 32. In other words, this filter removes all the oscillations lasting less than 6 quarters (1.5 years) and more than 32 quarters (8 years). Thus, the filtered data include the oscillations lasting from 1.5 to 8 years, which is in accordance with the conventional perception of business cycles length (Marianne Baxter and Robert G. King 1999).
Both filters are applied to the logarithmic data (natural logarithm), as the values obtained reflect the growth rates most closely. When the filtered values reflecting the trend are subtracted from real GDP values, the cyclical component is obtained, which in fact represents the business cycle. The synchronization of the business cycles in two countries is measured by the Pearson correlation coefficient to determine the degree of quantitative agreement between the observed data. The correlation coefficients of business cycles obtained by the HP and BP filters are presented in the form of the correlation matrix.
763
Synchronization of Business Cycles in the Selected European Countries
deviation of rolling coefficients from the level of 1 means that there is a divergence, that is, a decrease in the synchronization of business cycles of the countries under consideration.
The hypothesis on the impact of the intensity of mutual trade between Serbia and the selected countries on their business cycle synchronization is examined using the Spearman rank correlation coefficient, which determines whether there is a monotonic relationship between the two phenomena. The Spearman coefficient is calculated using the following formula:
1
61 21
2
n n
d r
n
i i
s .
The Spearman coefficient analyses the degree of quantitative agreement between two groups of ranked data: one containing the Pearson correlation coefficients between the cycles in Serbia and other countries, given in the correlation matrix (based on the double HP filter), and the other concerning the data on the extent of mutual trade of Serbia and other countries, which is represented by the sum of export and import values. The data are ranked in the following manner: in the first group of data, the highest correlation coefficient is ranked 1, the next according to size is ranked 2, and this continues until the minimum, which is ranked 6 (as the correlation between the cycles in Serbia and six countries is observed). In the second group, the country with which Serbia has the highest volume of foreign trade is ranked 1, with rank 6 given to the country with which Serbia has the lowest volume of foreign trade. If the volume of foreign trade relations between two countries is the key factor that affects the business cycle synchronization of the two countries, the Spearman correlation coefficient has a high value, close to the maximum. Within this coefficient, di is the difference between the ranks of the countries according to the
correlation coefficients of business cycles with Serbia and the ranks of the countries according to the volume of foreign trade with Serbia. A higher value of this coefficient would indicate a greater influence of Serbia’s foreign trade with other countries on the synchronization degree between their business cycles.
3. Results
764 Saša Obradović and Vladimir Mihajlović
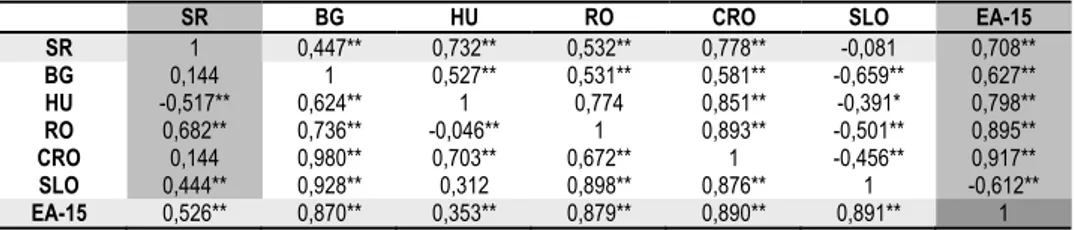
Table 1 Business Cycle Synchronization: Correlation Matrix for Period 2001Q1–2009Q4
SR BG HU RO CRO SLO EA-15
SR 1 0,447** 0,732** 0,532** 0,778** -0,081 0,708**
BG 0,144 1 0,527** 0,531** 0,581** -0,659** 0,627**
HU -0,517** 0,624** 1 0,774 0,851** -0,391* 0,798**
RO 0,682** 0,736** -0,046** 1 0,893** -0,501** 0,895**
CRO 0,144 0,980** 0,703** 0,672** 1 -0,456** 0,917**
SLO 0,444** 0,928** 0,312 0,898** 0,876** 1 -0,612**
EA-15 0,526** 0,870** 0,353** 0,879** 0,890** 0,891** 1
Note: Above the diagonal are the correlation coefficients relating to the data obtained by applying the BP filter, and below the diagonal are the data obtained by applying the HP filter. The results without asterisks are statistically insignificant. * Statistically significant results at the 0,05 significance level (two-tailed test).
** Statistically significant results at the 0,01 significance level (two-tailed test).
Source: Authors’ estimations.
The matrix shows that the obtained values of the correlation coefficient between the cycles in Serbia and those in Hungary, Romania, Slovenia, and the euro area are statistically significant (the double HP filter is applied in the second column in Table 1). Business cycles in Serbia are most synchronized with those in Romania (correlation coefficient 0,682), and least synchronized with those in Hungary (-0,517) and Slovenia (0,444) (as the obtained values of the correlation coefficient between Serbia and Bulgaria and Serbia and Croatia are not statistically significant). The values obtained by applying the BP filter suggest that only the correlation coefficient between business cycles in Serbia and Slovenia is not statistically significant, and that the business cycles in Serbia are most synchronized with the cycles in Croatia (correlation coefficient of 0,778) and least synchronized with the cycles in Bulgaria (0,447).
The correlation matrix shows that, according to the values based on the double HP filter, there is a direct strong link between cycles in the euro area and Slovenia, Croatia, Romania, and Bulgaria, while the values obtained by the BP filter indicate that such a link exists with the cycles in Croatia and Romania. All these results are statistically significant. It can be seen that the correlation coefficient between the values obtained by using HP and BP filters are considerably different. One of the conclusions derived from this is that the obtained results are not robust. However, this is not necessarily the case, because in a large number of studies the application of these two filters produces different results. In further analysis the values obtained using the double HP filter will be used, which is the author’s choice, taking into account the advantages and disadvantages of both, which are encountered in the literature.
765
Synchronization of Business Cycles in the Selected European Countries
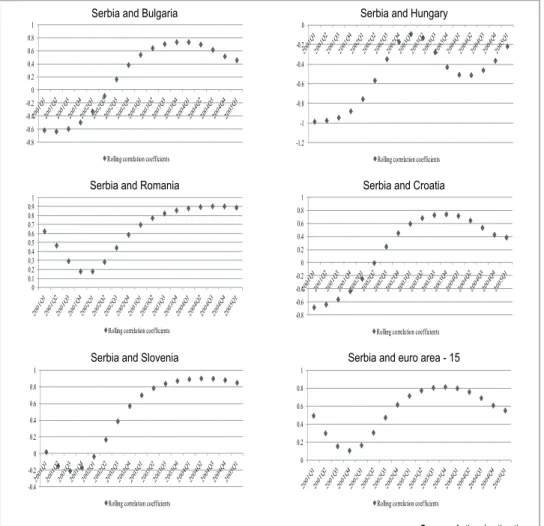
Serbia and Bulgaria Serbia and Hungary
Serbia and Romania Serbia and Croatia
Serbia and Slovenia Serbia and euro area - 15
Source: Authors’ estimations.
Figure 1 Rolling Correlation between Business Cycles in Serbia and the Selected Neighbouring Countries in the Period 2001Q1–2009Q4
coefficients of level 1 means that the synchronization of the business cycles of the countries under consideration is increasing. Figure 1 shows that the rolling correlation coefficients for Serbia and selected countries follow a similar pattern. A significant increase can be seen in the synchronization of business cycles with the observed countries from the sub-period starting with the second quarter of 2001 in the case of Croatia, the third quarter of 2001 in the case of Bulgaria and Hungary, the fourth quarter in the case of Slovenia, and the first quarter of 2002 in the case of Romania and the euro area. This increase in the synchronization degree lasts to sub-periods that start with the second quarter of 2003 for Hungary, the first quarter of 2004 for Croatia and the euro area, the second quarter of 2004 for Bulgaria, and the fourth quarter of 2004 for Slovenia and Romania. After those sub-periods, the degree of synchronization of business cycles between Serbia and the countries under consideration decreases. As there is a growing degree of synchronization of business
-0.8 -0.6 -0.4 -0.2 0 0.2 0.4 0.6 0.8 1
Rolling correlation coefficients
-1.2 -1 -0.8 -0.6 -0.4 -0.2 0
Rolling correlation coefficients
0 0.1 0.2 0.3 0.4 0.5 0.6 0.7 0.8 0.9 1
Rolling correlation coefficients
-0.8 -0.6 -0.4 -0.2 0 0.2 0.4 0.6 0.8 1
Rolling correlation coefficients
-0.4 -0.2 0 0.2 0.4 0.6 0.8 1
Rolling correlation coefficients
0 0.2 0.4 0.6 0.8 1
766 Saša Obradović and Vladimir Mihajlović
cycles in Serbia and the countries under consideration in the observed period (2001Q1–2009Q4) (because the initial sub-periods show a lower degree of synchronization than the later ones), the hypothesis that there is a convergence between the cycles in Serbia and those in the surveyed countries can be accepted.
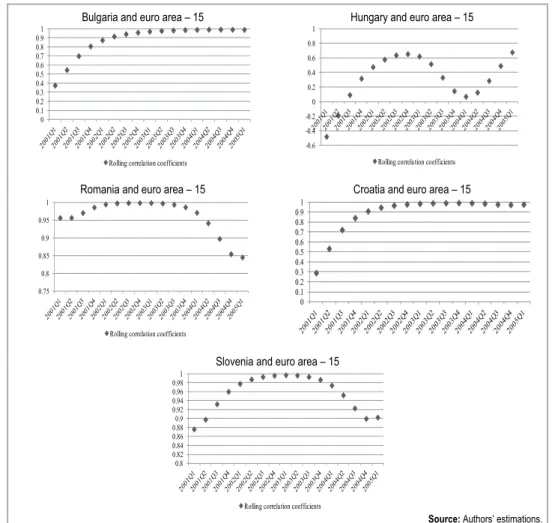
In the same way, Figure 2 shows the rolling correlation coefficients between the business cycles of the selected countries and the 15 countries of the euro area. Unlike the results of the previous analysis, which follow a relatively similar pattern, there is no such pattern in this case. There is a similarity between the values of rolling correlation coefficients in the case of Bulgaria and Croatia, with the synchronization of their business cycles constantly increasing during the observed period; there are high values from the very beginning, i.e., the sub-period that starts with the first quarter of 2003 (relatively close to 1). During the whole period, Slovenia had a high synchronization of business cycles with the euro area, which is the highest in the sub-periods in the middle of the total period.
Bulgaria and euro area – 15 Hungary and euro area – 15
Romania and euro area – 15 Croatia and euro area – 15
Slovenia and euro area – 15
Source: Authors’ estimations.
Figure 2Rolling Correlation between Business Cycles in the Selected Countries and the Euro Area - 15 in the Period 2001Q1–2009Q4
0 0.1 0.2 0.3 0.4 0.5 0.6 0.7 0.8 0.9 1
Rolling correlation coefficients
-0.6 -0.4 -0.2 0 0.2 0.4 0.6 0.8 1
Rolling correlation coefficients
0.75 0.8 0.85 0.9 0.95 1
Rolling correlation coefficients
0 0.1 0.2 0.3 0.4 0.5 0.6 0.7 0.8 0.9 1
0.8 0.82 0.84 0.86 0.88 0.9 0.92 0.94 0.96 0.98 1
767
Synchronization of Business Cycles in the Selected European Countries
In the case of Hungary, there was an increase in the values of rolling correlation coefficients for the sub-period with which the first quarter of 2003 starts, after which the values decrease. They start to increase again after the sub-period of the second quarter of 2004. Of all the countries under consideration, only in Romania do the business cycles decrease during the whole period. The conclusion is that, except for Romania, all of the other business cycles in the selected countries converge with the cycles of the 15 countries of the euro area during the observed period.
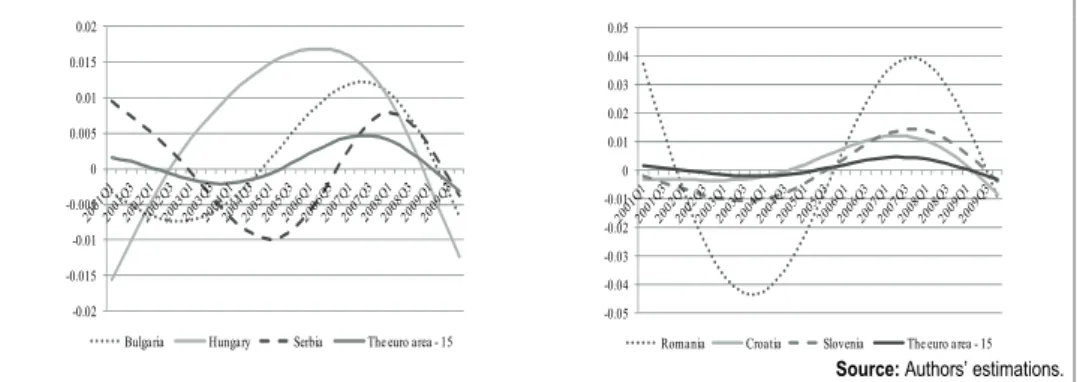
Figure 3 shows another way to visually assess the synchronization of business cycles (in this case during the entire period of observation). The data were processed by double HP filter, and there is a comparative review of the cycles in Bulgaria, Hungary, and Serbia with the cycle in the euro area (left), and of the cycles in Romania, Croatia, and Slovenia with the cycle in the euro area (right). In this manner, one can see the timing of entry of an economy into the downward or the upward phase compared with the cycle in the euro area, as confirmed by the correlation coefficient values given in the correlation matrix. For example, note that business cycles in Hungary are least synchronized with those in the euro area, which is confirmed by the correlation coefficient. On the other hand, the movement of the line referring to business cycles in Slovenia is almost identical to that of the line representing business cycles in the euro area, which is in accordance with the obtained result showing that Slovenia has the highest degree of business cycle synchronization with the euro area. Moreover, it can be concluded that the business cycles of Serbia and neighbouring countries move within a greater band than that of the 15 countries of the euro area. This implies that the economies of the former countries are more unstable and volatile than the economies of the 15 countries of the euro area.
Source: Authors’ estimations.
Figure 3Business Cycles in the Countries under Consideration (Double HP Filter Applied)
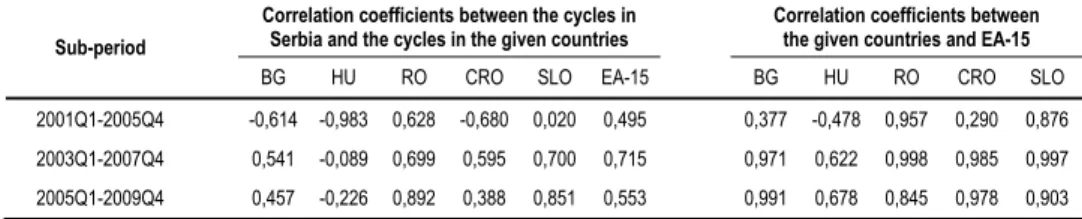
To determine the change in the synchronization of business cycles in the corresponding pairs of countries during the observed period, it is best to consider the difference in the correlation coefficients between business cycles in the first and the last sub-periods (interval). Table 2 shows the rolling correlation coefficients between the cycles in the countries under consideration and those in Serbia and the euro area, for the first and the last intervals. In the period 2001Q1–2009Q4, the first interval
-0.02 -0.015 -0.01 -0.005 0 0.005 0.01 0.015 0.02
Bulgaria Hungary Serbia The euro area - 15
-0.05 -0.04 -0.03 -0.02 -0.01 0 0.01 0.02 0.03 0.04 0.05
768 Saša Obradović and Vladimir Mihajlović
includes the first 20 quarters (2001Q1–2005Q4), and the last interval includes the last 20 quarters (2005Q1–2009Q4). In this manner, we can see the changes in the business cycle synchronization degree in the observed pairs of countries during the covered period. Moreover, bearing in mind that the mortgage markets crisis in the United States, which occurred in the second half of 2007, had an impact on the European economy in 2008 and 2009, Table 2 includes one more sub-period – 2003Q1–2007Q4 (the sub-period immediately before the crisis). In this way, it is possible to check the robustness of the results, because the correlation coefficients are measured before and after the crisis, as are their impact on the synchronization of business cycles of the countries analysed in this paper.
Table 2 Rolling Correlation Coefficients between the Analysed Countries in the First, the Sub-period before the Crisis, and the Last Sub-period
Sub-period
Correlation coefficients between the cycles in Serbia and the cycles in the given countries
Correlation coefficients between the given countries and EA-15
BG HU RO CRO SLO EA-15 BG HU RO CRO SLO
2001Q1-2005Q4 -0,614 -0,983 0,628 -0,680 0,020 0,495 0,377 -0,478 0,957 0,290 0,876
2003Q1-2007Q4 0,541 -0,089 0,699 0,595 0,700 0,715 0,971 0,622 0,998 0,985 0,997
2005Q1-2009Q4 0,457 -0,226 0,892 0,388 0,851 0,553 0,991 0,678 0,845 0,978 0,903
Source: Authors’ calculations.
As can be seen in Table 2, in the period included in the research (2001Q1– 2009Q4), the synchronization between business cycles in Serbia and those in Slovenia and Romania increased the most, while it is slightly increased in relation to the business cycles in the euro area. In the sub-period before the crisis, the degree of synchronization of business cycles in Serbia with euro area is higher. The correlation coefficient between the business cycles in Serbia and in Bulgaria, Serbia, and Croatia in the first interval is negative, and in the last is positive, which means that the movement of business cycles shifted from relatively opposite to more synchronized movement. Interestingly enough, Serbia had a higher degree of synchronization with these two countries before the crisis.
769
Synchronization of Business Cycles in the Selected European Countries
The hypothesis that a greater volume of foreign trade between a certain country and Serbia affects the synchronization of their business cycles can be tested using the Spearman rank correlation coefficient. Table 3 gives the spreadsheet for obtaining this coefficient. Each country under consideration gets a rank according to the volume of trade with Serbia (measured by the sum of the export and import values) and according to the value of the correlation coefficient between its business cycles and the cycles in Serbia. The analysis includes the absolute values of the correlation coefficients. As the correlation coefficients of business cycles between Serbia and Croatia and between Serbia and Bulgaria are equal, when ranking the coefficient values the average rank value is used, as the arithmetic mean of the ranks that the values of the coefficient would have in the series if they were different (in this case, 5 and 6).
Table 3 The Spreadsheet for Calculating the Spearman Rank Correlation Coefficient
Country
Volume of trade with Serbia (mil. USD)*
Rank according to the volume
of trade
Value of the correlation coefficient (the HP filter)
with Serbia
Rank according to the values of the
correlation coefficient
di2
EA-15 50955 1 0,526 2 1
SLO 4560 2 0,444 4 4
HU 4180 3 -0,517 3 0
RO 4047 4 0,682 1 9
CRO 3917 5 0,144 5,5 0,25
BG 3544 6 0,144 5,5 0,25
∑ - - - - 14,5
Source: Statistical Office of the Republic of Serbia.
According to this pattern, the value of the Spearman rank correlation coefficient is 0,586. This value indicates a monotonic relationship between the volume of foreign trade between Serbia and the mentioned countries, but it is not prominent. Additionally, a test of this hypothesis using a two-tailed test shows that the obtained result is not statistically significant. A similar result is obtained if we analyse the correlation coefficients between the data acquired by the BP filter, where the value of the Spearman coefficient was −0,086. It can be concluded that in this manner and with this number of countries involved, the causal relationship between the volume of foreign trade and business cycles synchronization in the case of Serbia cannot be proved. Further research may involve more countries and the analysis of some additional factors that may affect the relationship between these two values. At the same time, the small sample of the observed variables imposes a crucial limitation on the analysis conducted in this paper.
4. Final Remarks
770 Saša Obradović and Vladimir Mihajlović
From the results obtained, the following conclusions can be drawn. Primarily, the application of the HP and BP filters resulted in different indicators of business cycle synchronization in the observed countries. However, based on the prevailing position encountered in the literature, emphasis is placed on the results obtained by applying the (double) HP filter. Research has shown that, with the exception of Hungary, business cycles in Serbia are least synchronized with the cycles in the euro area. This can be partially explained not only by the fact that Serbia is the last of the countries under consideration to have entered into negotiations on entry into the European Union, but also by the fact that Serbia has been in a period of transition for a number of years. All this implies that in the existing conditions, the common monetary policy at the Union level would not give good results in Serbia, and the same applies to the adoption of the euro as a unique currency. In any case it is premature to discuss this issue, considering that Serbia is still at the stage of obtaining candidate status.
Additionally, the results show that a “common“ business cycle within the countries under consideration cannot be discussed. As for the synchronization of business cycles in Serbia with those in certain countries, it could be seen that in the observed period, harmonization with some of those countries increased significantly (with Slovenia and Romania), while it increased slightly compared with the euro area.
771
Synchronization of Business Cycles in the Selected European Countries
References
Allegret, Jean-Pierre, and Alain Sand-Zantman. 2008. “Monetary Integration Issues in
Latin America: A Multivariate Assessment.“ Panoeconomicus, 55(3): 279-308.
Artis, Michael J. 2003. “Is There a European Business Cycle?“ Center for Economic Studies Working Paper 1053.
Artis, Michael, Massimiliano Marcellino, and Tommaso Proietti. 2003. “Dating the Euro Area Business Cycle.“ Innocenzo Gasparini Institute for Economic Research Working Paper 237.
Baxter, Marianne, and Robert G. King. 1999. “Measuring Business Cycles: Approximate
Band-Pass Filters for Economic Time Series.“ The Review of Economics and Statistics,
81(4): 575–593.
Bergman, Michael U. 2004. “How Similar are European Business Cycles?“ University of Copenhagen Economic Policy Research Unit Working Paper 2004-13.
Bonetto, Fabienne, Srdjan Redžepagić, and Anna Tykhonenko. 2009. “Balkan Countries:
Catching Up and Their Integration in the European Financial System.”
Panoeconomicus, 56(4): 475-489.
Crespo-Cuaresma, Jesús, and Octavio Fernández-Amador. 2010. ”Business Cycle
Convergence in EMU: A First Look at the Second Moment.“ Forschungsschwerpunkt Internationale Wirtschaft Working Paper 54.
Damyanov, Atanas, and Galin Stefanov. 2010. “Business Cycle Synchronization between
the Bulgarian Economy and the European Union.“ South-Eastern Europe Journal of
Economics, 2: 171–185.
Dardac, Nicolae, and Elena Bojesteanu. 2009. “An Empirical Analysis of Romania's
Comovement with the Euro Zone.“ Theoretical and Applied Economics, 11(11): 41–
50.
Darvas, Zsolt, and György Szapáry. 2004. “Business Cycle Synchronisation in the Enlarged EU: Co-Movements in the New and Old Members.“ Centre for European Policy Studies Working Document 200.
Dueker, Michael, and Katrin Wesche. 2001. “European Business Cycles: New Indicies and
Analysis of Their Synchronicity.“ Federal Reserve Bank of St. Louis Working Paper 1999-019B.
Filis, George, Christos Floros, Costas Leon, and Christina Beneki. 2010. “Are EU and
Bulgarian Business Cycles Synchronized?“ Journal of Money, Investment and
Banking, 14: 36-45.
Gruben, William C., Jahyeong Koo, and Eric Millis. 2002. “How Much Does International
Trade Affect Business Cycle Synchronization.“ Federal Reserve Bank of Dallas Research Department Working Paper 0203.
Haan, Jacob de, Robert Inklaar, and Richard Jong-a-Pin. 2005. “Will Business Cycles in the Euro Area Converge: A Critical Survey of Empirical Research.“ Centre for Economic Research Working Paper 2005/08.
Nilsson, Ronny, and Gyorgy Gyomai. 2011. “Cycle Extraction: A Comparison of the
Phase-Average Trend Method, the Hodrick-Prescott and Cristiano-Fitzerald Filters.” Organization for Economic Co-operation and Development Statistics Working Paper 2011/04.
772
Saša O
bradovi
ć
and Vladimir Mihajlovi
ć PA NO ECO N OM IC U S , 2 013, 6, pp. 75 9-773
Appendix
Real and Fi lte red Val u es of Quarterly GDP and Bus ines s Cycles in the Countries un der C onsi d er atio n BulgariaCycles in Bulgaria
Hungary
C
ycles in Hungary
Romania
C
ycles in Romania
Croat
ia
Cycles in Croat
ia
7.
2 7.4 7.6 7.8 8 8.2 8.4 8.6 8.8
1997Q1 1997Q4 1998Q3 1999Q2 2000Q1 2000Q4 2001Q3 2002Q2 2003Q1 2003Q4 2004Q3 2005Q2 2006Q1 2006Q4 2007Q3 2008Q2 2009Q1 2009Q4 2010Q3 ln GDP R ea l G D P va lu es (ln) HP f ilt er BP f ilter -0 .2
5 -0.2
-0
.1
5 -0.1
-0
.0
5 0
0.
0
5 0.1
0.
1
5 0.2
1997Q1 1997Q3 1998Q1 1998Q3 1999Q1 1999Q3 2000Q1 2000Q3 2001Q1 2001Q3 2002Q1 2002Q3 2003Q1 2003Q3 2004Q1 2004Q3 2005Q1 2005Q3 2006Q1 2006Q3 2007Q1 2007Q3 2008Q1 2008Q3 2009Q1 2009Q3 2010Q1 2010Q3 HP f ilt er B P f ilt er 9.
1 9.2 9.3 9.4 59. 9.6 9.7 9.8 9.9
1995Q1 1995Q4 1996Q3 1997Q2 1998Q1 1998Q4 1999Q3 2000Q2 2001Q1 2001Q4 2002Q3 2003Q2 2004Q1 2004Q4 2005Q3 2006Q2 2007Q1 2007Q4 2008Q3 2009Q2 2010Q1 2010Q4 ln GDP R ea l G D P va lue s ( ln) H P f ilt er B P f ilt er -0 .1 5 -0 .1 -0 .0 5 0 0. 05 0. 1 0. 15 1995Q1 1995Q4 1996Q3 1997Q2 1998Q1 1998Q4 1999Q3 2000Q2 2001Q1 2001Q4 2002Q3 2003Q2 2004Q1 2004Q4 2005Q3 2006Q2 2007Q1 2007Q4 2008Q3 2009Q2 2010Q1 2010Q4 HP f ilt er BP f ilter 8.
3 8.4 8.5 8.6 8.7 8.8 8.9 9 9.1 9.2 9.3 9.4
2000Q3 2001Q1 2001Q3 2002Q1 2002Q3 2003Q1 2003Q3 2004Q1 2004Q3 2005Q1 2005Q3 2006Q1 2006Q3 2007Q1 2007Q3 2008Q1 2008Q3 2009Q1 2009Q3 2010Q1 2010Q3 ln GDP R ea l G D P va lue s ( ln) H P f ilt er B P f ilt er -0 .2
5 -0.2
-0
.1
5 -0.1
-0 .0 5 0 0. 05 0. 1 0. 15 0. 2 0. 25 0. 3 2000Q3 2001Q1 2001Q3 2002Q1 2002Q3 2003Q1 2003Q3 2004Q1 2004Q3 2005Q1 2005Q3 2006Q1 2006Q3 2007Q1 2007Q3 2008Q1 2008Q3 2009Q1 2009Q3 2010Q1 2010Q3 ln GDP H P f ilter BP f ilter 8.
3 8.4 8.5 8.6 8.7 8.8 8.9 9 9.1 9.2
2000Q1 2000Q3 2001Q1 2001Q3 2002Q1 2002Q3 2003Q1 2003Q3 2004Q1 2004Q3 2005Q1 2005Q3 2006Q1 2006Q3 2007Q1 2007Q3 2008Q1 2008Q3 2009Q1 2009Q3 2010Q1 2010Q3 ln GDP R ea l G D P va lue s ( ln) H P f ilt er B P f ilt er -0 .0 6 -0 .0 4 -0 .0 2 0 0.
02 0.04 0.06 0.08
773
Synchronizat
ion of
Business Cycles in t
he Sele
ct
ed European Count
ries PA NO ECO N OM IC U S , 2 013, 6, pp. 75 9-773 Slovenia C
ycles in Slovenia
Serbia
Cy
cles
in Serbia
The euro area
-15
C
ycles in t
he euro area
-15 Sour ce : Au thors’ est imat ions. 8. 4 8. 45 8. 5 8. 55 8. 6 8. 65 8. 7 8. 75 8. 8 8. 85 1995Q1 1995Q4 1996Q3 1997Q2 1998Q1 1998Q4 1999Q3 2000Q2 2001Q1 2001Q4 2002Q3 2003Q2 2004Q1 2004Q4 2005Q3 2006Q2 2007Q1 2007Q4 2008Q3 2009Q2 2010Q1 2010Q4 ln GDP R e a l G D P va lue s ( ln) HP fi lte r -0 .0 8 -0 .0 6 -0 .0 4 -0 .0 2 0 0.
02 0.04 0.06 0.08 0.
1 1995Q1 1995Q4 1996Q3 1997Q2 1998Q1 1998Q4 1999Q3 2000Q2 2001Q1 2001Q4 2002Q3 2003Q2 2004Q1 2004Q4 2005Q3 2006Q2 2007Q1 2007Q4 2008Q3 2009Q2 2010Q1 2010Q4 HP fil te r 7. 95 8 8. 05 8. 1 8. 15 8. 2 8. 25 8. 3 8. 35 8. 4 2001Q1 2001Q3 2002Q1 2002Q3 2003Q1 2003Q3 2004Q1 2004Q3 2005Q1 2005Q3 2006Q1 2006Q3 2007Q1 2007Q3 2008Q1 2008Q3 2009Q1 2009Q3 ln GDP Re al G D P v alue s ( ln) H P filt er BP filt er -0 .1 5 -0 .1 -0 .0 5 0 0. 05 0. 1 0. 15 HP f ilte r B P f ilt er 9. 4 9. 45 9. 5 9. 55 9. 6 9. 65 9. 7 9. 75 9. 8 9. 85 9. 9 9. 95 1995Q1 1995Q4 1996Q3 1997Q2 1998Q1 1998Q4 1999Q3 2000Q2 2001Q1 2001Q4 2002Q3 2003Q2 2004Q1 2004Q4 2005Q3 2006Q2 2007Q1 2007Q4 2008Q3 2009Q2 2010Q1 2010Q4 ln GDP R ea l G D P va lue s ( ln) H P f ilt er B P f ilt er -0 .0 4 -0 .0 3 -0 .0 2 -0 .0 1 0 0.
01 0.02 0.03 0.04
774 Saša Obradović and Vladimir Mihajlović