www.jped.com.br
ORIGINAL ARTICLE
Sociodemographic, anthropometric and dietary determinants of
dyslipidemia in preschoolers
夽
Luciana N. Nobre
a,∗, Joel A. Lamounier
b, Sylvia do C.C. Franceschini
caDoctor. Departamento de Nutric¸ão, Universidade Federal dos Vales do Jequitinhonha e Mucuri, Diamantina, MG, Brazil bDoctor. Departamento de Medicina, Universidade Federal de São João Del-Rei, Divinópolis, MG, Brazil
cDoctor. Departamento de Nutric¸ão, Universidade Federal de Vic¸osa, Vic¸osa, MG, Brazil
Received 29 November 2012; accepted 6 February 2013 Available online 10 July 2013
KEYWORDS
Hypercholes-terolemia; Body mass index; Feeding behavior
Abstract
Objective: To investigate the determinants of dyslipidemia in preschoolers.
Methods: A total of 227 preschoolers residing in an urban area of the city of Diamantina, Minas Gerais, Brazil were evaluated at age 5 years, using a cross-sectional design. Dietary intake from a food frequency questionnaire, anthropometric/biochemical parameters, and socioeco-nomic/behavioral information from a questionnaire were evaluated. ‘Mixed diet’, ‘snack’, and ‘unhealthy’ dietary patterns were identified using principal component analysis. The determi-nants of dyslipidemia were examined using Poisson regression analysis.
Results: The prevalence of dyslipidemia in this study was 65.19%. Preschoolers who less frequently consumed foods in the ‘mixed diet’ dietary pattern had a higher risk of high concen-trations of low-density lipoprotein cholesterol (PR = 2.30; p = 0.004) when compared with those with more frequent consumption of the ‘mixed diet’ dietary pattern. Preschoolers whose moth-ers had lower levels of education presented a lower risk of high concentrations of low-density lipoprotein cholesterol (PR = 0.43; p = 0.003), and preschoolers who were overweight/obese pre-sented with greater risk of high concentrations of low-density lipoprotein cholesterol (PR = 2.23; p = 0.003).
Conclusion: The determinants of dyslipidemia identified in this study were less frequent con-sumption of foods in the ‘mixed diet’ dietary pattern, higher body mass index, and lower level of maternal education. This study shows that despite the young age of the group under study, they already present a high prevalence of dyslipidemia, which is an important risk factor for cardiovascular disease.
© 2013 Sociedade Brasileira de Pediatria. Published by Elsevier Editora Ltda. All rights reserved.
夽 Please cite this article as: Nobre LN, Lamounier JA, Franceschini SC. Sociodemographic, anthropometric and dietary determinants of
dyslipidemia in preschoolers. J Pediatr (Rio J). 2013;89:462---9. ∗Corresponding author.
E-mail:[email protected] (L.N. Nobre).
PALAVRAS-CHAVE
Hipercolesterolemia; Índice de massa corporal; Comportamento alimentar
Determinantes sociodemográficos, antropométricos e alimentares de dislipidemia em pré-escolares
Resumo
Objetivo: O objetivo deste estudo foi investigar os determinantes de dislipidemia em pré-escolares.
Métodos: A partir de um desenho transversal, foi avaliado um total de 227 pré-escolares com 5 anos de idade residentes em uma área urbana da cidade de Diamantina, Minas Gerais, Brasil. Foram avaliados: variáveis bioquímicas, antropométricas, condic¸ão socioeconômica e compor-tamental, a partir de um questinário; e ingestão alimentar, a partir de um questionário de fequência de consumo de alimentos. Os padrões alimentares denominados ‘‘dieta mista’’, ‘‘fast food’’ e ‘‘não saudável’’ foram identificados por meio de análise de componentes principais. Os determinantes de dislipidemia foram examinados através da análise de regressão de Poisson.
Resultados: A prevalência de dislipidemia, neste estudo, foi de 65,19%. Os pré-escolares que consumiam com menos frequência alimentos do padrão ‘‘dieta mista’’ tiveram um risco maior de concentrac¸ões mais altas de lipoproteína de baixa densidade (PR = 2,30; p = 0,004), em comparac¸ão com aqueles com um consumo mais frequente do padrão ‘‘dieta mista’’. Os pré-escolares cujas mães apresentaram uma escolaridade mais baixa tiveram um menor risco de concentrac¸ões mais altas com lipoproteína de baixa densidade (PR = 0,43; p = 0,003), e os pré-escolares que estavam com sobrepeso/obesos apresentaram maior risco de concentrac¸ões mais altas de lipoproteína de baixa densidade (PR = 2,23; p = 0,003).
Conclusão: Os determinantes de dislipidemia identificados neste estudo foram o consumo menos frequente de alimentos do padrão ‘‘dieta mista’’, índice de massa corporal mais alto e um maior nível de escolaridade materna. Este estudo mostra que, apesar da baixa idade do grupo em estudo, já estão apresentando alta prevalência de dislipidemia, que é um fator de risco importante para doenc¸a cardiovascular.
© 2013 Sociedade Brasileira de Pediatria. Publicado por Elsevier Editora Ltda. Todos os direitos reservados.
Introduction
Dyslipidemia is a disorder of lipoprotein metabolism that results in elevation of plasma lipid levels, such as high total cholesterol (TC), high low-density lipoprotein cholesterol (LDL-c), low high-density lipoprotein cholesterol (HDL-c), and high triacylglycerol (TAG).1 In children and adoles-cents, dyslipidemia is also defined as having a TC, LDL-c, and/or TAG level higher than the 95th percentile or an HDL-c level lower than the 10th percentile for age and gender.2
The prevalence of dyslipidemia in children and ado-lescents has been high in most countries. According to Al-Shehri,3dyslipidemia’s prevalence varies worldwide from 2.9% to 33% when defining the disease as having a TC level above 200 mg/dL. Studies conducted with children and adolescents in Brazil between 2000 and 2010 observed prevalence rates from 10% to 60.6%.4-10
Abnormal levels of lipids and lipoproteins are associated with indirect markers of atherosclerosis, including endothe-lial dysfunction assessed by flow-mediated dilation in the brachial artery and increased carotid intima-media thick-ness (cIMT).11 Pediatric elevations of TC, LDL-c, TAG, and the ratio of TC/HDL-c are correlated with increased cIMT and coronary artery calcium during adulthood.12
The majority of the cases of dyslipidemia in children and adolescents are related to obesity,13---17high waist-to-hip ratio, family history of dyslipidemia,17and lifestyle factors such as high consumption of unhealthy dietary patterns,18---20
meals rich in cholesterol and energy21 and low intake of unsaturated fatty acids.22
Research into determinants of dyslipidemia in Brazilian preschoolers that includes dietary patterns as an explana-tory variable has not been conducted yet. Thus, the aim of the present study was to investigate the determinants of dyslipidemia in preschoolers by including dietary patterns, since they can predict disease risk better than single foods or nutrients. The use of dietary patterns makes it possi-ble to identify the cumulative effect of various nutrients on health.
Methods
Type of study and location
This study used a cross-sectional design nested in a cohort of children who were born in the urban area of the city of Diamantina, Minas Gerais, Brazil, and resided there between September of 2004 and July of 2005.23This study23aimed to follow the growth and development of this cohort in their first year of life. The newborns’ parents were contacted in their homes during the first weeks of life. The recruitment was conducted using the Statement of Live Birth recorded by one of the two hospitals in the city of Diamantina.
one year old, a literacy rate of 83.4%, a human development index (HDI) of 0.748, and an income HDI of 0.752.24
Subjects and study protocol
At the beginning of the present study, all children were aged 5 years±5 months. They were recruited after an informed consent was obtained from their parents/guardians. This research was conducted from July of 2009 to July of 2010, and data collection was conducted by four nutritionists and one student. Each preschooler was visited in his/her home. Previous work recommended having five individual per food group listed on the food frequency questionnaire (FFQ), in order to identify dietary patterns.25In the present study, 24 food groups were identified, thus 120 individuals (5 x 24 groups) were needed for this study. Data from 227 preschool-ers were obtained, which was considered a satisfactory sample for the present study.
This study aimed to analyze the determinants of dyslipid-emia in addition to identifying dietary patterns, so power for the sample was calculated. Power was calculated post-hoc by using a Poisson regression to estimate the parameter risk difference from being overweight/obese, which was 2.11. The power obtained was 99%, using the statistical software G*Power.26
This study was conducted according to the guidelines pre-sented in the Declaration of Helsinki, and all procedures involving human subjects were approved by the Ethics Com-mittee of the Universidade Federal de Minas Gerais (ref. No. ETIC 545/08). An informed consent was obtained from the preschoolers’ parents or guardians.
Anthropometric indicator
Each child’s anthropometric status was evaluated by mea-suring weight and height to obtain the body mass index (BMI). Weight was measured utilizing a portable elec-tronic digital scale with a 150 kg capacity that measured increments of 50 g. Height was measured using a portable stadiometer with a degree of precision of 0.1 cm. The procedures adopted for these measurements followed the protocols recommended by Jelliffe.27
These measurements were taken in a laboratory of the Department of Nursing of the Universidade Federal dos Vales do Jequitinhonha e Mucuri (UFVJM) in the morning with fas-ting children, and all measurements were performed on a single occasion.
The cut-off point of≥+1 z-score identified preschoolers with elevated body mass index (overweight or obese) for their age using BMI/age.28To identify z-scores for each child, the World Health Organization(WHO) Anthro and Anthro plus softwares, versions 3.0.1 and 1.0.3, respectively, were used (WHO - Geneva).
Dietary patterns
Dietary patterns (DP) were identified using dietary informa-tion collected from a food frequency quesinforma-tionnaire (FFQ) created by Sales et al.29Before its use, a pilot test was con-ducted to assess the adequacy of the FFQ for the research.
Any foods not mentioned by the preschoolers’ families were excluded, and others were added to the FFQ after the pilot. Details of the food groupings and factor analysis used to generate the dietary patterns are described elsewhere.30
The dietary patterns are presented as a discrete vari-able. First, the sum of the frequency of consumption of foods contained in each group was calculated. Then, participants were categorized by a dichotomous variable (0 or 1) accord-ing to whether they had a value above (1) or below (0) the first quartile frequency of consumption for each food group.
Biochemical indicator
Venous blood samples for quantification of serum TC, LDL-c, HDL-LDL-c, and TAG were collected by a trained professional in the morning, between 7:00 and 9:00 a.m., following a fasting period of 10 to 12 hours. Biosafety principles were observed for this collection.
The values for TC, HDL-c, and TAG were obtained utilizing a Cobas Mira Plus device, and were analyzed via absorption photometry using the enzymatic method. LDL-c was deter-mined through calculation using the Friedwald formula while observing the limitations of this methodology.
The cut-offs used to assess the serum levels of TC, TAG, LDL-c, and HDL-c were based on national recommendations.31 Elevated levels of TC and LDL-c were defined as≥170 mg/dL and≥130 mg/dL, respectively. TAG levels ≥130 mg/dL were considered elevated, and HDL-c levels <45 mg/dL were considered low. Dyslipidemia was defined as the preschooler presenting abnormal levels of any of these parameters.
Other evaluations
Information regarding factors possibly associated with alter-ations in the lipid profile was obtained from a questionnaire completed by the child’s mother or caregiver at home. This questionnaire provided information about the family’s monthly income, maternal education, and behavioral char-acteristics of the child, such as time spent watching TV.
Statistical analysis
Poisson regression was used to evaluate determinants of dys-lipidemia. The variables that presented a p-value < 0.2 in the bivariate analysis were included in a multivariate anal-ysis, and a p-value < 0.05 was considered to be associated with dyslipidemia in the multivariate analysis. This analysis followed a hierarchical approach for the determination of significant factors32(Fig. 1). The database was constructed in Excel. Statistical analysis was performed using the Statis-tical Package for Social Sciences (SPSS) (SPSS Inc. - Chicago, IL, USA) for Windows, version 19.0.
Results
Distal level
Per capita family income Mother’s years of education Mother’s work outside the home
Proximal level
Dietary patterns: mixed diet, snack, and unhealthy Intermediate level
Body mass index Time spent watching TV
Dyslipidemia
Intermediate level
Gender
Figure 1 Hierarchical framework of association of dietary patterns with dyslipidemia in preschoolers.
73 (49.3%), 45 (30.4%), and six (2.6%) preschoolers, respec-tively.
Three dietary patterns were identified: ‘mixed diet’ consisted of food groups typical of a Brazilian diet; ‘snack’ consisted of baked food groups that usually do not require preparation for consumption; and ‘unhealthy’ consisted of sweets and foods rich in lipids and carbohydrates. The ‘mixed diet’ pattern explained a higher percentage of vari-ance, and was the pattern that best represented the food intake of the sample analyzed.
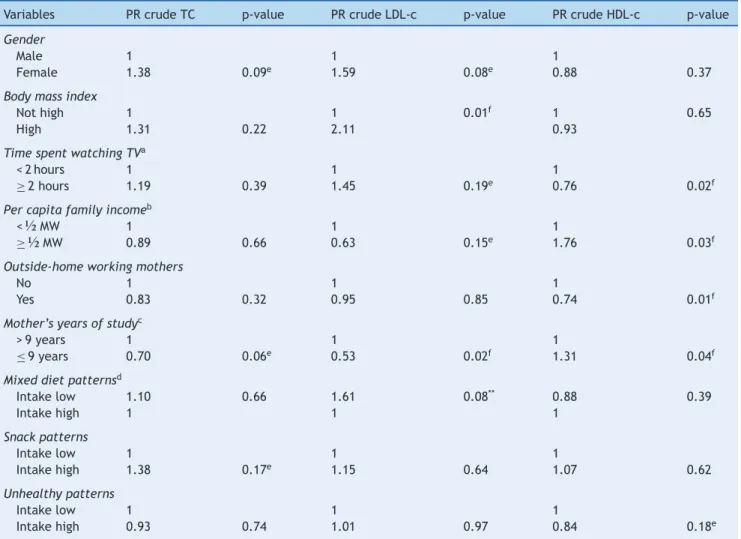
Table 1 shows the crude prevalence ratios for dyslipid-emia according to the socioeconomic, anthropometric, and behavioral characteristics and dietary patterns. This table demonstrates that LDL-c was the lipid associated with the greatest number of variables, followed by HDL-c and TC. Isolated hypertriglyceridemia was not associated with any variable studied, and the results were not presented.
It is worth mentioning that in the ‘mixed diet’ pattern, which can be considered protective against alteration of the lipid profile, ‘low intake’ was categorized as a 1. For the other patterns, which can be considered higher risk for alter-ations of the lipid profile, ‘high intake’ was categorized as 1.
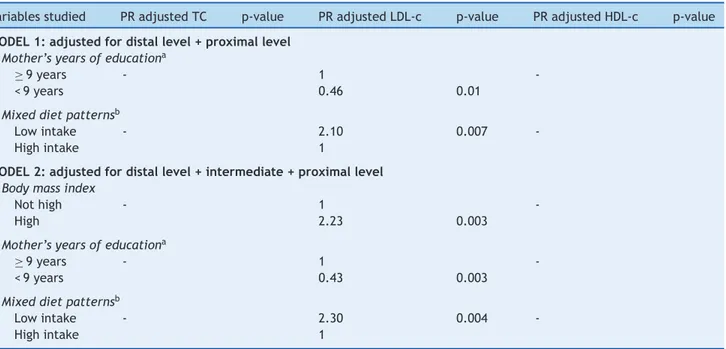
The regression analysis, adjusted for factors associated with dyslipidemia, is presented in Table 2. Considering the hierarchical framework proposed, which examines the determinants of dyslipidemia among the studied preschool-ers, two models were extracted. In model 1, a significant association was found for higher levels of LDL-c, lower maternal education, and low frequency of intake of the ‘mixed diet’ dietary pattern.
In model 2, high levels of LDL-c were associated with lower maternal education (PR = 0.43; p = 0.003), higher BMI (PR = 2.23; p = 0.003), and low frequency of intake of the ‘mixed diet’ dietary pattern (PR = 2.30; p = 0.004). In this analysis, high levels of TC and low HDL-c were not associated with any variable.
Of the 281 children in the original cohort, 232 (82.56%) were included in the study. The loss of 17.33% during follow-up was due to families moving away from the area (n = 37; 75.51%), incorrect addresses (n = 8, 16.33%); and family refusal to participate (n = 4; 8.16%). Five parents did not allow their children to provide blood samples, so this study presents results for the remaining 227 preschoolers.
Discussion
The findings of the present study are important warnings that dyslipidemia is part of a worrying reality that needs to be investigated at an early age, such as during preschool. Furthermore, these findings corroborate studies that have shown an increase in the number of cases of this disorder in Brazilian children and adolescents.4---10Is important to men-tion that the some publicamen-tions4---6about alterations in lipid profiles in Brazilian children and adolescents used cutoff points proposed by the NCEP21and recommendations by the III Brazilian guidelines on dyslipidemia,1and others7---10used the 1st Brazilian guideline for prevention of atherosclerosis in childhood and adolescence (IDPAIA)31
Some international publications on this topic have described how alterations in the lipid profiles of children are also a reality in other countries,13---15,17,33---36but at much lower prevalence than in research reported in Brazil and in the present study.
In this study, the higher prevalence of alterations in lipid profiles was found to be associated with low levels of HDL-c and high levels of LDL-c. These lipoproteins are involved, respectively, in the protection against and forma-tion of atherosclerosis. Individuals with low levels of HDL-c have a higher risk of developing atherosclerosis because this lipoprotein is responsible for various actions that con-tribute to protection against atherosclerosis.1LDL-c is the main atherogenic lipoprotein; its oxidation is the key mech-anism in the pathophysiology of an atheroma. Individuals with high levels of LDL-c may present with early clinical manifestations of atherosclerosis.
It is worth mentioning that the lipid profile of chil-dren in this study was classified according to the category ‘‘increased’’ on the IDPAIA,31which favored a higher preva-lence of low HDL-c. The IDPAIA uses a raised cutoff point for this lipoprotein. This cutoff point may be inappropriate for this age group, since high levels of HDL-c occur in the pres-ence of increased consumption of fruits and vegetables and physical activity, which are characteristics that are difficult to achieve in this age group.
Table 1 Crude prevalence ratios (PR) and respective p-values of variables associated with altered lipid profiles of preschoolers from Diamantina, Minas Gerais, Brazil.
Variables PR crude TC p-value PR crude LDL-c p-value PR crude HDL-c p-value
Gender
Male 1 1 1
Female 1.38 0.09e 1.59 0.08e 0.88 0.37
Body mass index
Not high 1 1 0.01f 1 0.65
High 1.31 0.22 2.11 0.93
Time spent watching TVa
< 2 hours 1 1 1
≥2 hours 1.19 0.39 1.45 0.19e 0.76 0.02f
Per capita family incomeb
<½MW 1 1 1
≥½MW 0.89 0.66 0.63 0.15e 1.76 0.03f
Outside-home working mothers
No 1 1 1
Yes 0.83 0.32 0.95 0.85 0.74 0.01f
Mother’s years of studyc
> 9 years 1 1 1
≤9 years 0.70 0.06e 0.53 0.02f 1.31 0.04f
Mixed diet patternsd
Intake low 1.10 0.66 1.61 0.08** 0.88 0.39
Intake high 1 1 1
Snack patterns
Intake low 1 1 1
Intake high 1.38 0.17e 1.15 0.64 1.07 0.62
Unhealthy patterns
Intake low 1 1 1
Intake high 0.93 0.74 1.01 0.97 0.84 0.18e
HDL-c, low high-density lipoprotein cholesterol; LDL-c, high low-density lipoprotein cholesterol; MW, Brazilian minimum wage; TC, total cholesterol.
aValue refers to the median of time spent watching TV.
b Value refers to the Brazilian minimum wage of US $288.1 (per month). c Value refers to the median years of schooling.
d Lower and upper first quartile of the distribution of scores for each dietary pattern considered, respectively. e significant at the 20% level for the Poisson regression test.
f significant at the 5% level for the Poisson regression test.
lower levels of education. The ‘mixed diet’ pattern rep-resents a balanced diet because it consists of foods from all food groups and follows the principles of a healthy diet. Therefore, less frequent consumption may represent a risk factor for elevated levels of LDL-c. Some foods contained in this dietary pattern admittedly provide greater protec-tion against altered lipid profile,31 such as leafy vegetables and fruits. Leafy vegetables (r = 0.656) and fruits (r = 0.618) showed higher correlations with this AP, which probably explains why less frequent consumption of this dietary pat-tern was significantly associated with increased levels of LDL-c.
It is interesting to note that some studies18,20,37---39 that evaluated the relation between AP and dyslipidemia found that this problem was associated with more frequent con-sumption of a ‘Western’ dietary pattern. This pattern is usually composed of foods like red meat, eggs, refined
grains, cafeteria foods, hamburgers, mayonnaise, biscuits, cakes, pies, chocolates, and soft drinks. In this study, while unhealthy patterns were also identified, they not were asso-ciated with dyslipidemia.
Table 2 Adjusted prevalence ratios (PR) and respective p-values of variables associated to the alteration in lipid profile of preschoolers. Diamantina, Minas Gerais, Brazil.
Variables studied PR adjusted TC p-value PR adjusted LDL-c p-value PR adjusted HDL-c p-value
MODEL 1: adjusted for distal level + proximal level
Mother’s years of educationa
≥9 years - 1
-< 9 years 0.46 0.01
Mixed diet patternsb
Low intake - 2.10 0.007
-High intake 1
MODEL 2: adjusted for distal level + intermediate + proximal level
Body mass index
Not high - 1
-High 2.23 0.003
Mother’s years of educationa
≥9 years - 1
-< 9 years 0.43 0.003
Mixed diet patternsb
Low intake - 2.30 0.004
-High intake 1
HDL-c, low high-density lipoprotein cholesterol; LDL-c, high low-density lipoprotein cholesterol; PR, prevalence ratios; TC, total choles-terol; Trace, variable not associated with lipid abnormality in question.
a Value refers to the median years of schooling.
b Lower and upper first quartile of the distribution of scores regarding eating pattern.
However, in a study with schoolchildren also residing in the city of Diamantina, MG, Barbosa et al.10 observed that the correlation between lipid profile (TC, TG, and HDL-c) and anthropometric and body composition parameters was weak. This finding was despite the fact that TC was posi-tively correlated with body fat percentage, whereas HDL-c was negatively correlated with waist-hip ratio in both boys and girls.
According to Asayama et al.,14 the association between body mass and dyslipidemia has multiple metabolic causes: insulin resistance, hyperinsulinemia, hyperglycemia, and increased protein for transferring cholesterol esters secreted by adipocytes, among other factors.
Another variable associated with dyslipidemia in this study was low maternal education, which exerted a pro-tective effect. This result can be contradictory if it is considered that mothers with lower education may have lower income and less access to information about a bal-anced diet, which may result in leaving their children more exposed to an unhealthy diet. However, it was observed that the preschoolers with mothers with lower education more often consumed the ‘mixed diet’ dietary pattern, and this pattern was considered protective against dyslipidemia.
In addition, when a more detailed analysis was performed to understand this relationship, it was observed that the factor that is really influencing this analysis was the lower per capitaincome, and whether the child attended school. That is, low maternal education only remained associated with more frequent consumption of the ‘mixed diet’ dietary pattern for preschool children attending schools (OR = 4.27) and those with lowerper capitaincome (OR = 3.56).30 This
means that the children of mothers with lower education who also had lower incomes and were attending school had less access to processed foods high in fats and sugars and less access to fast food, which put children at the highest risk for dyslipidemia. Moreover, children attending schools eat more balanced meals and likely to be exercising more.
There are some limitations to this study. The most impor-tant limitation concerns the assessment of the usual food intake of preschoolers and time spent watching television. Obtaining accurate information on these topics was difficult because most mothers worked outside the home (62.5%), and their children attended school (88.79%). It was difficult for mothers to accurately report what their children eat dur-ing the day, and their time spent on each activity. However, it is likely that studies with young children should take these factors into consideration.
Funding
Fundac¸ão de Amparo à Pesquisa do Estado de Minas Gerais --- FAPEMIG (Process number: APQ-00428-08).
Conflicts of interest
The authors declare no conflicts of interest.
References
1. Santos RD. Sociedade Brasileira de Cardiologia III Brazilian guidelines on dyslipidemias and guideline of atherosclero-sis prevention from atheroscleroatherosclero-sis. Department of Sociedade Brasileira de Cardiologia. Arq Bras Cardiol. 2001;77:1---48. 2. Expert Panel on Integrated Guidelines for Cardiovascular Health
and Risk Reduction in Children and Adolescents; National Heart Lung, and Blood Institute. Expert panel on integrated guide-lines for cardiovascular health and risk reduction in children and adolescents: summary report. Pediatrics. 2011;128:S213---56. 3. Al-Shehri SN, Saleh ZA, Salama MM, Hassan YM. Prevalence
of hyperlipidemia among Saudi school children in Riyadh. Ann Saudi Med. 2004;24:6---8.
4. Giuliano I de C, Coutinho MS, Freitas SF, Pires MM, Zunino JN, Ribeiro RQ. Serum lipids in school kids and adolescents from Florianópolis, SC Brazil - Healthy Floripa 2040 study. Arq Bras Cardiol. 2005;85:85---91.
5. Ribeiro RQ, Lotufo PA, Lamounier JA, Oliveira RG, Soares JF, Botter DA. Additional cardiovascular risk factors associated with excess weight in children and adolescents: the Belo Horizonte heart study. Arq Bras Cardiol. 2006;86:408---18.
6. Nobre LN, Sammour SN, Costa Sobrinho PS, Elias FC, Cavaca SC, Trindade R, et al. Lipid profile and weight excess among school children. Rev Med Minas Gerais. 2008;18:252---9.
7. Pereira PB, Arruda IK, Cavalcanti AM, Diniz A da S. Lipid profile of schoolchildren from Recife, PE. Arq Bras Cardiol. 2010;95:606---13.
8. Araki MV, Barros C, Santos EG. Análise do perfil lipídico de crianc¸as e adolescentes do estado de Sergipe. Scientia Plena. 2010;6:1---6.
9. Alcântara Neto OD, Silva RC, Assis AM, Pinto E de J. Fac-tors associated with dyslipidemia in children and adolescents enrolled in public schools of Salvador, Bahia. Rev Bras Epi-demiol. 2012;15:335---45.
10. Barbosa L, Chaves OC, Ribeiro RC. Anthropometric and body composition parameters to predict body fat percentage and lipid profile in schoolchildren. Rev Paul Pediatr. 2012;30:520---8. 11. Juonala M, Viikari JS, Rönnemaa T, Marniemi J, Jula A, Loo BM, et al. Associations of dyslipidemias from childhood to adulthood with carotid intima-media thickness, elasticity, and brachial flow-mediated dilatation in adulthood: the Cardiovas-cular Risk in Young Finns Study. Arterioscler Thromb Vasc Biol. 2008;28:1012---7.
12. Frontini MG, Srinivasan SR, Xu J, Tang R, Bond MG, Berenson GS. Usefulness of childhood non-high density lipoprotein cholesterol levels versus other lipoprotein measures in predicting adult sub-clinical atherosclerosis: the Bogalusa Heart Study. Pediatrics. 2008;121:924---9.
13. Cowin I, Emmett P. Cholesterol and triglyceride concentrations, birthweight and central obesity in pre-school children ALSPAC Study Team. Avon Longitudinal Study of Pregnancy and Child-hood. Int J Obes Relat Metab Disord. 2000;24:330---9.
14. Asayama K, Hayashibe H, Dobashi K, Uchida N, Nakane T, Kodera K, et al. Increased serum cholesteryl ester transfer protein in obese children. Obes Res. 2002;10:439---46.
15. Freedman DS, Dietz WH, Srinivasan SR, Berenson GS. The relation of overweight to cardiovascular risk factors among chil-dren and adolescents: the Bogalusa Heart Study. Pediatrics. 1999;103:1175---82.
16. Coronelli CL, de Moura EC. Hypercholesterolemia and its risk factors among schoolchildren. Rev Saude Publica. 2003;37:24---31.
17. Liao Y, Liu Y, Mi J, Tang C, Du J. Risk factors for dyslipidemia in Chinese children. Acta Paediatr. 2008;97:1449---53.
18. Dishchekenian VR, Escrivão MA, Palma D, Ancona-Lopez F, Araújo EA, Taddei JA. Dietary patterns of obese adolescents and different metabolic effects. Rev Nutr. 2011;24:17---29. 19. Northstone K, Emmett P. Multivariate analysis of diet in children
at four and seven years of age and associations with socio-demographic characteristics. Eur J Clin Nutr. 2005;59:751---60. 20. Ambrosini GL, Huang RC, Mori TA, Hands BP, O’Sullivan TA, de
Klerk NH, et al. Dietary patterns and markers for the metabolic syndrome in Australian adolescents. Nutr Metab Cardiovasc Dis. 2010;20:274---83.
21. American Academy of Pediatrics. National Cholesterol Educa-tion Program: report of the Expert Panel on Blood Cholesterol Levels in Children and Adolescents. Pediatrics. 1992;89:525---84. 22. Ribeiro KC, Shintaku RC. The influence of the lipids of the diet
on aterosclerose. ConScientiae Saúde. 2004;3:73---83.
23. Lessa AC. Alimentac¸ão e crescimento no primeiro ano de vida: um estudo de coorte [tese]. Salvador: Universidade Federal da Bahia; 2010.
24. Wikipedia. Diamantina. [cited 01 Oct 2012]. Available from: http://pt.wikipedia.org/wiki/Diamantina
25. Pestano MH, Gageiro JN. Análise de dados para ciências sociais: a complementaridade do SPSS. Lisboa: Edic¸ões Sílabo; 2005. 26. Portney LG, Watkins MP. Foundations of clinical research:
applications to practice. 3rd ed. Upper Saddle River, NJ:
Prentice-Hall; 2008.
27. Jelliffe DB. Evaluación del estado de nutrición de la comunidad. Geneva: World Health Organization; 1968.
28. World Health Organization (WHO). WHO Multicentre Growth Reference Study Group. WHO child growth standards: length/height-for-age, weight-for-age, weight-for-length, weight-for-height and body mass index-for-age: methods and development. Geneva: World Health Organization. Department of Nutrition for Health and Development. 2006.
29. Sales RL, Silva MM, Costa NM, Euclydes MP, Eckhardt VF, Rodrigues CM, et al. Development of a questionnaire to assess food intake of population groups. Rev Nutr. 2006;19: 539---52.
30. Nobre LN, Lamounier JA, Franceschini SC. Preschool children dietary patterns and associated factors. J Pediatr (Rio J). 2012;88:129---36.
31. Back Giuliano I de C, Caramelli B, Pellanda L, Duncan B, Mattos S, Fonseca FH, et al. I guidelines of prevention of atherosclerosis in childhood and adolescence. Arq Bras Cardiol. 2005;85:4---36. 32. Victora CG, Huttly SR, Fuchs SC, Olinto MT. The role of con-ceptual frameworks in epidemiological analysis: a hierarchical approach. Int J Epidemiol. 1997;26:224---7.
33. Bertrais S, Balkau B, Charles MA, Vol S, Calvet C, Tichet J, et al. Puberty-associated differences in total cholesterol and triglyc-eride levels according to sex in French children aged 10-13 years. Ann Epidemiol. 2000;10:316---23.
34. Fesharakinia A, Zarban A, Sharifzadeh GR. Lipid profiles and prevalence of dyslipidemia in schoolchildren in south Khorasan Province, eastern Iran. Arch Iran Med. 2008;11: 598---601.
35. Duarte JA, Ribeiro JC, Oliveira J, Mota J. The relationship between physical activity cholesterol levels in children and ado-lescents. Rev Bras Saude Matern Infant. 2004;4:185---92. 36. Ford ES, Li C, Zhao G, Mokdad AH. Concentrations of
children and adolescents in the United States. Circulation. 2009;119:1108---15.
37. Berg CM, Lappas G, Strandhagen E, Wolk A, Torén K, Rosen-gren A, et al. Food patterns and cardiovascular disease risk factors: the Swedish INTERGENE research program. Am J Clin Nutr. 2008;88:289---97.
38. Shang X, Li Y, Liu A, Zhang Q, Hu X, Du S, et al. Dietary pattern and its association with the prevalence of obesity and related
cardiometabolic risk factors among Chinese children. PLoS One. 2012;7:e43183.