Rev. Econ. Contemp., Rio de Janeiro, v. 16, n. 3, p. 393-414, set-dez/2012 393 * Artigo recebido em 06/10/2012 e aprovado em 30/11/2012.
a PhD in Economics and associate professor of Economics at the CEPN, Université Paris 13.
Contact: [email protected]
b Ph.D in Economics and professor of Economics at the CEPN, Université Paris 13. Contact:
Marc Lautier
aFrançois Moreau
bABSTRACT: Pro-Foreign Domestic Investment (FDI) policies have become a pillar of the development convention. While the literature has provided numerous studies on the efects of FDI on growth and investment in host country, very little is known about how domestic investment itself afects FDI inlows. he paper is an attempt to ill this gap. Evidences from a large cross-country sample (68 countries), over a long period (1984-2004), show that lagged domestic investment has a strong inluence on FDI inlows in the host economy, implying that domestic investment is a strong ca-talyst for FDI in developing countries and that multinational companies do follow economic development.
KEYWORDS: Foreign direct investment; developing countries; domestic investment; industrial policy.
1. FDI’S STATUS IN THE DEVELOPMENT CONVENTION
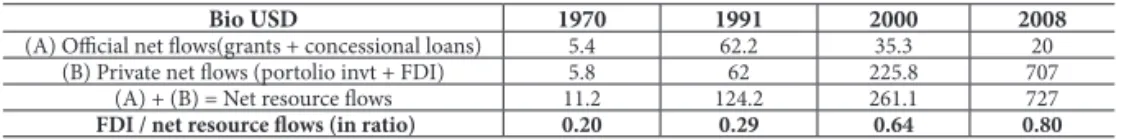
While Aid and concessional loans used to account for the bulk of resource lows to developing countries (DC) a couple of decades ago, FDI has become the main source of external resource. Table 1 below shows that the resource lows to DC have increa-sed since the early 1990s and that the most dramatic net increases have been in private capital lows, particularly FDI. he share of FDI in total net lows grew from 29% in 1991 to 80 % in 2008; meanwhile the share of oicial lows declined from 50 % to 3%. In nominal and real terms, oicial lows are now signiicantly lower than during the previous decades.
Table 1 - How important is FDI as a source of foreign capital in developing countries? (in billion USD)
Bio USD 1970 1991 2000 2008
(A) Oicial net lows(grants + concessional loans) 5.4 62.2 35.3 20
(B) Private net lows (portolio invt + FDI) 5.8 62 225.8 707
(A) + (B) = Net resource lows 11.2 124.2 261.1 727
FDI / net resource lows (in ratio) 0.20 0.29 0.64 0.80
Sources: Authors’ elaboration based on Kokko (2002), Global Development Finance (2009, 2002), World Bank.
With few alternatives sources of foreign inancing, it is not surprising that the atti-tudes towards inward FDI have changed over the last couple of decades. In contrast to former scepticism about whether FDI inlows should be encouraged at all, and to the frequent implementation of unfriendly policies towards Multinational Corporations (MNC), policy makers, as well as many scholars, now take the beneicial efects of FDI for granted. “MNC used to be seen as the emblem of dependency; they have now be-come the saviours of development” (Rodrik, 1999).
Pro-FDI policies rapidly became a pillar of the Washington consensus growth nar-rative, a pillar of the “neoliberal development convention” (Erber, 2008). “Development convention are ‘stories’ told about changes, (...) of how the future will be much better than the present if we follow the prescribed rules” (Erber, 2009). In that story, inter-national capital mobility would allow global savings to be better allocated, to channel resources to investment projects in DC and to raise income and growth. According to the IMF Head, Stanley Fisher, “it was an inevitable step on the path of development
which cannot be avoided” for DC governments1.
his policy convention has spread into the academic ield and into institutions such as laws and regulations.
Its spreading has been supported by a body of literature, which insists on the posi-tive role of FDI in the growth and development processes (Borensztein et al., 1998; De
1 In “Capital Account Liberalization and the role of the IMF”, IMF Seminar on Asia Hong Kong, Sept 19,
Melo, 1999; Markusen et al., 1999; OECD, 2002; Rodrik, 2000, 1999). hus, in addition to ill the traditional investment and foreign exchange gaps, FDI can stimulate domestic investment, increase local market competition, enlarge international market access for local products, and generate externalities and knowledge “spillovers” (Blomstrom and Kokko, 2000). While development strategies used to focus on State’s investments and interventions, FDI is now considered as the main source of catching-up and technolo-gical development. “he policy objective regarding investment is to improve the returns to investment in poor countries, both domestic and foreign, with a particular goal to increase the FDI lows directed to poor countries”, considers an updated OECD paper on FDI in DC (Mayer, 2006). FDI attraction has become a development agendas priority. Almost all countries liberalized their FDI policies. hose FDI policy changes have become more widespread since 1989, and the Eastern European economies “transition” process. According to UNCTAD (2001), more than 95% of the 1185 FDI regulation changes implemented during the 1990s have signiicantly eased restrictions on FDI in-lows and MNC operations. In fact, despite (or thanks to) the absence of a multilateral framework for FDI, “unilateral, bilateral and regional eforts towards the liberalisation of national FDI frameworks have led to a remarkable level of de facto convergence of government policy approaches towards FDI among countries from all regions” (UNC-TAD, 1994, p. 286).
hus, DC governments have turned to the question of how to attract FDI and have initiated various measures to achieve this goal. he design and the implementation of FDI promotion policies have been promoted, and oten supported, by international organisations and foreign donors (from the IMF to the EC) to help DC to beneit from
this potent force for economic growth2. hus, every host government now provides
numerous forms of incentives to encourage entry by MNC: iscal privileges, regula-tion distorregula-tions or exempregula-tions, subsidies, preferential loans and guarantees. Foreign investment promotion agencies and attractiveness policies have lourished everywhere to build up or strengthen host country location advantages (Blomstrom and Kokko, 2003; Oman, 2000).
DC has implemented policies aimed at creating stronger incentives for foreign in-vestors who are potentially capable of providing FDI lows. Understanding the deter-minants of FDI inlows and unveiling the reasons why some developing countries are more successful than others in attracting FDI may thus provide policy makers with useful guidance for future policies. FDI lows can undoubtedly promote growth. Ho-wever, the reverse causality, from growth to international investment attraction, may
2 See for instance the Initiative on Governance and Investment for Development in the Middle East and
explain most of the correlation. MNC location decisions should be inluenced by host countries economic performance: it would be logical for MNCs to choose to invest in more proitable economies. hus, this paper primary focus is to investigate whether domestic investment is a signiicant determinant of FDI in developing countries. It di-fers from existing studies because, irstly, it uses a large cross-country (68 developing countries) sample over a long period (1984-2004) and, secondly, because it analyzes the inluence of domestic performance on international integration, rather than the impact of international integration on domestic performance.
he next section ofers a review of the literature on the determinants of FDI in de-veloping countries. Section 3 provides an introduction to our analytical framework. Methodology and data used in the empirical study are presented in Section 4. Section 5 discusses the regression results, and Section 6 presents some concluding remarks.
2. HOW ECONOMISTS EXPLAIN FDI LOCATION
he increasing role played by FDI in developing countries has created considerable re-search interest among economists. Consequently, an extensive empirical literature exists on FDI determinants in developing countries and/or on MNCs location determinants. he literature examines a large number of variables that have been put forward to explain FDI. Some of these variables are encompassed in formal hypotheses, whereas others are only suggested because they make sense intuitively. In the absence of a consensus on a theoretical framework to guide the empirical work, the result is a sizeable and diverse literature in which investigators have considered a number of explanatory variables in an attempt to establish a statistically signiicant relationship among FDI inlows and other variables of interest. hose studies have identiied a number of variables, such as market size, economic openness, rate of return, quality of infrastructure, human capital, political instability, as potential determinants of FDI (Lim, 2001). However, according to Chakrabati meticulous surveys (2003, 2001), while “a vast empirical literature not only exists but continue to grow around the issues of identifying the forces attracting FDI. It is not exactly clear whether one can have any conidence in the conclusions re-ached by FDI regressions”.
deter-minants (Kawaguchi, 1994). A study on the consequence of EU enlargement on FDI lows towards other developing or emerging countries inds similar results: host market size and growth rate have the highest inluence (Kawaguchi, 1994). It is noteworthy that iscal and tax incentives were considered as having little or no impact on FDI location decisions. Buch et al. (2005) investigate the determinants of German FDI location over the world. hey show that a 1% increase in the size of a given foreign market is associa-ted with a 1% increase in the activity of the German irms in this location.
Econometric studies typically use aggregate measures of FDI to study either one particular country or a panel of countries. While a couple of variables such as market size or labor cost are usually included in empirical models, other determinants chosen vary signiicantly, according to data availability or research objective. On average, the most robust determinant of FDI inlows is the market size. Market size estimated by real GDP or GDP per capita is signiicant in most studies (Dupuch and Mazier, 2002; Mayer, 2006; Michalet, 1999; Levasseur, 2002; Lim, 2001) – a result that may relect the predominance of market seeking FDI strategies (“horizontal” FDI). he stock of infrastructure in the host country also has a positive impact on FDI inlows (Dupuch and Mazier, 2002; Kinda, 2007; Kumar, 2000; Rieber, 2000). Agglomeration efects are oten found to be highly signiicant (Lim, 2001). Sectoral studies show that MNCs lo-cation choices are strongly inluenced by the presence of foreign investors. he impact of trade openness is expected to be uncertain, because of the prevailing horizontal na-ture of FDI strategies. Nevertheless, several studies show a positive link (Lecraw, 1991; OECD, 2002). Low labor cost should have a positive inluence on FDI. However, the impact becomes mitigated or null when the diferent qualities of labor are included in the model. For example, Mody et al. (1998) do not ind that low wages are a deter-minant of Japanese FDI, although a better quality of labor inluences positively FDI. Similarly, higher tax levels are expected to negatively inluence MNC location choices and FDI inlows. However, this negative causality is not robust. In fact, most of the cost variables, as wage and tax for instance, can be integrated in econometric regression as proxies of host country advantages in terms of labor productivity or infrastructure and public goods supply. hen, the empirical results are mixed. he country economic and social stability does inluence very signiicantly FDI inlows, and MNC avoid countries and territories where political risks and economic instability are high (Asiedu, 2001; Lecraw, 1991; Pigato, 2001).
that “the relation between FDI and many of the controversial variables (namely, tax, wages, openness, exchange rate, tarifs, growth and trade balance) are highly sensitive to small alterations in the conditioning information set”. he two main exceptions are market size, a robust and positive determinant of FDI, and country instability, a ro-bust but negative explaining factor. Agglomeration efects additionally have a positive inluence. However, since they explain current FDI lows by the amount of cumulated FDI in the country, they leave open the determinants of the initial investments and this result can not lead to practical policy implications.
To sum up, the empirical evidences on FDI attraction drive us back to the basic structure of the investment behaviour since Keynes: the investment decision (the lo-cation choice or investment attraction) results from the combination of the volume of demand (proxies here are market size variables) with the risk of investment (proxies here: instability or country risk indicator).
3. ANALYTICAL FRAMEWORK
3.1. FIRMS INVESTMENT BEHAVIOURS
However global, FDI does not low everywhere with the same intensity. Among deve-loping countries, certain host economies are more attractive than others. While there is no consensus on the determinants of host country FDI attractiveness, diferences in international attractiveness between countries are easy to observe.
opportunities (i.e., low level of economic attractiveness), or that MNC usually do not invest where they are plenty of such opportunities (i.e., high level of economic attrac-tiveness), as shown by the investment rate of domestic irms3, or both.
hus, we expect domestic investment to lead foreign direct investment. Private investment by developing countries irms signals proitable opportunities and stable conditions, and thus stimulates FDI. In other words, domestic investment acts as a ca-talyst for foreign investment.
3.2. WHY WOULD FDI FOLLOW DOMESTIC INVESTMENT? EMPIRICAL STUDIES
A large attention has been devoted in the literature to FDI impact on economic growth in host countries, and a number of studies have examined the impact of FDI on do-mestic investment. In the neoclassical growth model, FDI promotes economic growth by increasing the volume of investment and/or its eiciency (Li and Liu, 2005). hus, FDI positive contribution mainly comes from growth stimulation (Borensztein et al., 1998; De Mello, 1999; Findlay, 1978; Lim, 2001; Nunnenkamp and Spatz, 2003; Wang, 1990) and from FDI’s role as a channel for technology transfer and spillovers, notably through linkages with local suppliers (Blomstrom and Kokko, 2000; Grether, 1997; Smarzynska, 2004; Xu and Wang, 2000). Several papers have also attempted to measure the crowding-in and crowding-out efects of FDI on domestic investment (Agosin and Machado, 2005; Agosin and Mayer, 2000; Bosworth and Collins, 1999; Kumar and Pra-dhan, 2002; Markusen and Venables, 1999), with conlicting results. In comparison, a very narrow attention has been dedicated to the impact of domestic investment on FDI.
To our knowledge, only three papers explicitly include domestic investment as a potential determinant of FDI. Harrison and Revenga (1995) include domestic invest-ment as an explanatory variable in a research on trade policy liberalisation impact. hey ind that compared with the size of the local market and openness to trade, domestic investment has no impact on FDI. his result is probably due to the heterogeneity of the sample, notably in terms of openness to FDI, during a period (1970-1992) when developing countries FDI policies were quite diverse. To the authors: the 1999 paper by McMillan should be cited here and included in the list of references. his conclusion, and apparent paradox – when local irms choose to invest more, foreign companies choose to invest less – result directly from the method chosen to measure domestic in-vestment: domestic investment = Gross ixed capital formation (GFCF) minus FDI. But FDI is a balance of payment data, not a National Account one. FDI does not translate
3 Such discordance may appear because of a very particular context, as in the case of of-shore investments
nor immediately neither systematically into real capital formation in the host country. For instance, the acquisition of a local company by a foreign investor is a transfer of assets. It will result in a capital inlow, noticed in the balance of payment, but it will not increase capital formation in the country. Moreover, FDI lows are much more unstable than GFCF. As a result, FDI variation will largely determine the change of the proxy used to measure domestic investment [-FDI + GFCF], and the relationship between those two variables will always be negative. In a very creative paper on Sub-Saharan Africa, Ndikumana and Verick (2008) investigate whether domestic investment promotes FDI and is in its turn afected by FDI. heir study cover 38 African countries from 1970 to 2005, and they separate private domestic investment and public domestic investment, thanks to a World Bank database on Africa. heir conclusion goes in the opposite di-rection. heir results indicate that the relationship between FDI and domestic invest-ment run both way. But the positive impact of domestic investinvest-ment on FDI, especially in the case of private investment, is stronger and more robust that the reverse relation. Public domestic investment also has a positive inluence on FDI inlows.
3.3. WHY WOULD FDI FOLLOW DOMESTIC INVESTMENT? THEORETICAL ARGUMENTS
In theory, there appear to be several ways in which domestic investment might inluence positively FDI. Two obvious channels are, irstly, agglomeration economies and pola-risation efects and, secondly, information asymmetry. he theory of MNC’s speciic advantage ofers an additional explanation.
Agglomeration efects and interirm externalities create linkages between domestic and foreign investors. Several studies based on an economic geography or an endogenous growth framework show that the stock of public infrastructure is a positive determinant of FDI inlows (Kinda, 2007). In an endogenous growth model, public capital stock increases production factors productivity and reduces transaction costs (Barro, 1990; Rieber, 1999). Infrastructure increases the return on investment and stimulates private investment. For example, Loree and Guisinger (1995) show that countries with more developed infrastructures receive a higher share of US FDI. Kumar (2001) obtains the same positive relationship in a study based on a 66 countries sample, as well as Asiedu (2001) in her research on FDI determinants in African countries. hus, the better the state of the host country infrastructure is, the more proitable the FDI is. herefore,
ceteris paribus, FDI follows increases in public domestic investment. In other words,
public investment leads FDI.
efects are found to be highly signiicant. As a consequence, the existing stock of FDI has a very positive inluence on new foreign investments, notably in developing coun-tries (Alaya et al., 2007; Hanson, 2001; Yehoue, 2005). Foreign investors may be in-luenced by the presence of other foreign irms for various reasons, including the gain from inter-irms externalities and the signal of proitability given by the success of the irst irms (Lim, 2001).
he positive attributes of previous public investment and foreign investment should also be important in the case of private domestic investments. An increase on domestic private investments, as a stock or as a low, contributes to reduce transaction costs, as well as increasing technology spreading or extending interirm division of labor. Most of the externalities and agglomeration efects produced by public or foreign investment can be generated by the domestic private sector as well. As a consequence, the deter-minants that explain the positive inluence of public investment or foreign investment stock on FDI inlows are also relevant in the case of private domestic investment. Pri-vate investment should also lead FDI.
herefore, we will use GFCF as a proxy, to estimate the inluence of domestic
in-vestment on FDI inlows. GFCF include public and private domestic inin-vestment4. hese
two types of investment increase the rate of return of new investment, and both can be expected to have a positive inluence on FDI.
A second type of linkage between domestic investment and FDI can be found in the concept of the irm’s speciic advantage, on which is based the modern theory of the multinational company and international investment. Initially proposed by Hymer (1976) and later taken up and developed further, notably by Dunning (1988, 1977) in his “eclectic paradigm”, the irm‘s speciic advantages are linked to market imperfec-tions and give the irm a competitive advantage over its rivals. he speciic advantage is a determinant of large companies’ investments abroad, because they give them the power to be competitive on foreign markets, despite the domestic irms’ advantages in terms of market knowledge, local linkages (Ietto Gillis, 2005; Muchielli, 1998). he ownership of such competitive assets (brand, scale, technology) is necessary for the FDI project to succeed. his analytical framework implicitly assumes that FDI follow domestic investments, because domestic investors have more accurate information about the local business climate than do foreign investors. As Graham and Krugman (1991) put it: “domestic irms have better knowledge and access to domestic markets; if a foreign irm decides to enter the market, it must compensate for the advantages enjoyed by domestic irms” (in Borenszstein et al., 1998). hus, the coherent sequence
4 GFCF includes private investment. In a market economy, it can be used as a proxy for private investment,
with the speciic advantage concept is when domestic investment leads foreign direct investment. he contrary (FDI before domestic investment), as well as the absence of any linkage (FDI without domestic investment), would be incongruous and conlicting with this framework. In fact, if they are no domestic competition and previous inves-tors on the host country market, foreign irms do not need any speciic advantage to be competitive; the theory of the multinational company speciic advantage falls down.
he modern theory of MNC is implicitly based on the hypothesis of a market-knowledge advantage of domestic irms. he foreign irm need to possess a “su-per power” to overcome the domestic competitors’ advantages due to their proximity and their experience of the local market, which allow them to identify and to react to new business opportunities faster and sooner5.
hirdly, McMillan (1998) suggests a close and more explicit link. She supposed that private domestic investors have better information about the local business climate than do foreign investors. When information is incomplete, domestic investment acts as a signal about the situation of the economy to foreign irms. hus we could expect to see domestic investment lead FDI. Ndikumana and Verick (2008) also use this “signal theory” to explain the inluence of private domestic investments on FDI. Higher level of private investment is seen as an indication of high returns to capital; it generates a signalling efect to foreign irms that stimulates FDI.
Last but not least, most of the literature on the determinants of FDI concludes to-wards the signiicant and positive role of market size. Hence, to the extent that domestic investment determines growth and/or market size, these studies indirectly consider do-mestic investment as a determinant of FDI. Furthermore, the market size has a positive inluence on FDI because this variable is a proxy for potential proits. In comparison, the level of domestic investment gives more accurate information on proit expecta-tions in the host country.
4. METHODOLOGY AND DATA
Since the purpose of this paper is to emphasize the efects of domestic investment on FDI inlows in developing countries, the study focuses on that, ignoring several commonly analyzed economic variables. However, we include other independent variables oten used in the literature to explain FDI inlows, with diferent interpretations for some of the variables. he choice of variables was constrained by data availability.
5 he “FDI before domestic investment” sequence is compatible with the Hymer-Dunning framework only
As is usual in the literature, the dependant variable is the ratio of net FDI lows to GDP. Technically, FDI have three components: equity capital, reinvested earnings or intracompany loans. FDI inlow may result in the creation of new economic assets in the host country (“greenield” investment) or in the transfer of domestically owned as-sets to a foreign investor. In the second case, M&A operation implies a transfer of asas-sets from domestic to foreign investors and does not increase, at least initially, the country capital stock. M&A in DC may oten be decided for diferent reasons than host coun-try economic attractiveness: privatization policies, fall of assets price due to a debt or a liquidity crisis, credit crunch. In such cases, no linkages should be expected between FDI and domestic investment. For those reasons, we distinguish the total inlow of FDI (FDI/GDP), which includes M&A, and (fresh or “net”) greenield investments by fo-reign irms (FDI-M&A/GDP). In the irst place, it seems more appropriate to use the second variable in our framework. However, M&A data are less homogeneous, notably because it is not possible to trace the origin of the funds used6.
he basic speciication for the model is therefore:
FDIit = a0 + a1 stGFCFit + a2FDIst it-1 + a3ICRG it + a’Xit + εit
where i indexes countries, t indexes time, stGFCFit measures the cumulated lows of Gross Fixed Capital Formation in the recent past, FDIst it-1 is the lagged FDI stock. ICRG it is a synthetic indicator of country risk, Xit is a vector of other variables that are oten considered as inluencing FDI. a0 iis a common ixed efect term and εit is the error term.
stGFCFit is the sum of the actualised value of domestic investment lows during
the previous ive years. We use Gross Fixed Capital Formation, which includes both private and public sector investment, because data on private domestic investment in DC are too limited. We use a ive year period because investment tends to be volatile. In a poor DC, a donor grant to inance new infrastructure or new equipment may in-crease considerably, but briely, the investment rate. A one year large variation of the investment rate may be explained by factors exogenous to the investment climate, as a dramatic recession or an unusually large investment. Generally such causes do not last. Our indicator is a compromise between the actualised value of the country capital stock, which is unavailable, and the investment low, which is too volatile.
It is calculated as:
stGFCFit = [(GFCF/GDP)it-1 .0.8]+ [(GFCF/GDP)it-2 .0.82]+[(GFCF/GDP)it-3 .0.83] + [(GFCF/GDP) it-4 .0.84] + [(GFCF/GDP) it-5 .0.85].
his variable is appropriate with MNC decision process and with an imperfect in-formation environment : we expect the recent past to inluence current FDI lows, be-cause MNC investment strategies are planned and implemented not annually but on a
multiannual time period; information on favourable investment opportunities become more convincing when they have been conirmed for several years, but their impact does not last and information becomes rapidly outdated, which explains the choice of a high actualization rate (20%).
FDIst it-1 is calculated as the ratio of the stock of FDI on GDP for the preceding year. We expect FDI inlows to have a large correlation with the stock of FDI, whi-ch captures both the attraction of new FDI to countries with existing investments (agglomeration efects increase the proitability of new investments) and reinvested proits of MNC returning as FDI inlows to the receiving country (Alaya, 2007; Lim, 2001; Hanson, 2001).
ICRG it is a synthetic indicator of country risk provided on an annual basis since 1984. It comprises 22 variables in three subcategories of risk: political, inancial, and economic. his composite index ranges from 0 to 100, the latter corresponding to the lowest possible risk. We expect the ICRG index to be positively related to FDI inlows.
As highlighted above, the literature on FDI has focused on other key determinants. Our empirical speciication therefore includes additional variables. LGDPit is the log of the country GDP. LGDPcit is the log of the country GDP per capita in constant 2000 $. It captures the level of economic development of the country and its productivity, as well as the sophistication of the domestic demand, and it should have a positive in-luence on FDI. However, GDPc is oten used as a proxy for real wages. In the literature, the relationship between GDP per capita and FDI is not unanimous. he availability of natural resources is oten supposed to inluence MNC investments. As an opposite proxy for this economic specialisation, we used MXit the ratio of manufactured exports on total exports. It increases with the country’s level of industrialization and decreases when the country specialises on primary products. Its inluence on FDI inlows will depend on the type of investment. When FDI follow “resource-seeking strategies”, pri-mary specialisation (i.e., low level of MXit) will have a positive inluence on investment inlows. GROit-1 is the GDP growth rate of the preceding year. It is expected to have a possible positive impact on FDI, mainly through a disincentive efect when growth is too weak. TAXit stands for iscal revenue on GDP (in %), and is a proxy of the global tax rate applied to the private sector. INFit is the consumer prices annual change. In a preliminary step, we included trade openness (export+import/GDP) and the stock of education (from the Barro-Lee database), but these two variables had no signiicant efect (results not reported here).
policies during the period. he data on FDI are collected from the World Investment Report database provided by the United Nations, and most other data used in the mo-del are taken from the World Bank “World Development Indicators” database. ICRG values since 1984 come from the Prsgroup.
In the results presented below, we control for various usual pitfalls. Hence, outliers have been withdrawn and we checked that our data do not present either multicorre-linearity (variance inlation factors have been calculated) or heteroscedascity (White test). However, as expected since we are using time series, the error terms cannot be assumed as independent. hey are auto-correlated (Durbin-Watson test). herefore, we estimate linear regression model with autoregressive errors (AUTOREG procedure from SAS sotware). he correlation matrix of all the variables used in the equations indicates no serious problem, except in one case, where the correlation coeicient of LGDP and LGDPc is 0.62.
Another problem with assessing the efects of domestic investment on FDI inlows is endogeneity. For instance, omitted factors could have a positive impact simultaneou-sly on domestic investment and FDI, because both variables are a signal of economic performance. Although, in principle, the endogeneity problem can be avoided by ap-plying instrumental variable techniques, the fundamental problem is that there are no ideal instruments available. To deal with this issue, McMillan (1999) deines domestic investment as “net” domestic investment: (GFCF - FDI)it. his methodology drives her to a paradox: a negative relationship between domestic investment and FDI. In other words, the main linkage is investment substitution: when the domestic irms increase their investment on a host market, MNC decide to reduce theirs. However this
conclu-sion results from the ex-ante measure of domestic investment. he link between FDIit
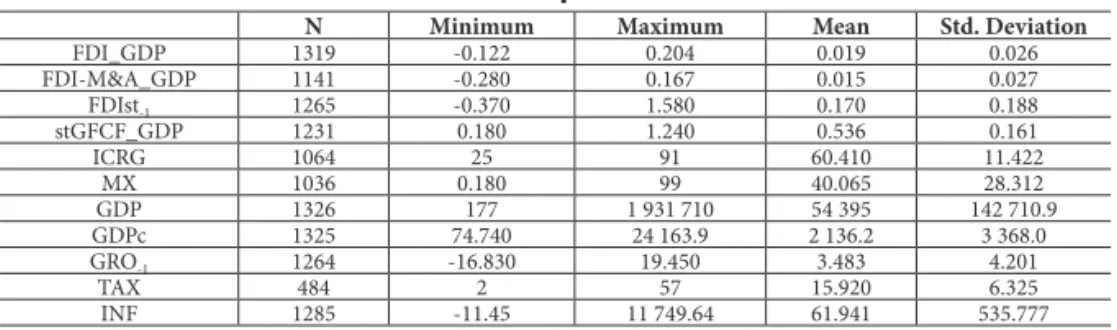
Table 2 – Descriptive statistics
N Minimum Maximum Mean Std. Deviation
FDI_GDP 1319 -0.122 0.204 0.019 0.026
FDI-M&A_GDP 1141 -0.280 0.167 0.015 0.027
FDIst-1 1265 -0.370 1.580 0.170 0.188
stGFCF_GDP 1231 0.180 1.240 0.536 0.161
ICRG 1064 25 91 60.410 11.422
MX 1036 0.180 99 40.065 28.312
GDP 1326 177 1 931 710 54 395 142 710.9
GDPc 1325 74.740 24 163.9 2 136.2 3 368.0
GRO-1 1264 -16.830 19.450 3.483 4.201
TAX 484 2 57 15.920 6.325
INF 1285 -11.45 11 749.64 61.941 535.777
Source: Authors’ elaboration.
5. EMPIRICAL RESULTS
In this section, we irst present the results of OLS regressions for all the countries in the sample. Secondly, we split the sample according to three criteria, in order to create more homogeneous country groups, and we compare the results for those di-ferent subsamples.
5.1. RESULTS FOR ALL THE COUNTRIES IN THE SAMPLE
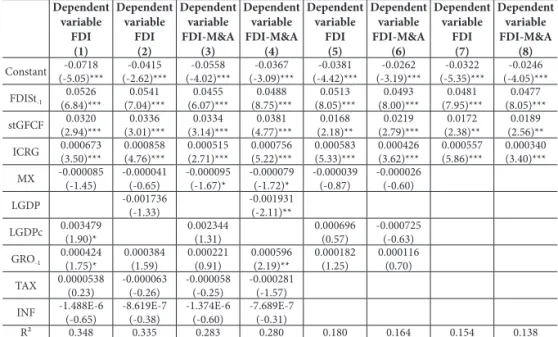
he results of the regression for all (developing) countries in the sample are reported in Table 3. Speciications (1) to (4) refer to the basic model. From speciication (5), we progressively exclude non-signiicant variables. Speciications (7) and (8) refer only to the core variables.
Table 3 - Impact of domestic investment on FDI inflow, 1984-2004 (all developing countries)
Dependent variable FDI (1) Dependent variable FDI (2) Dependent variable FDI-M&A (3) Dependent variable FDI-M&A (4) Dependent variable FDI (5) Dependent variable FDI-M&A (6) Dependent variable FDI (7) Dependent variable FDI-M&A (8) Constant (-5.05)***-0.0718 (-2.62)***-0.0415 (-4.02)***-0.0558 (-3.09)***-0.0367 (-4.42)***-0.0381 (-3.19)***-0.0262 (-5.35)***-0.0322 (-4.05)***-0.0246
FDISt-1 0.0526 (6.84)*** 0.0541 (7.04)*** 0.0455 (6.07)*** 0.0488 (8.75)*** 0.0513 (8.05)*** 0.0493 (8.00)*** 0.0481 (7.95)*** 0.0477 (8.05)*** stGFCF (2.94)***0.0320 (3.01)***0.0336 (3.14)***0.0334 (4.77)***0.0381 (2.18)**0.0168 (2.79)***0.0219 (2.38)**0.0172 (2.56)**0.0189
ICRG 0.000673(3.50)*** 0.000858(4.76)*** 0.000515(2.71)*** (5.22)***0.000756 0.000583(5.33)*** 0.000426(3.62)*** 0.000557(5.86)*** 0.000340(3.40)***
MX -0.000085(-1.45) -0.000041(-0.65) -0.000095(-1.67)* -0.000079(-1.72)* -0.000039(-0.87) -0.000026(-0.60)
LGDP -0.001736(-1.33) -0.001931(-2.11)**
LGDPc 0.003479(1.90)* 0.002344(1.31) 0.000696(0.57) -0.000725(-0.63)
GRO-1 0.000424 (1.75)* 0.000384 (1.59) 0.000221 (0.91) 0.000596 (2.19)** 0.000182 (1.25) 0.000116 (0.70) TAX 0.0000538(0.23) -0.000063(-0.26) -0.000058(-0.25) -0.000281(-1.57)
INF -1.488E-6(-0.65) -8.619E-7(-0.38) -1.374E-6(-0.60) -7.689E-7(-0.31)
R² 0.348 0.335 0.283 0.280 0.180 0.164 0.154 0.138
Notes: (***) Signiicant at the 1% level. (**) Signiicant at the 5% level. (*) Signiicant at the 10% level. t values
are in brackets.
Source: Authors’ elaboration.
5.2. THE CASE OF RESOURCE-POOR COUNTRIES
Securing the supply of raw materials and other natural resources has been acknowled-ged as an important objective of MNC, since the earliest works on international invest-ment in the case of such resource-seeking or rent-seeking FDI, no correlation is to be expected with the domestic investment. FDI inlows are driven by speciic factors in resource-rich countries. Furthermore, the literature on the Dutch-disease and on the resource “curse” shows that natural resources abundance rarely stimulates domestic in-vestment. To exclude this kind of economic structure and such type of FDI incentives from our sample, we introduce here an export structure threshold: we classify countries where manufactured exports account for less than 25% of total exports (MX<25%) as resource-rich economies.
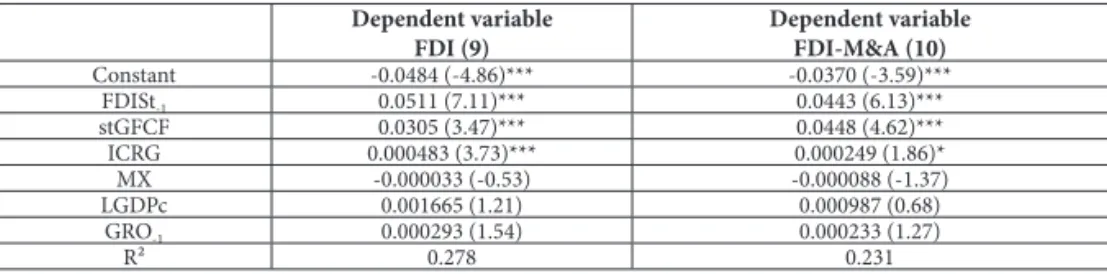
A 1% increase in stGFCF as a percent of GDP is followed by a 0.045% increase in future net FDI (FDI-M&A) as a percent of GDP. By construction, stGFCF is 2.7 times higher than GFCF/GDP (if the investment rate is stable). hus, the previous coeicient means that, on average, a 1% increase of the domestic investment rate in the previous ive years will increase the current FDI ratio by 0.12 %. his variation is signiicant since the mean of the ratio FDI/GDP in our sample is 1.8 %, and the mean of the ratio (FDI-M&A)/GDP is 1.5%.
Table 4 - Impact of domestic investment on FDI inflow, 1984-2004 (MX > 25%)
Dependent variable FDI (9)
Dependent variable FDI-M&A (10)
Constant -0.0484 (-4.86)*** -0.0370 (-3.59)***
FDISt-1 0.0511 (7.11)*** 0.0443 (6.13)***
stGFCF 0.0305 (3.47)*** 0.0448 (4.62)***
ICRG 0.000483 (3.73)*** 0.000249 (1.86)*
MX -0.000033 (-0.53) -0.000088 (-1.37)
LGDPc 0.001665 (1.21) 0.000987 (0.68)
GRO-1 0.000293 (1.54) 0.000233 (1.27)
R² 0.278 0.231
Notes: (***) Signiicant at the 1% level. (**) Signiicant at the 5% level. (*) Signiicant at the 10% level. t values are in brackets.
Source: Authors’ elaboration.
5.3. THE CASE OF NON-POOR DEVELOPING COUNTRIES
A second speciic feature of developing economies can inluence negatively FDI in-lows. Ceteris paribus, a poverty-trap, or a high level of poverty in a country, will dis-courage MNC investments. While business and proit opportunities still arise in very poor countries, they are less easy to identify by foreign investors, because they may be isolated on heterogeneous niche-markets, which are diicult or too costly to penetrate. Institutional deiciencies oten contribute to reduce further market access for foreig-ners. hus we formulate the hypothesis that host country domestic investment may stimulate FDI inlow once the country has escaped from poverty, i.e., per capita reach $1500 (constant 2000).
Table 5 shows the regressions for this subsample of “non-poor” developing countries, where GDPc is higher than 1500$. stGFCF is still highly signiicant and its coeicient increases when compared to the whole sample. he inluence of past domestic invest-ment trend is strong. On average a 1% increase in GFCF/GDP in the previous ive years increases current FDI/ GDP by 0.1%, and “net” FDI/GDP by 0.14%.
Table 5 - Impact of domestic investment on FDI inflow, 1984-2004 (GDPc > $1500)
Dependent variable FDI (11)
Dependent variable FDI-M&A (12)
Constant -0.1078 (-4.50)*** -0.1084 (-4.86)***
FDISt-1 0.0441 (5.09)*** 0.0359 (4.47)***
stGFCF 0.0385 (3.55)*** 0.0528 (4.92)***
ICRG 0.000700 (4.06)*** 0.000508 (2.93)***
MX -0.000093 (-1.29) -0.000090 (-1.33)
LGDPc 0.007120 (2.40)** 0.007064 (2.55)**
GRO-1 0.0000824 (0.36) 0.0000201 (0.09)
R² 0.241 0.252
Notes: (***) Signiicant at the 1% level. (**) Signiicant at the 5% level. (*) Signiicant at the 10% level. t values are in brackets.
Source: Authors’ elaboration.
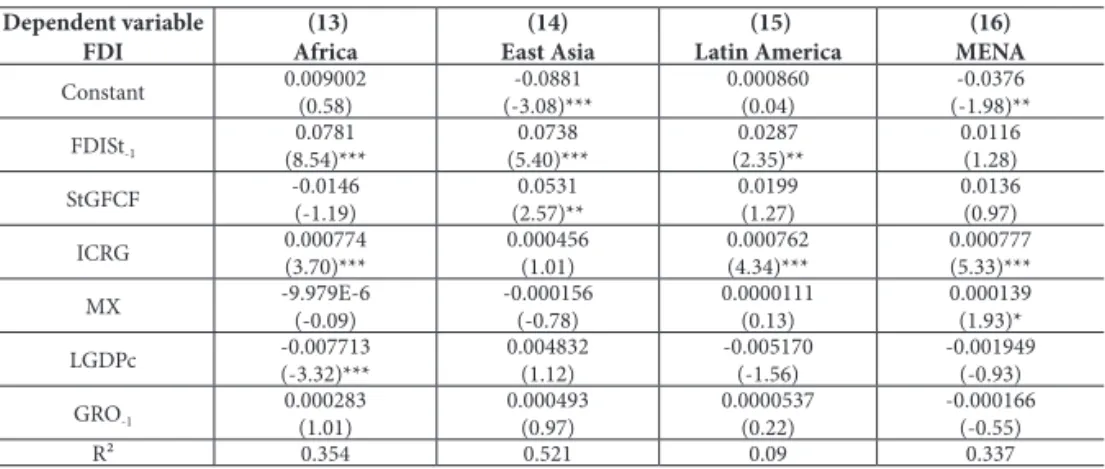
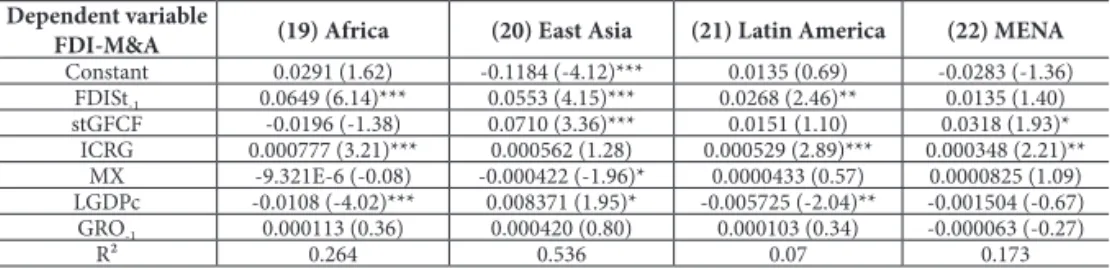
5.4. REGIONAL TRENDS
Next, in tables 6a and 6b we divide the developing world into four main regions: (Sub-Saharan) Africa; East Asia; Latin America; Middle East and North Africa (MENA). he R² increases, indicating the importance of regional efect, except in Latin America. Yet domestic investment remains signiicant only in East Asia. his weaker link in other developing regions suggests that other determinants interfere. he conclusion that “Africa is diferent” (Asiedu, 2001) tends to be conirmed by our results, which implies that, in Africa, MNC invest more in countries well kno-wn (FDIst is statistically signiicant), stable and poor!
Nevertheless, the linkage between domestic and foreign investment in East Asia is im-pressive. Speciications (14) and (20) show that a large share of the variation in FDI rate can be explained by a small number of factors and that stGFCF is statistically very signiicant in East Asia. he strongest efect of domestic investment on FDI is found in East Asia. An increase of 1% of the average GFCF/GDP rate raises the “net” FDI/GDP ratio by about 0.2%!
Table 6 - Impact of domestic investment on FDI inflow (FDI) by region, 1984-2004
Dependent variable FDI (13) Africa (14) East Asia (15) Latin America (16) MENA
Constant 0.009002(0.58) (-3.08)***-0.0881 0.000860(0.04) (-1.98)**-0.0376
FDISt-1 0.0781 (8.54)*** 0.0738 (5.40)*** 0.0287 (2.35)** 0.0116 (1.28)
StGFCF -0.0146(-1.19) (2.57)**0.0531 0.0199(1.27) 0.0136(0.97)
ICRG 0.000774(3.70)*** 0.000456(1.01) 0.000762(4.34)*** 0.000777(5.33)***
MX -9.979E-6(-0.09) -0.000156(-0.78) 0.0000111(0.13) 0.000139(1.93)*
LGDPc -0.007713(-3.32)*** 0.004832(1.12) -0.005170(-1.56) -0.001949(-0.93)
GRO-1 0.000283 (1.01) 0.000493 (0.97) 0.0000537 (0.22) -0.000166 (-0.55)
R² 0.354 0.521 0.09 0.337
Notes: (***) Signiicant at the 1% level. (**) Signiicant at the 5% level. (*) Signiicant at the 10% level. t values are in brackets.
Table 6b - Impact of domestic investment on FDI inflow (FDI-M&A) by region, 1984-2004
Dependent variable
FDI-M&A (19) Africa (20) East Asia (21) Latin America (22) MENA
Constant 0.0291 (1.62) -0.1184 (-4.12)*** 0.0135 (0.69) -0.0283 (-1.36)
FDISt-1 0.0649 (6.14)*** 0.0553 (4.15)*** 0.0268 (2.46)** 0.0135 (1.40)
stGFCF -0.0196 (-1.38) 0.0710 (3.36)*** 0.0151 (1.10) 0.0318 (1.93)*
ICRG 0.000777 (3.21)*** 0.000562 (1.28) 0.000529 (2.89)*** 0.000348 (2.21)**
MX -9.321E-6 (-0.08) -0.000422 (-1.96)* 0.0000433 (0.57) 0.0000825 (1.09)
LGDPc -0.0108 (-4.02)*** 0.008371 (1.95)* -0.005725 (-2.04)** -0.001504 (-0.67)
GRO-1 0.000113 (0.36) 0.000420 (0.80) 0.000103 (0.34) -0.000063 (-0.27)
R² 0.264 0.536 0.07 0.173
Notes: (***) Signiicant at the 1% level. (**) Signiicant at the 5% level. (*) Signiicant at the 10% level. t values are in brackets.
Source: Authors’ elaboration.
6. CONCLUSION
his paper investigates the impact of domestic investment on FDI in developing coun-tries using a large cross-country sample for the period 1984–2004. he literature has provided numerous studies on the efects of FDI on growth and investment in host country, but the relationship between FDI and domestic investment is bidirectional. Yet very little is known about how domestic investment itself afects FDI inlows. he understanding of the linkages between domestic investment and FDI is a key to unders-tand the determinants of countries international attractiveness, which helps in turn to select the policy levers that may be activated to increase both FDI inlows and econo-mic performance in the host country. his paper attempts to contribute to ill this gap. he empirical results obtained in this paper show, irst, a strong inluence of previous domestic investments on foreign investors. Evidence from annual data for 68 develo-ping countries suggests that lagged domestic investment has a quantitatively signiicant impact on FDI inlows in the host economy. his impact is strongest when countries move away from underdevelopment level. For instance, for DC with a GDP per capita above 1500$, a one percent increase in domestic investment, as a percent of GDP, rises FDI as a percent of GDP by as much as 0.1%. Furthermore, the correlation coeicient increases when total FDI is replaced by greenield or “net” FDI as the dependant varia-ble. In the former subsample, the same variation of the domestic investment rate rises (FDI-M&A)/GDP by 0.14%. In summary, we can conclude that domestic investment is a strong catalyst for FDI in DC; domestic investment appears to be a good predictor for future foreign investment inlow.
centripetal. he direction of causality goes from the country economic attractiveness, appreciated by its rate of investment, to the FDI inlow, and it does not follow a “centre to the periphery” route. his inding reveals one of the bases of development strategy, before its dissolution in the Washington consensus. he mode of entry of a country in the world economy rests upon its internal dynamic, that can be appreciated by its rate of investment (Amsden, 2001; Bradford, 1993; Judet, 1986; Rodrik, 2009, 1999).
hird, the policy implications of this study are straightforward. Our results show that the promotion of domestic irms investment will lead to more FDI inlows. Developing countries will beneit from measures aimed at encouraging domestic investment, and a better investment performance will eiciently stimulate FDI. he evidence suggests notably that industrial policy, aimed at enhancing the proitability and the scope of domestic investments, will be efective to increase FDI inlows in the country as well7.
Many countries are actively trying to attract foreign investors with various incen-tives and subsidies. he competition between governments to attract FDI tend to shit proits and welfare from the host countries to foreign multinationals, while empirical research shows that international investment incentives play only a marginal role in de-termining the international pattern of FDI (Blomstrom and Kokko, 2000; Oman, 2000). hus, a more eicient policy choice would be to transfer the pro-FDI incentives budget to industrial policy, or any kind of domestic investment promotion measures, that will stimulate domestic irms’ investment.
Finally, this study conirms that a FDI attraction policy cannot serve as a develop-ment strategy, because FDI lows are directed towards developing countries which have already a strong investment rate! Of course causality between those two variables runs in both directions. However, it is important to underline that, ceteris paribus, FDI lows where there is already a dynamic process of economic development. hus, our results suggest that MNC follow economic development.
In other words, the irst “developmental convention” (Erber, 2009), which focused on changing the productive structure by promoting manufacturing investment, has remained quite efective to achieve both structural change and FDI attraction.
REFERENCES
AGOSIN, M. R.; MACHADO, R. FDI in developing countries: does it crowd in domestic investment. Oxford Development Studies, v. 33, n. 2, p. 149-162, 2005.
AGOSIN M. R.; MAYER, T. Foreign direct investment in developing countries: does it crowd in domestic investment. UNCTAD Working Paper, UNCTAD, n. 146, February, 2000.
ALAYA, M.; NICET-CHENAF, D.; ROUGIER, E. Politique d’attractivité des IDE et dynamique de croissance et de convergence dans les Pays du Sud Est de la Méditerranée. Cahiers du GREhA, n. 2007–06, 2007.
ASIEDU, E. On the determinants of FDI to developing countries: is Africa diferent. World Development, v. 30, n. 1, 2001.
BENASSY-QUERE, A.; COUPET, M.; MAYER, T. Institutional determinants of foreign direct investment. CEPII Working Paper, April, 2005.
BLOMSTROM, M.; KOKKO, A. he Economics of foreign direct investment incentives. Working paper, Stockholm School of Economics, n. 168, January, 2003.
BLOMSTROM, M.; KOKKO, A. Foreign direct investment, irm and host countries strategies. New York: MacMillan, 2000.
BORENSZTEIN, E.; DE GREGORIO, J.; LEE, J-W. How does foreign direct investment afect economic growth. Journal of International Economics, v. 45, 1998.
BOSWORTH, B.; COLLINS, S. M. Capital lows to developing economies: implications for saving and investment. Brookings Papers on Economic Activity, n. 1, 1999.
CAVES, R. E. Multinational enterprise and economic analysis. 2 ed. New York: Cambridge University Press, 1996.
CHAKRABATI, A. he determinants of foreign direct investment: sensitivity analysis of cross-countries regression. Kyklos, v. 54, n. 1, 2001.
CHOWDHURY, A.; MAVROTAS, G. FDI and growth: a causal relationship. WIDER Research Paper, n. 25, 2005.
DUNNING, J. H. he determinants of international production. Oxford Economic Papers, n. 3, 1973.
DUNNING, J. H. Explaining international production. London: Unwin Hyman, 1988.
DUNNING, J. H. “he changing geography of foreign direct investment: Explanations and implications”. In: KUMAR, N. (Ed.) Globalization, foreign direct investment and technology transfers: Impact on and prospects for developing countries. London: Routledge, 1998
DE MELLO, L. R. Foreign Direct investment-led growth: evidence from time series and panel data. Oxford Economic Papers, v. 51, 1999.
ERBER, F. he evolution of development conventions. La lettre du CEPN, n. 4, Novembre, 2008
ERBER, F. Development conventions: the political economy of development theory. Rio de Janeiro: IE-UFRJ, 2009, mimeo.
FINDLAY, R. Relative backwardness, direct foreign investment and transfer of technology. Quarterly Journal of Economics, n. 92, 1978.
FONTAGNE, L.; MAYER, T. Les choix de localisation des entreprises. Paris: CEPII, Éditions La Découverte, 2005.
GASTANAVA, V. M.; NUGENT, J. B.; PASHAMOVA, B. Host country reforms and FDI inlows: How much diference do they make? World Development, v. 26, n. 7, 1998.
HARRISON, A.; REVENGA, A. he efects of trade policy reform: what we really know? NBER Working Paper, n. 5225, August, 1995.
HEAD, C. K.; RIES, J. C.; SWENSON, D. L. Attracting foreign manufacturing: investment promotion and agglomeration. Regional Science and Urban Economics, n. 29, 1999.
IETTO GILLIS, G. Transnational corporations and international production. London: Edward Elgar, 2005.
KINDA, T. Accroître les lux de capitaux privés vers les pays en développement: Le rôle des infrastructures physiques et inancières. In: ColloqueAFSE, Paris, September, 2008.
KUMAR, N.; PRADHAN, J. P. FDI, externalities and growth in developing countries: some empirical explorations and implications for WTO negotiations on investment. RIS Discussion Paper, n. 27, 2002.
KAWAGUCHI, O. Foreign Direct Investment in East Asia: Trends, determinants and policy im-plications. Internal Discussion Paper, World Bank, 1994.
LEVASSEUR, S. Investissements directs étrangers et stratégies des enterprises multinationales. Revue de l’OFCE, Hors-série La mondialisation et l’Europe, March, 2002.
LI, X.; LIU, X. Foreign direct investment and economic growth: an increasingly endogenous relationship. World Development, v. 33, n. 3, p. 393–407, 2005.
LIM, D. W. Determinants of and the relation between FDI and growth: a summary of the recent literature. IMFWorking Paper, n. 01/175, 2001.
LIPSEY, R. E. Inward FDI and economic growth in DCs. Transnational Corporations, v. 9, n. 1, 2000.
MACMILLAN, M. Foreign direct investment: leader of follower?Discussion Paper, Tuts University, n. 99-01, 1999.
LOREE, D. W.; GUISINGER, S. E. Policy and non-policy determinants of U.S. equity foreign direct investment. Journal of International Business Studies, v. 26, n. 2, p. 281-299, 1995.
MARKUSEN, J. R.; VENABLES, A. J. Foreign direct investment as a catalyst for industrial development. European Economic Review, v. 43, 1999.
MÉON, P. G.; SEKKAT, K. Does the quality of institutions limit the MENA’s integration in the world economy. he World Economy, v. 27, n. 9, 2004.
MODY, A.; DASGUPTA, S. Japanese multinationals in Asia: drivers and attractors. Oxford Development Studies, v. 27, n. 2, 1998.
MOOSA, I. A.; CARDAK, B. A. he determinants of foreign direct investment: an extreme bound analysis. Journal of Multinational Financial Management, v. 16, p. 199-211, 2005.
NDIKUMANA, L.; VERICK, S. he linkages between FDI and domestic investment: unravelling the developmental impact of foreign investment in Sub-Saharan Africa. Development Policy Review, v. 26, n. 6, 2008.
NUNNENKAMP, P.; SPATZ, J. Foreign Direct Investment and economic growth in developing country: How relevant are host-country and industry characteristics? Kiel Working Paper, n. 1176, July, 2003.
ORGANISATION FOR ECONOMIC COOPERATION AND DEVELOPMENT (OECD). Foreign investment for development, maximising beneits, minimising costs. Paris: OCDE, 2002.
OMAN, C. Quelles politiques pour attirer les investissements étrangers: Une étude de la concurrence entre gouvernements. Paris: OCDE, 2000.
RODRIK, D. he globalisation paradox. Oxford, New York: Oxford University Press, 2011.
RODRIK, D. Can integration into the world economy substitute for a development strategy? In: World Bank’s ABCDE Conference, Paris, Juin, 2000.
RODRIK, D. he new global economy and developing countries: making openness work. London: ODC, 1999.
SAHIN, S.; SENER, O. Assessment of foreign direct investment attractiveness: an analytic hierarchy process approach. In: Bridging the gap: the role of trade and FDI in the Mediterranean, Naples, June, 2006.
SEKKAT, K. (Org.) FDI inlows to the MENA Region: An empirical assessment of their determinant and impact on Development.Rapport Femise FEM 21-15, August, 2004.
SIEBERT, H. he World Economy. London: Routledge, 1999.