Rev. Econ. Contemp., Rio de Janeiro, v. 16, n. 2, p. 287-315, mai-ago/2012 287
COMPONENTS? THE RECENT SPURT IN HIGH
TECH INDUSTRY*
Marcelo José Braga Nonnenberg
aAllan Mesentier
bABSTRACT: he purpose of this paper is to evaluate to which degree China is climbing
up the technology ladder and increasing its domestic content in high tech industry. More speciically, we will assess whether China has increased its share in world trade of high tech goods and, at the same time, increased its domestic content, changing its role from a mere inal assembler to a producer of more intense technology goods. We have built an indicator of domestic value added calculated as the diference between exports of inal goods and imports of its parts and components. he main conclusion is that this measure has increased signiicantly since the early 1990ís, putting in evidence the pro-found changes that occurred in Chinaís high tech exports in the last two decades
KEYWORDS: External trade; innovation; China; production fragmentation.
JEL CLASSIFICATION: F14; O33.
* Artigo recebido em 04/05/2012 e aprovado em 06/08/2012.
a Doutor em Economia pela Universidade Federal do Rio de Janeiro (UFRJ) e técnico de planejamento e
pes-quisa do Instituto de Pespes-quisa Econômica Aplicada (IPEA). Contato: [email protected].
b Economista e estudante do mestrado em Economia do Instituto de Economia da UFRJ. Contato:
A CHINA É APENAS UMA MONTADORA DE PARTES E
COMPONENTES? O CRESCIMENTO RECENTE DA INDÚSTRIA
DE ALTA TECNOLOGIA
RESUMO: O objetivo deste artigo é avaliar até que ponto a China vem evoluindo ao
longo da cadeia tecnológica e aumentando o conteúdo doméstico de sua indústria de alta tecnologia. Especiicamente, será avaliado se a China aumentou sua participação no comércio mundial de bens relativamente intensivos em tecnologia e, ao mesmo tempo, elevou seu conteúdo doméstico, transformando seu papel de mero montador de bens inais para o de produtor de bens mais intensivos em tecnologia. Foi construído um in-dicador de valor doméstico agregado calculado como a diferença entre as exportações de bens inais e as importações de partes e componentes. A conclusão principal é que esse indicador elevou-se signiicativamente desde o início da década de 1990, pondo em evidência as profundas modiicações operadas nas exportações chinesas nas duas últimas décadas.
1. INTRODUCTION
Despite its fantastic economic growth in the last three decades, especially in the manu-facturing industry, China is sometimes considered as just a inal assembler in the more technology intensive goods, thanks to its low labor cost. According to this view, value added at home in these industries is still very low and the domestic innovation content still weak, compared to other Asian countries, like South Korea or Taiwan.
Does it really matter to be only a inal assembler? Many people still believe that innovation must be an in-house process, with key components developed and built in an integrated process. And developing countries, although incorporated in the manu-facturing process of a wide range of high tech goods, are not yet responsible for the in-novation process or for the production of core parts and components. Srholec (2007), using data for 111 countries and for electronic goods, inds that developing economies attract some “fragments of global production networks in electronics, while technology intensive activities remain concentrated elsewhere” (op.cit., p. 218).
But this picture has evolved in the last years. Product and process development and manufacturing are spread into many countries and irms. Within this new global cor-porate network, what really matters is to control some core competences. Which can be in designing, logistics, retail networks etc.
Nevertheless, within national boundaries, it is important that domestic irms evolve through the technology ladder in order to capture the beneits of innovation. In this case, a irm that only makes inal assembling of parts and components is har-dly seen as a good candidate for capturing these beneits. So, at the end of the day, product and process innovation remain a key factor to achieve a fast and sustainable economic growth.
No one disputes the fact that Chinese labor cost is still very low by international standards and this has been one of the main determinants of economic growth in Chi-na in the last 35 years. But is ChiChi-na recent growth in manufacturing still so dependent on low cost labor or has China made a signiicant efort in innovation in the last years that allowed her to watch a progressive advance in domestic production of technology intensive goods, increasing domestic value added?
1 In some cases, the four digit level was enough.
2 We have chosen SITC. Revision 3 instead of other possible classiications, like Harmonized System in
or-der to stick to United Nations Conference on Trade and Development (UNCTAD) classiication of goods by technology intensity presented in Table 1 below.
Trade Solution (WITS) via COMTRADE at ive-digit1 level of Standard International Trade Classiication (SITC), rev. 32.
his paper is organized as follows. Section 2 presents a theoretical background for the internationalization and outsourcing of production. he methodological aspects and source of data are examined in section 3. he recent development of trade in high tech goods, with a special emphasis on Asian trade, is examined in section 4, while section 5 examines some important features of Chinese trade. Section 6 presents the main contribution of this paper, namely the analysis of the evolution of domestic value added of high tech goods in China.
2. THEORETICAL ASPECTS
Part of the recent literature on international trade and foreign direct investment sheds some light in the process of why China is increasing its domestic value added in high tech goods. On one side, we have the theory of fragmentation and, on the other, the theory of Global Production Networks (GPN).
he point of departure for these two theoretical strands is the fact that manufactu-ring production is even more spread between international borders and irm bounda-ries. Production of such disparate goods as garments, shoes, automobiles and TV sets is increasingly split in several countries and several irms, not necessarily close to each other. And this internationalization of production leads to increasing trade in parts and components worldwide, from manufactures of small components to inal assemblers. his new feature requires new theoretical background.
In the last 30 years, the acknowledgement of monopolistic competition and increa-sing returns brought a new light to the theory of international trade. his theory emer-ged ater the empirical work by Grubel and Lloyd (1975) about the importance of intra-industry trade and has been developed in papers like Helpman (1981) and Krugman (1980, 1979). Comparative advantage was not dead yet but contributed to the analysis of a decreasing share of global trade, based on relative factor endowments while the new geography theory explained the growing intra-industry trade.
multi-ple value-chains, from garments to shoes to electronics and unfolded in the theory of fragmentation of production (Jones et al., 2004; Jones and Kierzkowski, 2004a, 2004b; and Bonham et al., 2007).
Initially, fragmentation of production was the responsibility of multinational corpora-tions (MNCs) thanks to scale of operacorpora-tions and the need to master the necessary knowledge (Helleiner, 1981). In some industries, like automobiles, this remains true. Big corporations prefer to concentrate manufacturing of some parts and components in some countries and inal assembling in others. And production remains, for the most part, being made within irm boundaries and not outsourced to other irms and leads to intra-irm trade.
But in a growing number of industries, production of parts and components and even inal assembling is been outsourced to other irms, located mainly in Asia and, in second place, in Eastern Europe. his is happening in a large number of goods but is especially relevant in electronics.
What constitutes the main diferences of the “new geography theory” of increasing returns/monopolistic competition and fragmentation theory? According to Jones and Kierzkowski (2004a) it can be summarized as follows: First, consider two separate possi-bilities of production locations and production costs. One, IF (integrated irm) is when all production takes place in a single location. he other, OF (outsourced fragments), is when production takes place in more than one location (outsourced). It is assumed by convenience that production costs in OF are always lower than in IF because in sepa-rate locations “factor prices or factor productivities are for each fragment more suited to factor proportions in that fragment. Regions in which labor is relatively inexpensive are used for the more labor-intensive fragment” (Jones and Kierzkowski, 2004, p. 7).
Costs of production in IF must then be compared to costs in OF added to costs of transportation, communication and knowledge transfer (service links). he crucial aspect is which activity exhibits increasing returns to scale. In the irst case, increasing returns happen in production blocks, at the same time that service links have constant returns to scale. It is shown that in this case, ater a certain level of production, costs in IF are lower than in OF plus service links. So, increasing returns in production lead to agglomeration of production.
In the second case, production costs are constant to scale while service links exhibit increasing returns. In this case, ater a certain level of production, OF-plus costs are lower than IF, leading to fragmentation of production. Summarizing, depending on where happen increasing returns, production is integrated in one location, thanks to economies of scale or is fragmented in several locations, across the border, thanks to diferences in relative factor prices in diferent countries.
returns vanished from manufacturing production but that the reduction in these other costs has more than compensated them. Four factors have played a major role in this aspect (Jones et al., 2004; Bonham et al., 2007). First, comes separability or modularity of production stages. In most value chains, components may be used interchangeably in diferent production process, mainly in electronics.
Second, there is evidence of falling transports costs which beneits trade in parts and components and also inished goods, making it cheaper to split production worl-dwide. hird, barriers to trade have declined substantially during the last decades. According to data by TRAINS/UNCTAD (World Bank, 2010), tarifs from high inco-me countries for manufactured goods (classes 5-8) fell from a range of 3.9% – 8.5% in 1989 to a range of 1.6% 4.6% in 2010. Considering low and middle income countries, the fall is even more pronounced – from a range of 22.7% 33.3% in 1989 to 5.3% – 11.5% in 2010.
Finally, the reduction in communication costs, due to progress on internet and telecommunications in general, made it much easier and speedier to coordinate and monitor activities in separate locations.
he other literature refers to Global Production Networks (GPN). In the last 50 years a lot has been written about internationalization of production and MNCs. It is a well established fact that MNCs set production facilities in diferent locations for a variety of reasons3. But, until recently, production was essentially organized within irm boundaries. he novelty is that, in the last years, it is also organized trough markets. i.e. made by diferent irms. So each irm is responsible to one or several production pha-ses. We may say that fragmentation of production refers to the fact that production is a multi-country process, and GPN refers to it being a multi-irm process. his form of governance has received other names, more or less interchangeable, like global com-modity chains or global value chains (Gerei, 1999, 1994; Gerei et al., 2005) and also Global Flagship Networks (GFN) (Ernst 2005a, 2005b).
But what drives the creation of this network? Gerei et al. (2005) state that transac-tion cost economics explains why global productransac-tion is organized within irm boundaries or trough markets. hey try to build a theory of value chain governance based on three factors. he irst is complexity of information and knowledge transfer, specially of pro-duct and process speciications. he second is the degree to which this information and knowledge may be codiied and thus transmitted to partners. And inally, the capability of actual and potential suppliers to understand and adopt the required knowledge. If these three factors are classiied as high or low, eight possible combinations are allowed, from
which the authors retain only ive possible types of governance, namely: markets, modular value chains, relational value chains, captive value chains and hierarchies. From markets to hierarchies, the degree of coordination and power asymmetry increases.
Ernst and Kim (2001), on the other hand, consider that the main drivers of GPN formation are institutional change trough liberalization, information technology and competition. By the irst factor, they mean liberalization of trade, capital lows, FDI policies and privatization. As for the second, is the “rapid development and difusion of information and communication technology”. And the third refers to the fact that irms must now be competitive in major markets and in diferent countries, changing the determinants of irm organization and location. “No irm, not even a dominant market leader, can generate all the diferent capabilities internally that are necessary to cope with the requirements of global competition. Competitive success thus critically depends on a capacity to selectively source specialized capabilities outside the irm...” (op.cit., p. 6)
GPNs are organized as follows. At the top of the value chain, there is a lagship company, also called vendor, that detains some core competencies and proprietary assets in key areas. his irm coordinates and controls, in varying degrees, the whole production process. In most cases (but not all), the lagship company is responsible for the generation of knowledge and, in some cases and in varying degrees, for product development. Development (in some degree) and manufacturing are the tasks of local suppliers. Some authors make a division between higher tier suppliers and lower tier suppliers (Ernst 2005a; Ernst and Kim, 2001).
Higher tier suppliers have also capabilities in areas like designing review, proto-type building, pilot production and mass manufacturing. In many cases, they are also responsible for R&D and product development. Lower tier suppliers generally do not have proprietary assets and their advantage lies in low cost and speed of production, with tiny proit margins.
Hobday (1995) puts the development of GPN in historical perspective, especially in Asian countries, introducing the idea of latecomer irms, which are exactly the local suppliers. As deined by him, latecomer irm “faces two sets of competitive disadvanta-ges in attempting to compete in export markets. he irst is technological in character. [Ö] he second disadvantage concerns leading-edge markets and demanding users. [Ö] (T)he latecomer irm is dislocated from the mainstream international markets it wishes to supply” (op.cit., p. 1172).
refers to situations when the subcontractor is also responsible for product design but the brand remains a proprietary asset of the vendor.
Ernst (2005a) distinguishes between Contract Manufacturer (CM) and OEM. In this view, OEM “derives their market powers from selling global brands, regardless of whether design and production is done in-house or outsourced” (page 104). CM is the irm responsible mainly for mass production and supply chain services.
To make things more complicated, Dedrick et al. (2007) state that CM is an old name for small irms providing basically assembly services while ODM is a Taiwanese name for a CM that also ofers product engineering. OEM is an expression to be avoided because it has been used to designate global lagships (in car industry) but also CM in Taiwan. So, we consider that, to avoid all this confusion, we will refer only to lagship and supplier, when talking about GPNs.
3. METHODOLOGICAL ASPECTS
As stated before, our goal here is to evaluate to which degree China is climbing up the technology ladder and increasing the domestic content of her high tech exports. he hypothesis is that many irms in developed countries, including Taiwan and South Ko-rea, are increasingly outsourcing manufacturing and product development of high tech goods to China and, as a consequence, she is increasing innovation eforts leading to a greater production of parts and components for these goods.
Ideally, it would be necessary to obtain a direct measure of domestic value added in high tech production industry. However, an input-output matrix would be needed at a very disaggregated level. he problem is that this matrix is not available and it would be very diicult to build it for a country with poor statistics like China.
and components, domestic sales and imports of inal goods, not to mention imports and domestic production of the remaining inputs.
An important caveat refers to domestic market growth. Suppose that the export value of a particular good remains stable for some years and the share of imported parts and components is kept constant. At the same time, domestic sales of that good increase by a signiicant amount, causing imported inputs to grow. In this case, as ex-port value is constant while imex-port value of inputs grows, our measure for domestic value added will decrease.
It must be noticed that this methodology is in line with the recent WTO Made in the World Initiative launched in 2010, that points to the importance of measuring trade using value added (WTO and IDE-JETRO, 2011).
All data comes from WITS (World Bank, 2010) at Standard International Trade Classiication, rev. 34 at 5 digit level and the period under analysis is 1992-2009. At this level of disaggregation, export and import data is broken down between inal goods and parts thereof − only goods classiied in divisions 75, 76, 77, 79, 87 and 88. As mentioned above, it does not comprehend parts and other inputs classiied in other divisions. For instance, section 75 stands for Oice machines and automatic data-processing machi-nes. It is divided between 751 - Oice machines, 752 - Automatic data-processing ma-chines and units thereof; magnetic or optical readers, mama-chines for transcribing data onto data media in coded form and machines for processing such data, n.e.s. and 759 - Parts and accessories (other than covers, carrying cases and the like) suitable for use solely or principally with machines falling within groups 751 and 752. We have labeled 751+752 as inal goods and 759 as inputs. Sometimes data at 4 digit level is all we need, but so-metimes it is necessary to go to the 5 digit level.
Based on this methodology, it has not been possible to include every product at 4 or 5 digit level. In some cases, some goods were included as inal goods and others as their parts and components. But in other cases, this distinction was not possible, even at ive-digit level of SITC 3. (data at SITC rev. 4 is more disaggregated, but the series is much shorter). Some goods may be classiied as parts and components for many dife-rent other products, like diodes, transistors and similar semiconductor devices (7763). In other cases, like instruments and appliances for medical, surgical, dental or veteri-nary purposes (872), it was not possible to detect appropriate parts and components. In the great majority of cases, especially in more recent years, at least 75% of categories included as high tech goods could be classiied by means of this procedure. We call each set of inal goods/parts and components a pair.
Additionally, we have utilized a classiication of goods by technological intensity developed by UNCTAD plus a minor modiication, which is the disaggregation of sec-tion E on E1 and E2 as presented in Table 1. In this paper, we shall analyze exclusively goods classiied as E2 or high tech goods. In Annex 1 we present all goods at 3-digit level, according to SITC rev.3.
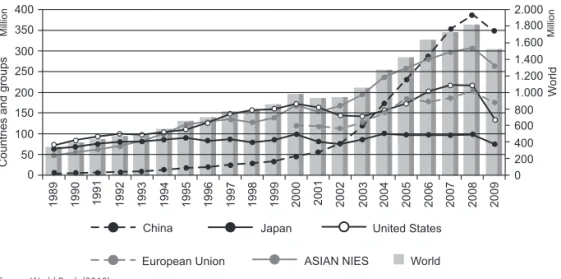
Figure 1 – World exports of high tech goods for selected countries and groups of countries (in US$ million)
Source: World Bank (2010).
Table 1 – Goods by technology intensity
A – Primary goods
B – Manufactured goods intensive in labor or natural resources C – Manufactured goods with low technology intensity D – Manufactured goods with medium technology intensity E1 – Manufactured goods with high technology intensity – chemicals
E2 – Manufactured goods with high technology intensity – electronics, aircrat and precision instruments F – Goods not classiied elsewhere
G1 – Goods not analyzed for insuiciency of data G2 – Fuels
Source: Author’s elaboration based on UNCTAD (2002).
4. RECENT CHANGES IN HIGH TECH TRADE
more impressive are the changes in its structure. As may be seen from Tables 1 and 2, non-Asian countries (especially United States and European Union) have seen their share decrease from 65% in 1990 to 49% in 2009, while Japan watched its ex-ports share decline from 18% to 5%. At the same time, developing Asia countries5 increased their overall exports ten-fold, from US$ 68,6 billion to US$ 689,9 billion in 2009, augmenting their share from 18% in 1990 to 46% in 2009. But this igure wouldnít be the same without China exports climbing from US$ 4,3 billion to US$ 347 billion at the same time.
hese changes relect, in large degree, the increase in intra-Asian trade in these goods. From 1990 to 2009, exports from ASEAN, Asian NIEs and China to these same countries jumped from US$ 18 billion to US$ 285 billion, or from 5% to 19% of global lows. And the change in East Asian trade is basically the result of the rise of Global Production Networks in high-tech industries. his movement started with developed countries like Japan, European Union and United States of-shoring production to the NIEs countries. But in the last twenty years, global companies outsourced increasing shares of their production (including more technology intensive production proces-ses) to developing Asian countries, thanks to the existence of relatively high-skilled workers with low reduction of trade and investment barriers and a decrease of trans-port costs.
Beginning in the nineties, countries like Hong Kong and Taiwan transferred parts of their value chain to mainland China, mostly inal assembly processes, intensive in non-skilled labor. For some years, multinational corporations (especially from Asian countries) exported parts and components to China only to be assembled and re-ex-ported to inal consumers.
his reorganization of the global production process was responsible to a signiicant part of international trade lows in high tech goods in the last 20 years.
As a consequence, developing Asia except China, exports to non-Asian countries increased slightly in relative terms during the nineties only to reduce their share in the next nine years. At the same time, Japanese exports decreased even in absolute numbers. Chinese exports, on the contrary, plummeted during all these years, but especially ater 2000. From almost zero in 1990, China reached 37% of Japanese imports and 19% of Other countries imports in 2009. Also remarkable is the increase in China–NIEs trade. While NIEs exports to China jumped from US$ 3,6 billion in 1990 to US$ 94,4 billion in 2009, Chinese exports to the NIEs climbed from US$ 3,7 billion to US$ 107.3 billion. In other words, the bulk of the increase in China imports during these years came from
5 Countries belonging to the Association of South-East Asian Nations (ASEAN) and the Newly
NIEs, in irst place, followed by Other (basically developed countries) and Japan. Me-anwhile, almost one third of Chinaís exports growth was directed to the NIEs.
Mostly, China–NIEs trade relects lows to and from Hong Kong and mainland China, that can be explained in large part by the fact that Hong Kong is today more a commercial than a manufacturing location. But a growing share of these bilateral lo-ws is also the result of trade between China and Taiwan. And as will be explained in more detail in the next section, China is increasing its share in the manufacturing of intermediate goods in high tech goods. In other words, China is less and less a mere inal assembler of high tech goods on its inal stages of production, to become a pro-ducer of its parts and accessories, bringing as a consequence an increase in its domes-tic value added. his process could only be the result of large eforts in innovation and labor qualiication.
In the present paper, as already explained, high tech goods means electronics, air-crat, precision instruments and photographic and optical goods. From China point of view, the most relevant ones are oice and data processing machines and its parts and telecommunication and sound recording and reproducing equipment (which includes TV receivers and telephone sets).
So, the remainder of this section will focus on trade lows in these two value chains. Letís start with oice and data processing machines. In terms of SITC3, these goods represent chapter 75 (Oice machines and automatic data-processing machines) split into 751 (Oice machines), 752 (Automatic data-processing machines and units thereof; magnetic or optical readers, machines for transcribing data onto data media and machi-nes for processing such data, n.e.s.) and 759 (Parts and accessories suitable for use solely or principally with machines falling within groups 751 and 752). he irst two sections are inal goods and the last one, their main inputs.
Trade lows in both groups of goods increased substantially from 1990 to 2009. 751 1 752 (“computers”, for short) exports jumped from US$ 81.4 billion in 1990 to US$ 301.7 billion in 2009, as can be seen from Tables 3 and 4. It is easy to see that the share from developed countries dropped dramatically from 80% to 39% during this period. At the same time, exports from NIEs increased from 1990 to 2000 only to drop in the last decade, while lows from ASEAN countries also experienced a huge increase. his increase in intra-regional trade in IT goods was already analyzed by Bonham et al. (2007). But what happened to China exports is astonishing. From almost zero in 1990, its exports were propelled to US$ 125 billion in 2009, or 42% of total external sales of these products.
NONNENBERG
, M.J
.B
.; MESENTIER,
A.
Is China Only
Assembling P
arts and Components?
299
Exports Origin
World ASEAN ASIAN NIES China Japan Other 1990 2000 2009 1990 2000 2009 1990 2000 2009 1990 2000 2009 1990 2000 2009 1990 2000 2009 WORLD 393,039 976,898 1,510,424 9,693 30,455 53,995 35,114 109,150 194,038 6,525 35,791 140,839 16,713 56,872 57,767 324,994 744,629 1,063,785
ASEAN 7,956 65,536 78,761 141 3,309 5,135 2,605 15,806 14,051 11 1,416 9,195 556 9,188 7,923 4,643 35,816 42,458
ASIAN
NIES 56,282 170,090 263,598 3,039 11,148 20,444 5,142 21,271 22,555 3,593 19,099 94,386 2,934 16,786 13,492 41,574 101,785 112,722
China 4,355 45,853 347,535 30 1,842 12,237 3,723 13,201 107,313 59 5,731 21,095 543 25,079 206,891
Japan 69,372 98,651 75,279 2,025 5,341 4,359 10,679 22,592 15,676 1,029 4,412 13,893 55,639 66,307 41,351
Other 255,074 596,768 745,250 4,459 8,815 11,821 12,966 36,281 34,443 1,892 10,863 23,366 13,163 25,167 15,257 222,594 515 660,363 Source: World Bank (2010).
Tabela 3 – Bilateral trade of high tech goods (in %)
Exports destiny Exports
Origin
World ASEAN ASIAN NIES China Japan Other 1990 2000 2009 1990 2000 2009 1990 2000 2009 1990 2000 2009 1990 2000 2009 1990 2000 2009 WORLD 100.0 100.0 100.0 2.5 3.1 3.6 8.9 11.2 12.8 1.7 3.7 9.3 4.3 5.8 3.8 82.7 76.2 70.4
ASEAN 2.0 6.7 5.2 0.0 0.3 0.3 0.7 1.6 0.9 0.0 0.1 0.6 0.1 0.9 0.5 1.2 3.7 2.8
ASIAN NIES
14.3 17.4 17.5 0.8 1.1 1.4 1.3 2.2 1.5 0.9 2.0 6.2 0.7 1.7 0.9 10.6 10.4 7.5
China 1.1 4.7 23.0 0.0 0.2 0.8 0.9 1.4 7.1 0.0 0.0 0.0 0.0 0.6 1.4 0.1 2.6 13.7
Japan 17.7 10.1 5.0 0.5 0.5 0.3 2.7 2.3 1.0 0.3 0.5 0.9 0.0 0.0 0.0 14.2 6.8 2.7
Other 64.9 61.1 49.3 1.1 0.9 0.8 3.3 3.7 2.3 0.7 1.1 1.5 3.3 2.6 1.0 56.6 52.8 43.7
from a very small igure to US$ 6 billion, or 3.7% of total trade. But in the next 9 years, its exports jumped to US$ 32 billion, or a share of 18%, the double as the igure for ASEAN countries. During these years, exports from all other countries, except ASIAN NIEs, decreased in absolute igures. And 40% of Chinaís exports went to ASIAN NIEs and 45% to Other countries. his means that China gained competitiveness not only in inal goods, which are more intensive in low wage labor in its inal production pha-ses, but also in parts and components, that require much more specialized labor for its manufacturing. his gain came as companies from other Asian countries, especially Taiwan, expanded its plants in mainland China.
Another interesting aspect is the increasing complementarity between China and Asian NIEs in high tech trade. Both in computers and its parts and components, bilateral lows between these countries increased by a substantial amount. For instance, in heading 759 exports from Asian NIEs to China jumped from US$ 346 million in 1990 to US$ 19458 million in 2009. At the same time, exports from China to these countries increased from only US$ 90 million to astonishing US$ 12380 million. hese igures suggest that not only is China importing intermediate goods to inal assembling but is also assuming an impor-tant role in the supply chain for data processing machines industry in Asia, providing parts and components to countries like South Korea and Taiwan. As will be seen in the next pa-ragraphs, more or less the same picture emerges in telecom goods.
Turning now to Radio & TV receivers and parts, analysis is based on inal goods (761 - Television receivers including video monitors and video projectors, 762 - Radio--broadcast receivers and 76432 – mobile phones) and its parts (7761 - Television pictu-re tubes, cathode-ray , 7762 – Other electronic valves and tubes – including television camera tubes – and 764.93 - Parts and accessories suitable for use solely or principally with the apparatus of division 76: with the apparatus and equipment of groups 761 and 762 and subgroups 764.3 and 764.8)6. Although telephone sets are classiied elsewhe-re, in heading 764.11, mobile phones must be analyzed together with Radio and TV receivers because parts of both groups are included under heading 764.93 and cannot be further disaggregated.
As can be seen from Tables 7, 8, 9 and 10, global exports of inal goods rose ive-fold from 1992 to 2009, to reach US$ 216.6 billion, while sales of its parts jumped from US$ 25 billion to US$ 44.8 billion in the same period. It is remarkable that 40% of the increase of inal goods exports came from the Rest of the World. his increase derives in great part from exports of TV receivers from Eastern Europe (Hungary, Czech Republic, Slovakia and Poland) and Mexico. At the same time, exports from Japan plummeted
6 Even at-5 digit level, the classiication is not split enougt to avoid counting of parts that do not belong to
NONNENBERG
, M.J
.B
.; MESENTIER,
A.
Is China Only
Assembling P
arts and Components?
301
Origin
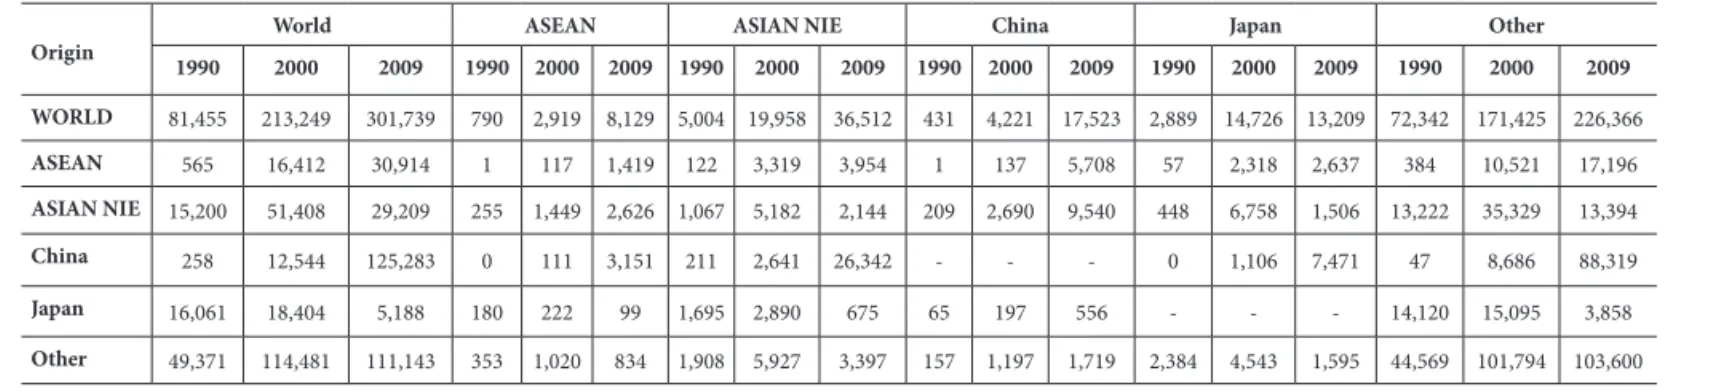
1990 2000 2009 1990 2000 2009 1990 2000 2009 1990 2000 2009 1990 2000 2009 1990 2000 2009 WORLD 81,455 213,249 301,739 790 2,919 8,129 5,004 19,958 36,512 431 4,221 17,523 2,889 14,726 13,209 72,342 171,425 226,366
ASEAN 565 16,412 30,914 1 117 1,419 122 3,319 3,954 1 137 5,708 57 2,318 2,637 384 10,521 17,196
ASIAN NIE 15,200 51,408 29,209 255 1,449 2,626 1,067 5,182 2,144 209 2,690 9,540 448 6,758 1,506 13,222 35,329 13,394
China 258 12,544 125,283 0 111 3,151 211 2,641 26,342 - - - 0 1,106 7,471 47 8,686 88,319
Japan 16,061 18,404 5,188 180 222 99 1,695 2,890 675 65 197 556 - - - 14,120 15,095 3,858
Other 49,371 114,481 111,143 353 1,020 834 1,908 5,927 3,397 157 1,197 1,719 2,384 4,543 1,595 44,569 101,794 103,600
Source: World Bank (2010).
Table 5 – Exports destination of 751 1 752 inal goods (in %)
Origin
World ASEAN ASIAN NIE China Japan Other 1990 2000 2009 1990 2000 2009 1990 2000 2009 1990 2000 2009 1990 2000 2009 1990 2000 2009 WORLD 100.0 100.0 100.0 1.0 1.4 2.7 6.1 9.4 12.1 0.5 2.0 5.8 3.5 6.9 4.4 88.8 80.4 75.0
ASEAN 0.7 7.7 10.2 0.0 0.1 0.5 0.1 1.6 1.3 0.0 0.1 1.9 0.1 1.1 0.9 0.5 4.9 5.7
ASIAN NIE 18.7 24.1 9.7 0.3 0.7 0.9 1.3 2.4 0.7 0.3 1.3 3.2 0.5 3.2 0.5 16.2 16.6 4.4
China 0.3 5.9 41.5 0.0 0.1 1.0 0.3 1.2 8.7 - - - 0.0 0.5 2.5 0.1 4.1 29.3
Japan 19.7 8.6 1.7 0.2 0.1 0.0 2.1 1.4 0.2 0.1 0.1 0.2 - - - 17.3 7.1 1.3
Other 60.6 53.7 36.8 0.4 0.5 0.3 2.3 2.8 1.1 0.2 0.6 0.6 2.9 2.1 0.5 54.7 47.7 34.3
Rev
. Econ.
Contemp
., Rio de J
aneiro
, v
. 16,
n.
2,
p
. 287-315,
mai-ago/2012
Origin
World ASEAN ASIAN NIE China Japan Other 1990 2000 2009 1990 2000 2009 1990 2000 2009 1990 2000 2009 1990 2000 2009 1990 2000 2009 WORLD 49,847 165,662 174,992 1,257 10,212 12,097 4,342 27,252 27,561 400 7,829 25,579 2,289 11,307 6,221 41,559 109,062 103,534
ASEAN 1,743 23,295 15,873 74 2,236 1,999 953 7,766 4,403 0 841 2,089 161 2,794 1,005 555 9,657 6,377
ASIAN NIE 6,898 45,055 48,380 710 3,736 5,382 1,040 7,479 5,532 346 4,910 19,458 339 4,455 2,077 4,464 24,475 15,932
China 117 6,094 32,038 0 472 2,227 90 2,949 12,830 0 0 0 3 605 2,528 25 2,068 14,452
Japan 8,771 16,807 13,184 215 1,809 757 809 3,697 2,037 20 1,080 1,7 77 0 0 0 7,726 10,221 8,613
Other 32,317 74,411 65,517 258 1,958 1,732 1,450 5,361 2,758 33 998 2,256 1,786 3,453 611 28,789 10,221 58,160
Source: World Bank (2010).
Table 7 – 759 parts (in %)
Exports Destination
Origin
World ASEAN ASIAN NIE China Japan Other
1990 2000 2009 1990 2000 2009 1990 2000 2009 1990 2000 2009 1990 2000 2009 1990 2000 2009
WORLD 100.0 100.0 100.0 2.52 6.16 6.91 8.71 16.45 15.75 0.80 4.73 14.62 4.59 6.83 3.55 83.37 65.83 59.17
ASEAN 3.50 14.06 9.07 0.15 1.35 1.14 1.91 4.69 2.52 0.00 0.51 1.19 0.32 1.69 0.57 1.11 5.83 3.64
ASIAN NIE 13.84 27.20 27.65 1.42 2.26 3.08 2.09 4.51 3.16 0.69 2.96 11.12 0.68 2.69 1.19 8.95 14.77 9.10
China 0.24 3.68 18.31 0.00 0.29 1.27 0.18 1.78 7.33 0.01 0.37 1.44 0.05 1.25 8.26
Japan 17.60 10.15 7.53 0.43 1.09 0.43 1.62 2.23 1.16 0.04 0.65 1.02 15.50 6.17 4.92
Other 64.83 44.92 37.44 0.52 1.18 0.99 2.91 3.24 1.58 0.07 0.60 1.29 3.58 2.08 0.35 57.76 37.81 33.24
NONNENBERG
, M.J
.B
.; MESENTIER,
A.
Is China Only
Assembling P
arts and Components?
303
Destination
Origin World ASEAN ASIAN NIES China Japan Other
1992 2000 2009 1992 2000 2009 1992 2000 2009 1992 2000 2009 1992 2000 2009 1992 2000 2009 World 42.306.429 111.922.266 216.644.172 890.806 2.638.042 5.370.761 5.439.844 9.189.484 24.629.494 1.157.242 1.714.222 2.972.733 1.031.533 3.879.668 6.297.125 33.787.005 94.500.850 177.374.059
ASEAN 3.966.008 9.589.899 7.550.057 21.342 193.402 329.439 610.073 1.521.201 959.960 3.935 132.693 47.110 242.323 1.611.148 1.027.800 3.088.335 6.131.455 5.185.748
ASIAN
NIES 12.541.815 17.622.162 35.703.439 407.419 1.241.467 2.809.821 754.370 2.596.487 1.977.813 346.402 364.054 2.007.036 540.090 669.290 2.206.311 10.493.535 12.750.864 26.702.458 China 2.282.977 7.196.829 59.217.934 32.098 399.812 1.259.344 1.847.298 2.044.917 18.712.187 0 0 0 70.489 618.481 2.849.289 333.092 4.133.620 36.397.115
Japan 7.369.279 6.440.624 1.345.357 156.955 109.035 40.738 1.564.549 917.321 242.643 655.756 381.507 73.728 0 0 0 4.992.019 5.032.761 988.248
Other 16.146.350 71.072.753 112.827.385 272.990 694.328 931.419 663.554 2.109.557 2.736.892 151.149 835.968 844.859 178.632 980.749 213.725 14.880.024 66.452.150 108.100.489
Television and radio equipment and mobile phones - parts and components Destination
Origin World ASEAN ASIAN NIES China Japan Other
1992 2000 2009 1992 2000 2009 1992 2000 2009 1992 2000 2009 1992 2000 2009 1992 2000 2009 World 25.001.052 54.905.571 44.803.156 1.928.140 5.833.977 2.931.082 4.977.108 8.270.795 6.331.474 1.404.944 6.165.515 3.114.997 880.771 2.153.047 2.349.280 15.810.089 32.482.236 30.076.323
ASEAN 1.051.088 4.188.215 3.975.500 110.997 1.005.810 427.574 592.121 1.325.479 603.275 3.771 422.150 171.529 75.734 375.201 298.023 268.465 1.059.576 2.475.098
ASIAN
NIES 5.743.984 12.416.530 8.200.246 1.061.400 2.748.612 1.118.398 966.957 2.063.326 645.775 1.158.514 3.104.995 1.198.433 362.703 270.954 200.959 2.194.410 4.228.644 5.036.681 China 481.378 3.211.304 10.104.413 20.503 263.125 449.890 350.914 1.232.411 3.319.759 59.898 438.028 1.439.329 50.062 1.277.739 4.895.435
Japan 5.636.533 7.638.164 5.549.338 476.010 1.131.812 674.271 2.433.691 2.375.247 1.115.038 129.100 966.724 1.334.208 2.597.731 3.164.380 2.425.821
Other 12.088.068 27.451.358 16.973.660 259.228 684.619 260.949 633.425 1.274.332 647.627 113.558 1.671.647 410.827 382.435 1.068.864 410.969 10.699.421 22.751.896 15.243.288
Television and radio equipment and mobile phones - parts and components - in % Destination
Origin World ASEAN ASIAN NIES China Japan Other
1992 2000 2009 1992 2000 2009 1992 2000 2009 1992 2000 2009 1992 2000 2009 1992 2000 2009 World 100,0 100,0 100,0 7,7 10,6 6,5 19,9 15,1 14,1 5,6 11,2 7,0 3,5 3,9 5,2 63,2 59,2 67,1
ASEAN 4,2 7,6 8,9 0,4 1,8 1,0 2,4 2,4 1,3 0,0 0,8 0,4 0,3 0,7 0,7 1,1 1,9 5,5
ASIAN NIES 23,0 22,6 18,3 4,2 5,0 2,5 3,9 3,8 1,4 4,6 5,7 2,7 1,5 0,5 0,4 8,8 7,7 11,2
China 1,9 5,8 22,6 0,1 0,5 1,0 1,4 2,2 7,4 0,2 0,8 3,2 0,2 2,3 10,9
Japan 22,5 13,9 12,4 1,9 2,1 1,5 9,7 4,3 2,5 0,5 1,8 3,0 10,4 5,8 5,4
Other 48,4 50,0 37,9 1,0 1,2 0,6 2,5 2,3 1,4 0,5 3,0 0,9 1,5 1,9 0,9 42,8 41,4 34,0
while ASEAN sales almost doubled. But the most striking feature is the performance of Chinese exports that reached US$ 59.2 billion, or 27% of total exports in 2009. his makes China the biggest TV and radio receivers and mobile phones exporter, with roughly 2/3 of its sales going to the Rest of the World (ROW).
Total exports of parts and accessories increased during the nineties to decrease in the following years. Sales from the ROW reached US$ 27.5 billion in 2000 only to fall to US$ 17 billion in 2009. Exports of parts and accessories are increasingly made in Asian coun-tries. While ASEAN countries were responsible for 9% of total exports, China accounts for 23%, an equivalent share of inal goods market. And it is also worth noting that most of its sales are directed to developed countries − NIEs, Japan and ROW7.
5. CHANGES IN CHINESE EXPORTS BY TECHNOLOGY INTENSITY
Until very recently, China was a low value added goods exporter, as may be seen from Figure 2. Considering only the categories from A to E2, in 1985 86% of its exports con-sisted of goods of categories A and B, i.e., commodities and products intensive in natural resources or labor; this igure decreased to 56% in 1997, still a substantial amount. But in 2009, only 32% of its exports consisted of these goods, while the share of electronics and precision instruments, which was close to zero in the early eighties, jumped to 27%.
he bulk of this increase came from computers and telecom goods, where lies Chi-nese comparative advantages. Most importantly, ChiChi-nese increasing advantages in these goods correspond to the decreasing advantages of developed countries in these same sectors. Figure 3 depicts the trade balance of high tech goods, for China and high in-come countries, split by main categories. As can be seen, especially in computers, the increase in trade balance in China equals the decrease in high income countries. Net exports of telecom goods also turned positive and gained momentum ater 2007, whi-le the opposite occurred in high income countries since 2004. As for the other main categories of high tech goods, namely aircrat, professional, scientiic and controlling instruments and photographic apparatus and equipment and optical goods, China trade balance continued in negative territory.
Only in 2004 high tech goods became the most important export category. Of cour-se, its production is still concentrated in a few goods. But this is not very diferent from what happened in other Asian countries, like Korea or Japan, where high tech produc-tion and exports are also concentrated in a limited amount of goods.
We turn now to the analysis of the domestic value added of the main categories. As mentioned above, data has been prepared at 4 or even 5 digit level,
Figure 2 – Chinaís exports by technology intensity (in US$ billion)
Source: World Bank (2010).
6. DOMESTIC VALUE ADDED IN FOREIGN TRADE HIGH TECH GOODS
As already mentioned, the analysis will be based on a proxy for domestic value added, consisting of the diference between exports of inal goods and imports of their main parts and components, as identiied by COMTRADE data, for goods classiied as in-tensive in high technology (see Annex A). Although this not strictly domestic value added, we will use this terminology for convenience. All data are shown as a % of ex-ports of the two-digit division.
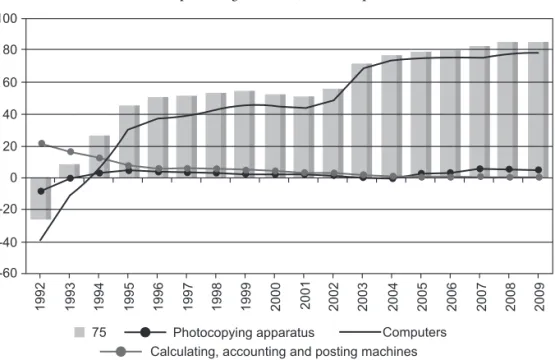
Starting with division 75, Oice machines and automatic data processing machines, it has been possible to determine ive pairs of goods. It is easy to see by Figure 4 that the most important one is automatic data processing machines, computers for short, as its value corresponds to almost all chapter 75. From 1992 to 1995, domestic value added as a % of division 75 exports reversed its signal from negative to positive, reaching 30%. In 2003, they reached another level, of around 75%, that remained more or less constant since then. he other four categories are oice machines and their share in world trade is small and decreasing, like typewriters and calculating machines.
Chapter 76 includes telecommunications, sound recording and television equipment, with a pattern very similar to division 75. In this case, we could identify four categories: 761-762–7643 comprises TV and radio receivers (basically lat panel TVs) and mobile phones8, 763 sound and TV recorders and reproducers, 7641 – basically telephone sets
8 Mobile phones are not included in subgroup 7641 but in basic heading 764.32 (transmission apparatus
Figure 3(a) – High income countries, trade balance, high tech goods (in US$ billion)
Figure 3(b) – China, trade balance, high tech goods (in US$ billion)
Figure 4 – Domestic value added, division 75, oice machines and automatic data-processing machines (as a % of exports)
Source: Author´s elaboration based on World Bank (2010).
Figure 5 – Domestic value added, division 76, telecommunications and sound-recording and reproducing apparatus and equipment (as a % of exports)
-40 -20 0 20 40 60 80
76 TVs, radios and mobile phones
Sound and TV recorders & reprod. Telephone sets (excl. mobiles) Microphones & loudspeakers 100
1994
1993
1992 1995 1996 1997 1998 1999 2000 2001 2002 2003 2004 2005 2006 2007 2008 2009
Source: World Bank (2010).
Figure 6 – Domestic value added, division 79, aircrat and associated equipment (as a % of exports)
Division 87 includes all Professional, Scientiic and Controlling Instruments. In this case, it has been possible to disaggregate data up to every subgroup, at the 4-digit level. Until 2001, the share of each subgroup was more or less balanced. But the surge of its exports started in 2002, due basically to subgroup 8719, liquid crystal devices, lasers; other optical appliances and instruments. Optical devices industry may have received positive spillovers from the development of lat panel TVs production as there is a clear convergence of technologies in these sectors. As may be seen from Figure 7, the rela-tive weight of LCD, lasers and other optical appliances in total exports of Division 87 jumped from around 10%, in the irst years of the series, to nearly 60% in the last three years, greatly inluencing the inal result. It must be stressed that this a very highly tech-nology intense industry and produces goods utilized by many other high tech sectors, providing a clear statement of Chinaís growth in technology absorption.
Figure 7 – Domestic value added, division 87, professional, scientiic and controlling instruments and apparatus (as a % of exports)
Source: Author’s elaboration based on World Bank (2010).
9 his heading includes TV cameras and video cameras, which is a source of error. But it is a much smaller
error than not to include digital cameras in the item for Photographic Equipment.
we had to consider also heading 763.81, although it belongs to Telecommunications Equipment9. At the same time, it has not been possible to include all parts and compo-nents related to this item which are considered as parts and compocompo-nents for TV and radio receivers. So, any underestimation here is compensated by an overestimation of the same amount in TV and radios. But even if, say, half the value for its parts and components is included as imports, the amount of domestic value added would not change dramatically, especially in the last 4 years. And the increase in DVA for photo-graphic equipment is very strong since 2000. At the same time, the other two items did not show any substantial increase. Our measure of DVA jumped from 25% of exports in 1992 to more than 90% in recent years
Figure 8 – Domestic value added, division 88, photographic apparatus, equipment and supplies and optical goods, watches and clocks (as a % of exports)
Source: Author’s elaboration based on World Bank (2010).
examined above, only aircrat industry has presented a weak performance. he incre-ase of our measure of domestic value added in relative terms to exports indicates that the share of components manufactured in China to the exports value is higher than it was some twenty years ago and that relects Chinaís augmented capacity to participate in the value chain.
his astonishing performance relects, of course, the process of fragmentation of production and the creation of Global Production Networks. But, as stressed by most authors, this could not be achieved without a great efort on innovation by China, making their irms capable to adopt and adjust foreign knowledge in order to climb up the technological ladder. And it is also the result of many years of investments in education on every level, from fundamental to superior degrees. A well educated and trained labor force is crucial for a rapid productivity increase like this one.
7. CONCLUDING REMARKS
he purpose of this paper was to present evidence about the profound changes that occurred in Chinaís high tech exports in the last two decades. More speciically, we wi-shed to show, ater presenting a general background on high tech goods bilateral lows, that China is transforming its role in the manufacturing process of this industry. Since the beginning of the last decade, China has been able to climb the technological lad-der, not only increasing its exports of inal goods but also its production of parts and components, as revealed by the huge increase in our gauge of domestic value added, the diference between exports of inal goods and imports of parts and components. In oice and data processing machines, for instance, the domestic value added as a % of total exports increased from – 25% in 1992 to 85% in 2009. At the same time, the same igure for professional, scientiic and controlling instruments jumped from 21% to 75%. he picture that emerges is that China, in many high tech sectors, like telecommunica-tions and computer equipment, is no longer a mere inal assembler but a producer of core technology embedded in vital parts and components goods.
his performance resembles, in many ways, what happened to other industrialized Asian countries in the recent past, like Japan, Korea or Taiwan. But what is striking here is the speed at what it is happening and its amount. As was shown, in many industries as important as computer and telecommunication, the share of Chinese exports is ra-pidly increasing and is already very substantial.
were not made long before that. No country can be as competitive as China in goods as knowledge intensive as motherboards, chips, lat TVs components, etc. without a very high skilled labor force and a very integrated and technologically advanced manufac-turing industry. his is even more remarkable when we remember that, in contempo-rary GPNs, domestic irms can be also held responsible not only for mass production but also for development process, like prototype building and pilot production. And for this to happen, there must be a lot of spillovers from one sector to the other and from one irm to the other.
REFERENCES
BONHAM, C.; GANGNES, B.; VAN ASSCHE, A. Fragmentation and East Asia’s information technology trade. Applied Economics, v. 39, p. 215-28, 2007.
DEDRICK, J.; KRAEMER, K.; LINDEN, G.; BROWN, C.; MURTHA, T. Organizing global kno-wledge networks in the electronics industry. PCIC/IC Irvine, June, 2007.
DUNNING, J. Location and the multinational enterprise: a neglected factor? Journal of Interna-tional Business Studies, v. 29, n. 1, 1998.
DUNNING, J. Multinational enterprise and the global economy. Wokinghan: Addison-Wesley, 1993.
ERNST, D. he new mobility of knowledge: digital information systems and global lagship ne-tworks. In: LATHAM, R.; SASSEM, S. IT and new architectures in the global realm. Princeton and Oxford: Princeton University Press, 2005(a).
ERNST, D. Pathways to innovation in Asia’s leading electronics-exporting countries a framework for exploring drivers and policy implications. International journal of technology manage-ment, v. 29, n. 1/2, 2005(b).
ERNST, D.; KIM, L. Global production networks, knowledge difusion and local capability for-mation. A conceptual framework. East-West Center Working Papers, n. 19, Honolulu, USA, May, 2001.
GEREFFI, G. he organization of buyer-driven global commodity chains: how US retailers shape overseas production networks. In: GEREFFI, G.; KORZENIEWICZ, M. (Eds.) Commodity chains and global capitalism. Wesport – Connecticut / USA: Praeger, 1994, p. 95-122.
GEREFFI, G. International trade and industrial upgrading in the apparel commodity chain. Journal of international economics, v. 48, p. 37-70, 1999.
GEREFFI, G.; HUMPHREY, J.; STURGEON, T. he governance of global value chains. Review of international political economy, v. 12, n. 1, February, p. 78-104, 2005.
GRUBEL, H.; LLOYD, P. J. Intra-industry trade. London: Macmillan, 1975.
HELPMAN, E. International trade in the presence of product diferentiation, economies of scale and monopolistic competition: a Chamberlin-Hecksher-Ohlin approach. Journal of interna-tional economics, v. 11, p. 305-340, 1981.
HOBDAY, M. East Asian latecomer irms: learning the technology of electronics. World Develo-pment, v. 23, n. 7, p. 1171-1193, 1995.
HOBDAY, M. East versus Southeast Asian innovation systems: comparing OEM and TNC-led growth in electronics. In: KIM, L.; NELSON, R. Technology, learning and innovation. Cam-bridge, UK: Cambridge University Press, 2000.
JONES, R.; KIERZKOWSKI, H.; LURONG, C. What does the evidence tell us about fragmen-tation and outsourcing. HEI Working Paper, Graduate Institute of International Studies/ Geneva, n. 9, 2004.
JONES, R.; KIERZKOWSKI, H. International trade and agglomeration: an alternative framework. HEI working paper, Graduate Institute of International Studies/Ge neva, n. 10, 2004(a).
JONES, R.; KIERZKOWSKI, H. International fragmentation and the new economic geogra-phy. HEI working paper, Graduate Institute of International Studies/Geneva, n. 11, 2004(b).
KRUGMAN, P.– Increasing returns, monopolistic competition and international trade, Journal of International Economics, v. 9, p. 469-479, 1979.
KRUGMAN, P.– Scale economies, product diferentiation and the pattern of trade. American Economic Review, v. 70, p. 950-959, 1980.
SRHOLEC, M. High tech exports from developing countries: a symptom of technology spurts or statistical illusion? Review of World Economics, v. 143, n. 2, p. 227-255, 2007.
UNCTAD. Trade and development report. New York and Geneva: United Nations, 2002.
WORLD TRADE ORGANIZATION (WTO); INSTITUTE OF DEVELOPING ECONOMIES (IDE–JETRO). Trade patterns and global value chains in East Asia. Geneva: WTO, 2011.
ANNEX A
STANDARD INTERNATIONAL TRADE CLASSIFICATION,
REVISION 3
GOODS CLASSIFIED AS HIGH TECH
751 Oice machines
752 Automatic data-processing machines and units thereof; magnetic or optical rea-ders, machines for transcribing data onto data media in coded form and machines for processing such data, n.e.s.
759 Parts and accessories (other than covers, carrying cases and the like) suitable for use solely or principally with machines falling within groups 751 and 752 761 Television receivers (including video monitors and video projectors), whether or
not incorporating radio-broadcast receivers or sound - or video-recording or re-producing apparatus
762 Radio-broadcast receivers, whether or not incorporating sound-recording or re-producing apparatus or a clock
763 Sound recorders or reproducers; television image and sound recorders or repro-ducers; prepared unrecorded media
764 Telecommunications equipment, n.e.s., and parts, n.e.s., and accessories of appa-ratus falling within division 76
776 hermionic, cold cathode or photo-cathode valves and tubes (e.g., vacuum or vapour or gas-illed valves and tubes, mercury arc rectifying valves and tubes, cathode-ray tubes, television camera tubes); diodes, transistors and similar semi-conductor devices;
792 Aircrat and associated equipment; spacecrat (including satellites) and spacecrat launch vehicles; parts thereof
871 Optical instruments and apparatus, n.e.s.
872 Instruments and appliances, n.e.s., for medical, surgical, dental or veterinary pur-poses
873 Meters and counters, n.e.s.
881 Photographic apparatus and equipment, n.e.s. 882 Photographic and cinematographic supplies
883 Cinematographic ilm, exposed and developed, whether or not incorporating soundtrack or consisting only of soundtrack