The Contribution Of FDI Flows To Domestic
Investment: An Econometric Analysis Of Developing
Countries
Evren İPEK* Özlem AYVAZ KIZILGÖL**
ABSTRACT
Foreign direct investment flows may affect domestic investment in different dimensions. The interests related to the impact of FDI on domestic investment focus on whether FDI is a complement or a substitute for domestic investment. The aim of this paper is to research for the effects of FDI on domestic investment for Turkey, Brazil, Russia, South Africa and Mexico by using time series analyses. For this purpose, we utilize GMM (Generalized Method of Moments) methodology. The sample period is 1990:1-2012:3 for Turkey and Mexico; 1995:1-2012:3 for Brazil; 1995:1-2012:2 for Russia and 1990:1-2011:4 for South Africa. The empirical results put forth an evidence of crowding out effect for Turkey and South Africa. On the other hand, it is found that FDI creates crowding in effects for Russia. One other finding of the study is statistically insignificant coefficients for Brazil and Mexico.
Key Words: Foreign Direct Investment, Domestic Investment, Developing Countries, Time Series Analysis, GMM.
JEL Classification: F21, F23, O11, C22, G11
Doğrudan
Yabancı
Sermaye
Yat
ı
r
ı
mlar
ı
n
ı
n
Yurtiçi
Yat
ı
r
ımlara Etkisi: Gelişmekte Olan Ülkeler İçin Ekonometrik Bir
Analiz
ÖZ
Doğrudan yabancı sermaye yatırımları yurtiçi yatırımları çeşitli şekillerde
etkileyebilmektedir. Bu türdeki sermaye akımlarının yurtiçi yatırımlar üzerindeki etkisine yönelik
ilgi, DYSY'nın etkisinin tamamlayıcı mı yoksa ikame edici mi olduğu üzerine odaklanmıştır.
Çalışmanın amacı zaman serileri analizini kullanarak Türkiye, Brezilya, Rusya, Güney Afrika ve Meksika için doğrudan yabancı yatırımların yurtiçi yatırımlar üzerindeki etkilerini araştırmaktır.
Bu amaç için GMM yöntemi kullanılmıştır. Örneklem dönemi Türkiye ve Meksika için 1990:1
-2012:3, Brezilya için 1995:1-2012:3, Rusya için 1995:1-2012:2 ve Güney Afrika için
1990:1-2011:4 olarak belirlenmiştir. Analiz sonuçları Türkiye ve Güney Afrika için dışlama etkisinin
geçerliolduğunu göstermektedir. Diğer taraftan Rusya için doğrudan yabancı yatırımların artırma
etkisi yarattığı bulunmuştur. Çalışmanın diğer bir bulgusu, Brezilya ve Meksika için istatistiksel
olarak anlamsız katsayı tahminlerinin elde edilmesidir.
Anahtar Kelimeler: Doğrudan Yabancı Sermaye Yatırımları, Yurtiçi Yatırımlar,
Gelişmekte Olan Ülkeler, Zaman Serileri Analizi, GMM.
JEL Sınıflandırması: F21, F23, O11, C22, G11
I. INTRODUCTION
The key problem for developing economies is the resource requirements in excess of domestic savings. At that point foreign capital is accepted as an
important way to overcome this shortcoming. Foreign capital flows include both financial investments that are made via instruments of capital and money markets, and foreign direct investments (FDI) that have physical characteristics (Seyidoğlu, 2003: 451). Foreign direct investments can be defined as investments that are made by foreign firms in domestic lands through purchasing a firm or providing founding capital for a newly established firm or increasing the capital of an existing company (Karluk, 2003: 486). IMF defines this kind of foreign capital as "an incorporated or unincorporated enterprise in which a foreign investor owns 10 percent or more of the ordinary shares or voting power of an incorporated enterprise or the equivalent of an unincorporated enterprise". Direct investment enterprises comprise those entities that are subsidiaries (a nonresident investor owns more than 50 percent), associates (an investor owns 50 percent or less) and branches (wholly or jointly owned unincorporated enterprises) either directly or indirectly owned by the direct investor (IMF, 2013: 86).
The major determinants of FDI are liberalization policies, new economic integrations, trade acts, tariff liberalization and new information technology that declines the communication and management costs. FDI creates significant economic effects by providing access to new markets, cheap production, new technology, alternative products, labor and management skills and financing opportunities. FDI also plays a major role in the internationalization of the business (Göçer et al, 2012: 94).
The impacts of FDI on investment may be positive or negative. These effects arise from its complementarity and substitution attributes. If FDI produces substitute goods, it may crowd out especially inefficient domestic firms; on the other hand if FDI produces complementary goods or if FDI uses inputs from domestic market, it may crowd in domestic investment. Effects of FDI on domestic investment depend on whether FDI and the domestic firms are in the same industry or not. If FDI comes to a sector in which domestic activities are intensive, domestic firms may have difficulties in surviving against the competition of foreign firms and may be driven out of the sector. If FDI goes to a sector which includes less domestic firms, it may crowd in the domestic firms in this sector (Göçer et al., 2012: 95).
Although it is conventionally thought that increases in direct investment would affect domestic investment in the same direction via its positive externalities, significant amount of empirical studies presume that the effect of direct investment on domestic investment may be negative and question the potential relationship between the two variables. Empirical results could not submit precise results regarding the impact of FDI on domestic investment. Because the results of empirical analysis vary from country to country/ region to region, due to the differences in national/regional policies, response of domestic enterprises, the type of FDI inflow in the recipient country and the econometric methodology used (De Mello, 1999; Eregha, 2011: 4).
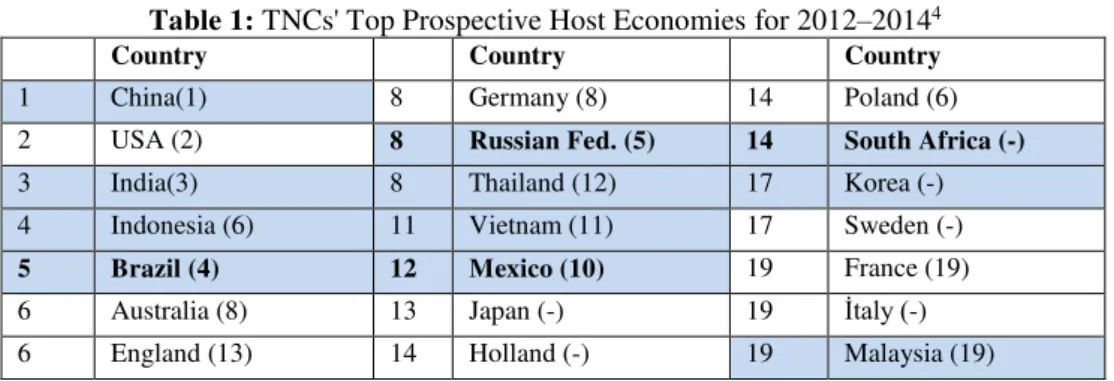
empirical investigation focuses on developing economies that need foreign resources- especially FDI which is more preferable sort of foreign capital depending on its less speculative, less volatile and long term property- to finance their economic development; and since investment is accepted as a fundemental determinant of economic growth, the link between FDI and investment have to be considered. The findings from this investigation will provide guadince for the decision makers about the contribution of FDI. If the direct investment is found to crowd out domestic investment, then this result would lead us to question the contribution of direct investment for the host country and to consider what to do to increase the economic benefits from FDI. The sample of the study is selected as Brazil, Russia, South Africa, Turkey and Mexico. The countries other than Turkey are top prospective host economies for 2012–2014 periods according to the UNCTAD survey that is based on 174 validated company responses.1
The next part of the study is organized as follows. The second part of the study explains the theoretical channels through which the crowding out/ in effects of FDI on domestic investment occur. The third part conveys the previous empirical studies related to the subject. The fourth and the ensuing part provide information followingly about the data set, methodology and the empirical results. And finally the last part of the study includes the conclusions and suggestions.
II. THE EFFECTS OF FDI ON DOMESTIC INVESTMENT
FDI can influence the host countries' economy in various ways. The main reason for the effort of the host countries to attract foreign direct investments is to be able to reach new financing resources for their economic development. The key role of investment in economic growth and development is well known. So, in assessing the contribution of FDI on economic development, an important point to focus on is the effect of FDI on domestic investment.
The effect of FDI on domestic investment may be complementary or substituent. If there is substitution effect (crowding out effect), foreign firms replace the locals and if there is complementarity effect (crowding in effect), foreign firms support local firms to develop and to become effective. When it is considered that total investment volume of a country consists of foreign and domestic investment; it can be said that in case of crowding out effect, rate of increase in total investment is smaller than the rate of increase in foreign investment. And in case of crowding in effect, rate of increase in total investment exceeds the rate of increase in foreign investment (Titarenko, 2005: 3; Özağ et al, 2004: 66; Agosin and Machado, 2005: 151). The impact of FDI on domestic investment varies from country to country depending on national policies, the sort of FDI and the strength of the domestic entrepreneur in the host country (Titarenko, 2005: 3; Agosin and Machado, 2005: 151). These two opposite impacts of FDI on investment will be summarized in the following subheadings.
A. Complementarity Effect
The channels through which the complementarity effects of FDI on domestic investment arise can be listed as follows:
The contribution of FDI on capital formation varies depending on the sector that the FDI goes. If the sector that FDI goes is different from the sectoral distribution of the existing capital stock, the impact of FDI on domestic investment may be complementary (Agosin and Mayer, 2000: 4). In other words, FDI in undeveloped sectors, where there is not domestic competition, may lead total capital stock to increase (Açıkalın, 2009: 2). This is because domestic firms in undeveloped sectors do not have the basic information about the production process (Agosin ve Machado, 2005: 151). Furthermore the investments that are planned to be carried out in undeveloped sector of developing economies are so costly. Especially financial and technological necessities for the sectors that require high technology are much higher than the domestic capacity (Titarenko, 2005: 3).
Foreign investors may contribute to the domestic firms by their financial resources (Apergis et al, 2006: 386).
FDI may create positive externalities through their new technology, machine and equipment, developed organizational methods, manegerial skills, advanced marketing techniques and opportunities to reach international markets (Açıkalın, 2009: 2).
FDI may provide the infrastructure (transportation, telecommunications, etc.) that is necessary for domestic capital formation but can not be done through their own means. And this factor increases the profitability of the domestic investors (Çinko, 2009: 124; Apergis et al, 2006: 386).
The impact of FDI on domestic investment depends on the reason of their coming. If the aim is to overcome the trade barriers of the host economy, the domestic investment will not increase. But if it is purposed to provide comperative advantage, FDI may create positive effects with its forward and backward linkage effects (Mahmood and Chaudhary, 2012: 1500).
FDI may impress domestic investment positively by creating demand for goods and inputs and so by increasing the income of both domestic firms and factor owners (Bilgili et al, 2007: 131; Mahmood and Chaudhary, 2012; 1500).
FDI may cause the other firms in the same sector to gain more competetive property (Agosin and Machado, 2005: 152).
B. Substitution Effect
The effect of FDI on domestic investment may be substitutive. These negative effects arise through the channels outlined below:
that has a significant superiority in comparision with domestic firms invests in a competetive sector, it takes away the investment opportunities from domestic entrepreneurs (Agosin and Mayer, 2000: 3).
The foreign firms that are known with their superior technology are more advantegeous in getting some opportunities in comparision with domestic firms. And so they force domestic firms to go out the market (Agosin and Mayer, 2000). Foreign investments prevent the development of infant industries that can not abide the long and costly learning process (Özağ et al., 2004: 66).
FDI disrupt the balance of payments because it causes imports to increase and terms of trade to worsen. This situation leads an increase in the price of capital goods and a decrease in domestic investment (Apergis et al., 2006: 387).
Furthermore, multinational firms' capacity of employing qualified labor is more than domestic firms due to their production scale and specialization. And this is a significant cost for domestic firms in entering the market (Özağ et al., 66).
If foreign firms use the scarce physical and financial resources in the recipient country or if the foreign firms obstruct the investment opportunities of domestic firms, domestic investment may decrease (Çinko, 2009: 124). Domestic firms in countries with undeveloped financial markets can not get positive externalities from FDI (Mahmood and Chaudhary, 2012: 1500). Multinational firms may cause interest rates to increase by borrowing from domestic financial markets and consequently may induce domestic investment to decrease (Agosin and Machado, 2005: 153).
FDI crowds out domestic firms by causing wages and inputs that are domestically supplied to increase (Apergis et al., 2006: 387).
If foreign firms use modern production technologies while the local ones have primitive and traditional production structures, integrity of the economy deteriorates resulting in a dual structure and this situation leads to unfair competition (Şimşek andBehdioğlu, 2006: 53).
FDI may drive out local firms through competition by increasing competition and lowering prices (Mahmood and Chaudhary, 2012: 1501).
Another reason for crowding out is the different treatment given to foreign investors compared to domestic investors. The discretionary incentives given to foreign investors (including tax-holidays, free land, tax exemptions on imported machinery and intermediate inputs, access to loan guarantees and many other benefits) do not allow domestic firms to compete favorably with their counterparts (Mayanja, 2012: 17).
III. LITERATURE REVIEW
There have been many studies related to the effects of FDI on domestic investment in the literature. Some of these studies are summarized below:
Latin American countries). The sample period involves panel data for 1970-1996 eras. The study concludes that for Asian countries crowding in effects and for Latin American countries crowding out effects are valid. Analyses are repeated for sub periods of 1976-1985 and 1986-1996 and it is identified that the achieved results does not change under different sub period definitions.
Backer and Sleuwaegen (2003), in the context of occupational choice models, conclude that FDI declines the power of local entrepreneurs but increases the domestic investments through networking chain and learning effects.
Agrawal (2000) analyzes the effects of FDI on domestic investment for five South Asian economies (India, Pakistan, Bangladesh, Sri Lanka and Nepal) by using panel data for the 1965-1996 periods. The empirical results that are achieved from fixed effects methodology indicate that FDI is complement for domestic investments.
Hecht et al. (2004) investigate the topic with a panel data set of 64 countries that covers the 1976-1997 periods. The results from OLS and two stage OLS analyses point to crowding in effects of FDI.
Titarenko (2005) evaluates the subject for Latvia. Analyses are realized with quarterly time series for 1995-2004 periods. The paper follows the approach of Agosin and Mayer (2000). Results from empirical analysis present a crowding out effect of FDI on domestic investment for Latvia.
Agosin and Machado (2005), analyze the relationship between FDI and domestic investment with panel data for 12 countries regarding 1971-2000 period. They utilize GMM methodology and detect that FDI causes crowding out effects in Latin American countries while the effect is neutral for Asian and African countries.
Apergis et al. (2006) investigate the dynamic relationship between FDI inflows and domestic investment for a panel of 30 countries by means of panel cointegration and causality techniques. The sample period is 1992-2002. The results of the bivariate case support the complementarity between FDI and domestic investment while the results of the multivariate case point out crowding out effects of FDI.
Düzgün (2008) analyzes the effects of FDI on investment for Turkey by the use of quarterly time series for the 1991:4- 2004:4 periods. The paper follows Engle -Granger cointegration and Granger causality methodologies. Empirical results indicate a cointegration relationship between the variables and a unidirectional causality from domestic investment to FDI.
Eregha (2011) explores the relationship for 10 ECOWAS2 countries. The paper analyzes the 1970-2008 period by bivariate and multivariate panel cointegration techniques. Empirical results indicate a long run cointegration relationship between variables and call attention to crowding out effects of FDI on domestic investment in ECOWAS countries. Furthermore, panel causality tests point out bidirectional causality between FDI and domestic investment.
Sunny and Sawant (2012) research the potential crowding in/ out effects of FDI for Chine and India. The approach of Agosin and Mayer (2000) is followed in the empirical analyses that are performed with annual data for 1980-2010 periods. The results support a crowding in effect for India and a crowding out effect for China. Johansen cointegration analysis results support the presence of cointegration relationship between FDI and domestic investment for the Indian economy. According to the Granger causality results there is a unidirectional causality from domestic investment to FDI.
Mahmood and Chaudhary (2012) explore the relationship between FDI and domestic investment for Pakistan by ARDL cointegration technique and error correction models. The analyses involve 1972-2010 period. Empirical results indicate that the variables are cointegrated and FDI affects domestic investment positively both in the long run and in the short run. Another empirical study for Pakistan economy is realized by Shah et al. (2012). The paper analyzes the 1990-2010 periods and utilizes OLS methodolgy. The results indicate that FDI creates complementary effects on domestic investment.
Göçer et al. (2012) explore the impact of FDI on domestic investment for 35 developing countries with panel data related to 1992-2010 periods. The empirical results that are obtained through GMM methodology represent a positive impact from FDI to domestic investment.
Mayanja (2012) investigates the effect of FDI on domestic investment for 30 Sub-Saharan African countries by system GMM methodology and with panel data regarding 1990-2008 eras. Empirical findings support crowding out effects.
IV. DATA SET AND VARIABLES
In this paper, impact of FDI on domestic investment is investigated for Turkey, Brazil, Russia, South Africa and Mexico through time series analyses. The time interval determined for each country is different due to the availability of data. The analyses are performed with quarterly series. The sample period is 1990:1-2012:3 for Turkey and Mexico; 1995:1-2012:3 for Brazil; 1995:1-2012:2 for Russia and 1990:1-2011:4 for South Africa. The variables used in empirical analysis are symbolized with F, I and GR. F is the ratio of FDI (which is the sum of FDI in abroad and FDI in recepient country) to GDP. But only in Mexico F is taken as the ratio of FDI in recipient country to GDP.
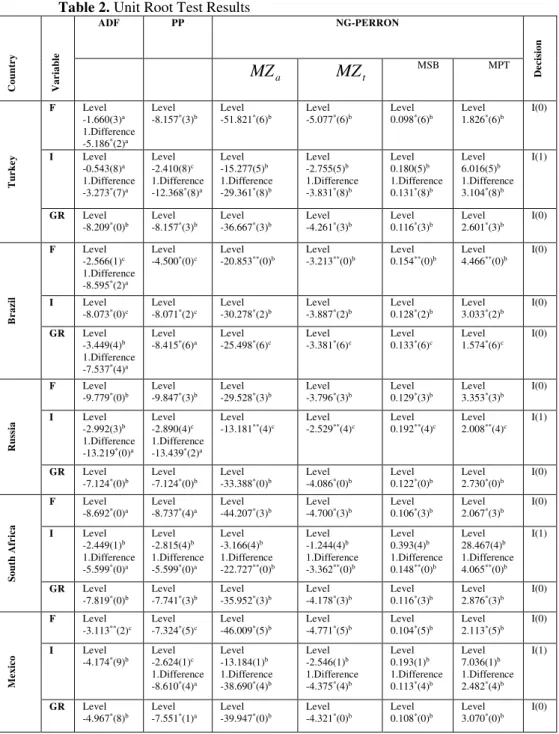
Table 2. Unit Root Test Results Coun tr y Var iab le
ADF PP NG-PERRON
De
c
is
ion
a
MZ MZt
MSB MPT
T u r k e y
F Level -1.660(3)a 1.Difference -5.186*(2)a
Level -8.157*(3)b
Level -51.821*(6)b
Level -5.077*(6)b
Level 0.098*(6)b
Level 1.826*(6)b
I(0)
I Level -0.543(8)a 1.Difference -3.273*(7)a
Level -2.410(8)c 1.Difference -12.368*(8)a
Level -15.277(5)b 1.Difference -29.361*(8)b
Level -2.755(5)b 1.Difference -3.831*(8)b
Level 0.180(5)b 1.Difference 0.131*(8)b
Level 6.016(5)b 1.Difference 3.104*(8)b
I(1)
GR Level -8.209*(0)b
Level -8.157*(3)b
Level -36.667*(3)b
Level -4.261*(3)b
Level 0.116*(3)b
Level 2.601*(3)b
I(0)
B
r
az
il
F Level -2.566(1)c 1.Difference -8.595*(2)a
Level -4.500*(0)c
Level -20.853**(0)b
Level -3.213**(0)b
Level 0.154**(0)b
Level 4.466**(0)b
I(0)
I Level -8.073*(0)c
Level -8.071*(2)c
Level -30.278*(2)b
Level -3.887*(2)b
Level 0.128*(2)b
Level 3.033*(2)b
I(0)
GR Level -3.449(4)b 1.Difference -7.537*(4)a
Level -8.415*(6)a
Level -25.498*(6)c
Level -3.381*(6)c
Level 0.133*(6)c
Level 1.574*(6)c
I(0)
Rus
sia
F Level -9.779*(0)b
Level -9.847*(3)b
Level -29.528*(3)b
Level -3.796*(3)b
Level 0.129*(3)b
Level 3.353*(3)b
I(0)
I Level -2.992(3)b 1.Difference -13.219*(0)a
Level -2.890(4)c 1.Difference -13.439*(2)a
Level -13.181**(4)c
Level -2.529**(4)c
Level 0.192**(4)c
Level 2.008**(4)c
I(1)
GR Level -7.124*(0)b
Level -7.124*(0)b
Level -33.388*(0)b
Level -4.086*(0)b
Level 0.122*(0)b
Level 2.730*(0)b
I(0) S ou th Af r ica
F Level -8.692*(0)a
Level -8.737*(4)a
Level -44.207*(3)b
Level -4.700*(3)b
Level 0.106*(3)b
Level 2.067*(3)b
I(0)
I Level -2.449(1)b 1.Difference -5.599*(0)a
Level -2.815(4)b 1.Difference -5.599*(0)a
Level -3.166(4)b 1.Difference -22.727**(0)b
Level -1.244(4)b 1.Difference -3.362**(0)b
Level 0.393(4)b 1.Difference 0.148**(0)b
Level 28.467(4)b 1.Difference 4.065**(0)b
I(1)
GR Level -7.819*(0)b
Level -7.741*(3)b
Level -35.952*(3)b
Level -4.178*(3)b
Level 0.116*(3)b
Level 2.876*(3)b
I(0)
M
e
xico
F Level -3.113**(2)c
Level -7.324*(5)c
Level -46.009*(5)b
Level -4.771*(5)b
Level 0.104*(5)b
Level 2.113*(5)b
I(0)
I Level -4.174*(9)b
Level -2.624(1)c 1.Difference -8.610*(4)a
Level -13.184(1)b 1.Difference -38.690*(4)b
Level -2.546(1)b 1.Difference -4.375*(4)b
Level 0.193(1)b 1.Difference 0.113*(4)b
Level 7.036(1)b 1.Difference 2.482*(4)b
I(1)
GR Level -4.967*(8)b
Level -7.551*(1)a
Level -39.947*(0)b
Level -4.321*(0)b
Level 0.108*(0)b
Level 3.070*(0)b
I(0)
I is the proportion of domestic investment to GDP. GR is the growth rate of reel GDP. All the variables are expressed in U.S. dolars. Data used in this study is obtained from IMF (IFS- International Financial Statistics) and OECD. After the series are deseasonalized, 3 unit root tests, namely Augmented Dickey-Fuller (ADF), Phillips-Perron (PP) and Ng-Perron are performed. The results of the unit root tests are submitted in Table 2.
V. EMPIRICAL RESULTS
The study utilizes GMM methodology in order to analyze the impact of FDI on domestic investment for Turkey, Brazil, Russia, Mexico and South Africa. Analyses are performed seperately for each country. The instrumental variables of the models are lagged values of the variables. The investment model for each of the five countries is as shown below:
(1)
4 13 3 12 2 11 1 10 4 9 3 8 2 7 1 6 4 5 3 4 2 3 1 2 1 t t t t t t t t t t t t t t t
GR
GR
GR
GR
I
I
I
I
F
F
F
F
F
I
where I = investment/GDP ratio, F = FDI/GDP ratio, GR = growth of reel GDP, the
is a constant and
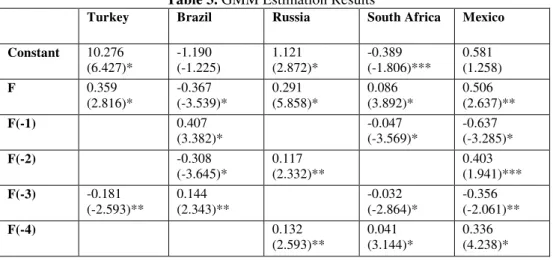
is a serially uncorrelated random error. The model, which has been developed by Agosin and Mayer (2000), has current and lagged values of the growth rate and FDI as explanatory variables of domestic investment.After estimating this investment model for each country and removing all statistically insignificant variables, we reach the results that are represented in Table 3.3 AR(1) is included into the models in order to eliminate the autocorrelation problem.
Table 3. GMM Estimation Results
Turkey Brazil Russia South Africa Mexico
Constant 10.276 (6.427)* -1.190 (-1.225) 1.121 (2.872)* -0.389 (-1.806)*** 0.581 (1.258)
F 0.359
(2.816)* -0.367 (-3.539)* 0.291 (5.858)* 0.086 (3.892)* 0.506 (2.637)**
F(-1) 0.407
(3.382)*
-0.047 (-3.569)*
-0.637 (-3.285)*
F(-2) -0.308
(-3.645)*
0.117 (2.332)**
0.403 (1.941)***
F(-3) -0.181
(-2.593)** 0.144 (2.343)** -0.032 (-2.864)* -0.356 (-2.061)**
F(-4) 0.132
(2.593)**
0.041 (3.144)*
0.336 (4.238)*
3 Following Titarenko (2005: 6), we removed statistically insignificant variables in forming the final
form of the investment model.
I(-1) 1.343 (16.114)*
1.282 (18.345)*
2.134 (23.036)*
1.764 (17.287)*
I(-2) -0.929
(-7.594)*
-0.666 (-4.452)*
-1.501 (-6.774)*
-0.945 (-7.655)*
I(-3) 0.771
(5.272)*
0.701 (4.299)*
0.559 (2.618)**
I(-4) 0.451
(7.414)*
-0.093 (-1.178)
-0.385 (-6.235)*
-0.165 (-1.917)***
0.139 (3.334)*
GR(-1) 0.009
(2.070)**
0.029 (7.541)*
-0.009 (-3.777)*
0.014 (2.483)**
GR(-2) 0.016
(2.415)**
-0.013 (-3.272)*
0.055 (4.039)*
GR(-3) 0.061
(9.442)*
0.031 (3.938)*
0.009 (2.486)**
0.004 (1.247)
-0.073 (-5.239)*
GR(-4) -0.009
(-2.072)**
0.024 (6.261)*
AR(1) 0.865
(24.841)*
-0.717 (-12.006)*
-0.838 (-16.304)*
-0.604 (-5.452)*
-0.867 (-12.685)*
R2 0.808 0.711 0.636 0.952 0.586
Note: The values in parenthesis are t-statistics. *, **, *** indicates respectively 1% siginficance level, 5% significance level and 10% significance level.
In order to determine whether FDI crowds out or crowds in domestic investment in the long run, we used the coefficient developed by Agosin and Mayer (2000: 9) and laterly used by Titarenko (2006) and Sunny and Swant (2012). The relevant coefficient is shown below:
9
6 5
1
ˆ 1
ˆ ˆ
j j j
j
LT
(2)The criteria used to determine the CO/CI effect is the value and
significance of coefficient
ˆ
LT. The significance of
ˆ
LT is tested through Wald Test. There are three possibilities (Agosin and Machado, 2005: 156):1) The case in which it is not possible to reject the hypothesis (
ˆ
LT = 1) with a Wald test. This means that in the long run an increase in FDI adds one to one to total investment and there are no macroeconomic externalities stemming from FDI.3) The case in which the null hypothesis (
ˆ
LT = 1) is rejected and
ˆ
LT< 1. This means that there is long-run crowding out (CO) effect. More precisely, FDI adds less than one to one to total investment and has negative long-term externalities on investment. In other words, there is displacement of domestic investment by FDI.The Wald test results of
ˆ
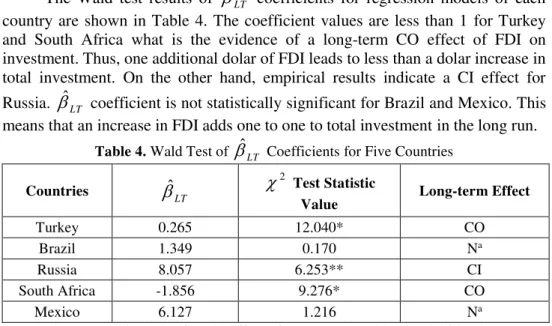
LT coefficients for regression models of each country are shown in Table 4. The coefficient values are less than 1 for Turkey and South Africa what is the evidence of a long-term CO effect of FDI on investment. Thus, one additional dolar of FDI leads to less than a dolar increase in total investment. On the other hand, empirical results indicate a CI effect forRussia.
ˆ
LT coefficient is not statistically significant for Brazil and Mexico. This means that an increase in FDI adds one to one to total investment in the long run.Table 4. Wald Test of
ˆ
LT Coefficients for Five CountriesCountries
LT
ˆ
2 Test StatisticValue Long-term Effect
Turkey 0.265 12.040* CO
Brazil 1.349 0.170 Na
Russia 8.057 6.253** CI
South Africa -1.856 9.276* CO
Mexico 6.127 1.216 Na
*, **; indicates respectively significantly different from one at the 1% level and 5% level. Na ; not
significantly different from one.
VI. CONCLUSION
There are different opinions about the effects of FDI on domestic investment in economics literature. Some researchers advocate the crowding out effects of FDI while others argue that FDI creates crowding in effects. In the case of a crowding out effect, FDI displaces domestic investment. However in the existence of crowding in effect, FDI stimulates domestic firms to invest more or supports their development. The main purpose of this study is to analyze the validity of these effects in selected developing countries.
Africa. However, there is no significant crowding in or crowding out effect for Brazil and Mexico.
Based on these empirical results, it can be said that national investment policies should be rearranged to increase the contribution of FDI to domestic investment. FDI_inflows_towards_the_less_developed_industrial_sectors should be encouraged by new incentives. In this way, foreign investors may contribute these sectors via their new technologies and new products. These incentives can stimulate the activity of domestic firms and enable FDI to crowd in domestic investment.
REFERENCES
Açıkalın, S. (2009). Türkiye'de Doğrudan Yabancı Yatırımlar (DYY) ve Yurtiçi Yatırımlar
Arasındaki Nedensellik İlişkisi, Hitit Üniversitesi Sosyal Bilimler Enstitüsü Dergisi, 2(2), 1-15,
http://www.sbedergi.hitit.edu.tr/article/view/1055000021
Agosin, M. R., Machado, R. (2005). Foreign Investment in Developing Countries: Does it Crowd in
Domestic Investment. Oxford Development Studies, 33 (2), 149-162. Doi:
10.1080/13600810500137749
Agosin, M. R., Mayer, R. (2000). Foreign Investment in Developing Countries: Does it Crowd in
Domestic Investment?. Discussion Paper, United Nations (UN) Conference on Trade and
Development (UNCTAD), no. 146, http://unctad.org/en/docs/dp_146.en.pdf
Agrawal, P. (2000). Economic Impact of Foreign Direct Investment in South Asia. Working Paper,
Indira Gandhi Institute of Development Research, India.
Apergis, N., Katrakilidis, C. P., Tabakis, N. M. (2006). Dynamic Linkages between FDI Inflows and
Domestic Investment: A Panel Cointegration Approach. Atlantic Economic Journal, 34,
385-394. Doi: 10.1007/s11293-006-9026-x
Backer, K. D., Sleuwaegen, L. (2003). Does Foreign Direct Investment Crowd Out Domestic
Entrepreneurship?. Review of Industrial Organization, 22(1), 67-84.
Doi: 10.1023/A:1022180317898
Bilgili, F., Düzgün, R., Uğurlu, E. (2007). Büyüme, DoğrudanYabancı Sermaye Yatırımları ve
Yurtiçi Yatırımlar Arasındaki Etkileşim. Erciyes Üniversitesi Sosyal Bilimler Enstitüsü Dergisi, 2 (23), 127-151,
http://sbedergi.erciyes.edu.tr/sayi_23/sayi_23.htm
Çinko, L. (2009). Doğrudan Yabancı Sermaye Hareketlerinin Makroekonomik Etkileri. Marmara
Üniversitesi İİBF Dergisi, 26 (1), 117-131,
http://e-dergi.marmara.edu.tr/maruiibfd/article/view/5000011184/5000011464
Mello, L. R. (1999). Foreign Direct Investment-led Growth: Evidence from Time Series and Panel
Data. Oxford Economic Papers, 51, 133-151,
http://dept.ku.edu/~empirics/Courses/Econ915/papers/FDI_panel.pdf
Düzgün, R. (2008). Doğrudan Yabancı Sermaye Yatırımları ve Yurtiçi Yatırımlar Arasındaki
Eşbütünleşme İlişkisi: Türkiye Örneği.Eskişehir Osmangazi Üniversitesi Sosyal Bilimler Dergisi, 9 (1), 187-204,
http://sbd.ogu.edu.tr/makaleler/9_1_Makale_10.pdf
Eregha, P. B. (2011). The Dynamic Linkages Between Foreign Direct Investment and Domestic
Investment in ECOWAS Countries: A Panel Cointegration Analysis. 2011 Conference of
the Centre for the Study of African Economies, 20-22 March 2011, Oxford University, Oxford, UK.,
http://www.csae.ox.ac.uk/conferences/2011-EDiA/papers/123-Eregha.pdf
Göçer, İ., Peker, O., Mercan, M. (2012). Effect of Foreign Direct Investments on Domestic
Investments of Developing Countries: A Dynamic Panel Data Analysis. 3rd International
http://eprints.ibu.edu.ba/1316/1/11.%20Effect%20Of%20Foreign%20Direct%20Investme nts%20On%20Domestic%20Investments%20Of%20Developing.pdf
Hecht, Y., Razin, A., Shinar, N. G. (2004). Interactions between Capital Inflows and Domestic
Investment: International Panel Data. Israel Economic Review, 2 (2), 1–14,
http://www.boi.org.il/deptdata/mehkar/iser/04/iser_1.pdf IMF (2013). Balance of Payments Manual.
http://www.imf.org/external/pubs/ft/bopman/bopman.pdf
Karluk, R. (2003). Uluslararası Ekonomi, Teori ve Politika (7. Baskı).İstanbul: Beta.
Mahmood, H., Chaudhary, A. R. (2012). Foreign Direct Investment-Domestic Inverstment Nexus in
Pakistan. Middle-East Journal of Scientific Research, 11 (11), 1500-1507. Doi:
10.5829/idosi.mejsr.2012.11.11.1633
Mayanja, J. B. (2012). Determinants of Domestic Private Investment in Sub-Saharan African (SSA)
Countries: The Role of Foreign Direct Investment,
http://www.econ.jku.at/members/Schneider/files/lehre/disscolloquium/bbale.pdf
Özağ, F., Atan, M., Kaya, S. (2004). Doğrudan Yabancı Sermaye Yatırımlarının Toplam Yatırımlar
Üzerindeki Etkisi. Ekonomik Yaklaşım, 51, 65-71. Doi:10.5455/ey.10417
Seyidoğlu, H. (2003). Uluslararası Mali Krizler, IMF Politikaları, Az Gelişmiş Ülkeler, Türkiye ve
Dönüşüm Ekonomileri. Doğuş Üniversitesi Dergisi, 4(2), 141-156, http://journal.dogus.edu.tr/index.php/duj/article/view/171/187
Shah, S. H., Hasnat, H., Jiang, L. J. (2012). Does Foreign Capital Inflows Really Stimulate
Domestic Investment: A Case Study of Pakistan. International Research Journal of
Finance and Economics, 85, 78- 86,
http://www.internationalresearchjournaloffinanceandeconomics.com/ISSUES/IRJFE_Issue_85.htm Sunny, D., Sawant, A. (2012). Crowding-in and Crowding-out Impacts of FDI on Domestic
Investment: An Indo-China Analysis. APEA Annual International Conference, 28-29
June, Singapore,
http://www.apeaweb.org/confer/sing12/papers/S12-118%20Sunny.pdf
Şimşek, M., Behdioğlu, S. (2006). Türkiye’de Dolaysız Yabancı Sermaye Yatırımlarının Ekonomik
Büyüme ÜzerindekiEtkisi: Uygulamalı Bir Çalışma. İktisadive İdari Bilimler Dergisi, 20
(2), 47- 65,
http://www.acarindex.com/dosyalar/makale/acarindex-1423871366.pdf
Titarenko, D. (2005). The Influence of Foreign Direct Investment on Domestic Investment Processes in Latvia. MPRA Paper No: 1819, 1-9,
http://mpra.ub.unimuenchen.de/18192/ WIR (2012). World Investment Report.
http://www.unctad-docs.org/files/UNCTAD-WIR2012 Full-en.pdf
Table 1: TNCs' Top Prospective Host Economies for 2012–20144
Country Country Country
1 China(1) 8 Germany (8) 14 Poland (6)
2 USA (2) 8 Russian Fed. (5) 14 South Africa (-)
3 India(3) 8 Thailand (12) 17 Korea (-)
4 Indonesia (6) 11 Vietnam (11) 17 Sweden (-)
5 Brazil (4) 12 Mexico (10) 19 France (19)
6 Australia (8) 13 Japan (-) 19 İtaly (-)
6 England (13) 14 Holland (-) 19 Malaysia (19)
Resource: WIR (2012: 22) (http://www.unctad-docs.org/files/UNCTAD-WIR2012-Full-en.pdf
4 The source of the table is an UNCTAD survey which is based on 174 validated company