Acoustic and psychoacoustic analysis of the noise produced by the
police force firearms
Abstract
Heraldo Lorena Guida1, Thiago Hernandes Diniz2, Sérgio Koodi Kinoshita3
1 PhD, Assistant Professor. 2 Speech Therapist.
3 PhD, Professor.
Faculdade de Filosoia e Ciências, Universidade Estadual Paulista - UNESP Campus de Marília SP.
Send correspondence to: Heraldo Lorena Guida - Faculdade de Filosoia e Ciências, UNESP Avenida Hygino Muzzi Filho 737 Campus Universitário Marília SP 17525-900. E-mail: hlguida@marilia.unesp.br
Fundação de Amparo à Pesquisa do Estado de São Paulo - FAPESP (Proc. nº 08/50720-1).
Paper submited to the BJORL-SGP (Publishing Management System – Brazilian Journal of Otorhinolaryngology) on April 15, 2010; and accepted on July 23, 2010. cod. 7007
p
olice officers are exposed to impact noise coming from firearms, which may cause irreversible injuries to the hearing system.Aim: To evaluate the noise exposure in shooting stands during gunfire exercises, to analyze the acoustic impact of the noise produced by the firearms and to associate it with tonal audiometry results.
Study design: Cross-sectional.
Materials and methods: To measure noise intensity we used a digital sound level meter, and the acoustic analysis was carried out by means of the oscillations and cochlear response curves provided by the praat software. 30 police officers were selected (27 males and 3 females).
Results: The peak level measured was 113.1 dB(C) from a .40 pistol and 116.8 dB(C) for a .38 revolver. The values obtained for oscillation and praat was 17.9±0.3 Barks, corresponding to the rate of 4,120 and 4,580 Hz. Audiometry indicated greater hearing loss at 4,000Hz in 86.7% of the cases.
Conclusion: With the acoustic analysis it was possible to show cause and effect between the main areas of energy excitation of the cochlea (praat cochlear response curve) and the frequencies of low hearing acuity.
ORIgInAL ARTIcLE
Braz J Otorhinolaryngol. 2011;77(2):163-70.
BJORL
Keywords: firearms, police,
noise, occupational.
INTRODUCTION
noise, in portuguese, is a word derived from Latin’s rugitu, which means large noise. it is acoustically made up of numerous sound waves with anarchically distribu-ted amplitude and phase ratios, causing an unpleasant sensation1. noise can be continuous - when there is no variation in terms of sound pressure nor sound spectrum; floating - when it presents variations in terms of acoustic energy in function of time; or impact noise - with acoustic energy peaks lasting for less than a second, at intervals greater than one second2.
impact noises are usually produced by quick gas expansion, such as that produced by firearms or bomb explosions. These types of sound can reach intensities of 140 dB SpL (sound pressure level) in frequencies around 2 and 3 kHz and, for this reason, they are harmful for human hearing3.
When the human ear is exposed to impact noise, at a sound intensity of 120 dB or higher, there is a risk for acoustic trauma. This noise intensity can cause important and abrupt lesions to the cochlea, such as base membrane rupture, tissue and hair cell disarray. Clinically, one of the consequences of impact noise is an immediate and per-manent unilateral or bilateral hearing loss, with tinnitus. in some cases, the hearing loss may improve after a few days4; however, permanent exposure to intense noise dam-age the outer hair cells, especially those on the cochlear basal turn, very likely because this is the area of the organ which is more constantly stimulated5. The extension and the grade of the hearing damage has a direct relation with the sound pressure intensity, duration in time, frequency and the greater or lower susceptibility of the individual, which can cause changes to the hearing threshold, or noise-induced-hearing-loss (niHL) which, just like the acoustic trauma, is irreversible.
niHL is a sensorineural hearing loss, which initially involves the frequency range between 3 and 6 kHz, where the 8 kHz has to be better than the worst threshold (3, 4 or 6 kHz)6,7. This loss affects mainly the cochlear hair cells, situated at about 5 to 10 mm off the vestibular window, exactly on the region receiving the 4 to 6kHz stimuli. The causes for the greater vulnerability of this region have not yet been fully explained, but they may be associated with the resonance characteristics of the outer ear (Oe) and of the middle ear (Me), the mechanical and anatomical characteristics of the cochlea and also its blood supply8.
The Occupational Hygiene Standard9 from Fun-dacentro shows a formula used to calculate the quantity of impact pulses to which the worker is exposed in each day of work, according with the magnitude of the pulse. regulatory standard 15 (nr-15) also verses that the worker should not be exposed to sound pressure levels above 130 dB(C)2.
One of the industries which expose its workers to high noise levels is the military, especially when practicing with firearms. The firearm explosion noises are among the number one causes of noise-induced hearing loss in the united States10.
Auditory profile studies with military personnel in Brazil have shown high rates of hearing loss in this population, and such fact is associated with the excessive exposure to impact noise without individual protection equipment11-13.
in a study about the auditory profile of military personnel from the Brazilian Army, carried out by means of an interview, otoscopy and audiometric exam, we ob-served audiometric changes which were supposedly in-duced by noise in 38.1%, with a predominance of unilateral hearing loss. We also noticed that 64.5 % of the military people examined did not use proper hearing protection14.
Other authors measured the level of noise at the workplace of the police force of paraná, and found sound intensities higher than 100 dB SpL15. Within this line of research, we studied auditory thresholds of 22 police offi-cers from Bauru - Sp. Of these, 17 had altered audiograms, with notches in the high frequencies16.
in the Singapore Armed Forces, they studied the effects of basic military training on hearing. The researchers studied the audiometries of 85 military personnel before and after training, and found a prevalence of 9.4% of hearing loss, which was kept the same after one year. The study allowed us to conclude that the hearing protection program of the Singapore armed forces is efficient and preserves the auditory health of its officers17.
A recent study involved the audiological profile of five police officers from the Montes Claros police Force - MG, Brazil. in checking sound pressure levels, the mean level found at the shooting stand was 97.4 dB and of the five police officers studied, two had audiometric curves with a notch, one unilateral and the other was bilateral, and one showed mild sensorineural hearing loss in the high frequencies with a drop-shaped audiometric curve18.
The international literature suggests the need for a hearing preserving program for police officers and military personnel because of the high sound intensities to which this population is exposed to in their work environment19,20.
audiometric changes found among the officers examined; however, without a study of the physical characteristics of this type of noise and its influences on the types of hearing loss studied.
The literature has only a handful of studies as-sociated with the acoustic analysis of non-verbal sounds. There are studies which analyze the temporal and spectral representation of the sound stimulus22, or which group sounds according to the physical events which generate them, advocating the assumption that the acoustic proper-ties depend on the material (solid, liquid or gas) and the interaction of the materials themselves (e.g., impact, drip or explosion)23. However, to the extent of our knowledge, the specific acoustic analysis of the noise produced by firearms, as well as a later comparison with the audiologic findings, is rare in the literature.
recently in the uSA, a study was carried out to estimate the auditory risk of shooting civil firearms. dif-ferent types of weapons were analyzed: rifle, shotgun, .38 revolver and 9mm pistol. The maximum peaks obtained in the study were 141 a 164 dB (SpL). Considering the revolver and the pistol, in the analysis of the acoustic spectrum, the peaks of greatest energy were concentrated in the low and medium frequencies, with decreases in the high frequencies24.
The influence of the noise spectrum in the preva-lence of niHL among workers was carried out in plants with noise levels above 85 dB. The authors did not find associations between the frequency bands with intense noise levels and the hearing damage injury25.
As far as the sounds of musical instruments are concerned, the acoustic measures of duration, intensity and frequency of resonances are the ones most often used in the acoustic analysis of these stimuli22. Three periods are considered:
• Transitional attack: corresponds to the passage of silence to sound and in most musical instruments it lasts between some milliseconds and some hundredths of a second; it is very important for timbre recognition, and if cut, the instrument becomes non-classifiable in most of the cases;
• Period of stability: time between the previous and the following; usually corresponding to the period of a few tenths of a second to some seconds; it is extremely important for certain sound characteristics such as volume and intensity;
• Extinction transitory (drop): period in which the sound is extinguished; it is very important for recognizing timbre, and if cut, the instrument becomes non-classifiable in most of the cases.
during the gunshot noise study period, the stability is more important than the other parameters because of duration, intensity and volume in which the soldier will be exposed to this type of sound.
Considered fundamental to associate the exposure of military personnel to firearm noise, the goal of the pres-ent study was to assess noise exposure at the shooting stand of the police force, to analyze the acoustic spectrum of the noise produced by the firearms, transforming these values into the Bark scale, in order to compare these data with the audiometric results.
MATERIALS AND METHODS
We analyzed noise levels from the firearms dur-ing gun shootdur-ing practice in the police Academy of the State of São paulo, analysis from the noise of the firearms used during the shooting practice, and measures of tonal audiometry from a sample of the population of military personnel of this squad. We chose the two weapons which are most frequently used by these officers: .38 revolver and .40 pistol; usually called 38 revolver and .40 pistol, respectively.
This study was submitted to the ethics Committee in research, having been duly approved (protocol Cep # 2762/2007), and the procedures realized are in compli-ance with resolution 196/1996, from the national Health Council.
Noise Level Measurement
noise measurement was done by means of a digi-tal decibelimeter from MinipA, model MSL - 1350, pro-grammed in the fast response circuit (fast), “C” weighted, according to nr-15, in its Attachment #ii, and measure range between 65 and 130 dB. The guns used were the .38 revolver and the .40 pistol, both from Taurus Co.
during training in the shooting booth, the number of participating police officers varied between 12 and 15, and each individual shot the gun 50 times. Thus, multi-plying the number of shots by the number of individuals, we calculate from 600 to 750 impact pulses per period of training.
The police officers are duly equipped with indi-vidual protection equipment (ipe.), according to nr 620, from Ordinance 3214/782, being relevant for our study to stress the use of proper ear protectors, approved by the Ministry of Labor and employment.
Acoustic and Psychoacoustic Analysis
Since the goal of research work was to relate the military exposure with the level of noise submitted to during the training period we adopted the following procedures:
We first analyzed the wave form graphs from the shooting sounds in relation to their temporal representa-tion (Figure 1a). The graph provides informarepresenta-tion on sound duration and intensity variation throughout time. Based on this Praat graph, we plotted the temporal graph of the sound intensity level (dB) (Figure 1b) and we established the peak instants for each shot sequence by means of a matrix of data available at the Praat application.
the time period between 0.1 and 1.5 seconds with 0.01 second intervals. This process of semi-automatic iteration enabled us to establish the time periods in which there is the highest level of excitation (fon scale) in the two gunshot sequences (Figure 1d).
With that, it was possible to compare the peak instants obtained from the temporal graphs (wave form and sound intensity level) and the time instants in which there is greater base membrane excitation from the cochleograms (position cochleograms and spectral excitation curve). if the instants are statistically similar, we can assume that instant as the one with the greatest base membrane excitation. These values were established through the data matrix of the graphs available at the Praat application. We employed the t-student statistical test in order to assess the relationship between the two groups of independent samples with a 5% significance level (a = 0.05) for the null hypothesis (Ho). knowing these instances of greater excitation, we can raise the Barks band in which this excitation happens and, with that, we establish its frequency range.
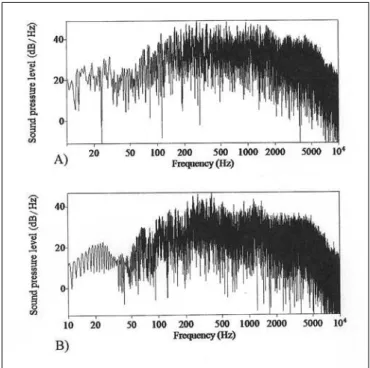
Thus, it was possible to also identify the spectral shape curve of the gunshot sound from the two types of firearms in order to analyze and discuss the transitional period of the attack, stability and extinction transitional. This curve is relevant in order to determine the mean energy density in function of frequency (Figure 2).
Figure 1.Praat pictures from the .38 revolver second sample (Table 1); A - temporal graph (oscillograph); B - Bark temporal position cochle-ograph; C - sound intensity level temporal graph (dB) with maximum values in 0.33s and 0.75s; D - spectral excitation graph (fon scale) where more external continuous lines correspond to a greater degree of excitation for time instants: 0.36s and 0.67s for the two shooting sequences of the sample.
After the temporal acoustic analysis of the shots from the fire weapons, we studied the positional co-chleograms (a graph which represents the inner ear base membrane excitation pattern in function of time) from each shooting sequence in order to establish in which regions of the cochlear base membrane there was a higher degree of deflection generated by the noise intensity. Since each region corresponds to a resonance frequency range, such as the Critical Band, it is supposed that the regions are subjected to a higher likelihood of damaging the hair cells because of the high gunshot intensity (Fig-ure 1c). The Critical Band represents a given frequency in the scale between 0 and 24 and a unit in Bark. The position cochleograms enables one to graphically visualize the regions of higher excitation by the gunshot sound; however, it makes it difficult to establish the exact posi-tion in which there is the highest degree of excitaposi-tion. in order to improve the precision of this measure, we raised excitation spectral curves in an iterative way within
Auditory Threshold Assessment
The auditory threshold measures were carried out in an acoustic booth, with a GSi 61 Grason - Stadler27 au-diometer. For this study we selected the medical records from 30 police officers from both genders (3 females and 27 males), with a mean age of 41.9 ± 3.21 years (34 to 47 years) and mean time in the police force of 19.4 ± 4.02 years (9 to 25 years).
We have also assessed the asymmetry of the audio-logical values between the tonal audiometry thresholds of the right and left ears using the McNemar test starting from the threshold ratios. We used the non-parametric test for two ratios, which assesses the level of disagreement of a variable between two paired samples. The unilateral alteration (left or right ear) is what we call disagreeing pairs. The significance level used was 1% (a = 0.01) for the null hypothesis (H0).
RESULTS
The background noise on the measurement days was 75.3 dB (C), in average, and the maximum peaks measured were 113.1 dB(C) for the .40 pistol and 116.8 dB(C) for the .38 caliber revolver. The noise level mean values were 114.8 dB(C) and 111.9 dB(C), respectively, for the revolver and the pistol.
The time instants in which we had the highest noise intensity in the temporal scale and the greatest excitation in the spectral analysis by means of the cochleograms for the two shooting sequences are depicted on Table 1. The t-student test employed between the two groups of analyses resulted in p=0.29 (p>a=0.05) for the 1st shot and p=0.17 (p>a=0.05) for the 2nd shot, confirming the null hypothesis (Ho), in other words, there were no significant differences in the results comparison between the times
of the two samples (temporal form versus cochleograph). Thus, the statistical test guaranteed the use of the excitation peak time values from the cochleograph (Table 1) as a reference to establish the Bark scale in which there was the highest degree of base membrane excita-tion (Table 2). The values were established on the Bark scale for the 10 samples with two shooting sequences. For the .38 revolver, the Bark scale was in 18.1 and 18.2 in average for the 1st and 2nd shot, respectively. For the .40 pistol, the Bark scale was 17.8 and 17.6 in average for the 1st and 2nd shots, respectively. Therefore, we can consider that in average, for the two types of weapons, the value was around 17.9±0.3 Barks, corresponding, by linear interpolation, to a cochlear stimulation area between 4120 and 4580 Hz.
The spectral form (Figure 2) has a descending shape for both types of weapons, with an energy drop after the 5,000 Hz frequency. We consider that, despite the similarities between both types of acoustic spectra, the attack transitional period (which happens near 200 to 250 Hz) and the stability period (range between 300 and 5,000 Hz), with a mildly increased tilt on the .40 pistol spectral analysis curve when compared to the acoustic spectrum of the .38 revolver shot.
The data obtained in the tonal audiometry test of this sample of police officers, depicted on Table 3, showed a reduction in their hearing acuity above 30 dB(HL) in the frequency range between 3,000 and 6,000 Hz, with a greater acuity loss in the frequency of 4,000 Hz (86.7%), depicting a notch-like hearing loss. The lower hearing acuity losses happened to the frequencies below 3,000 Hz (30.0%) and 8,000 Hz (36.6%). The bilateral hearing losses had higher values for the frequencies of 3,000 Hz and 4,000 Hz, not going beyond 36.7% of the total sample; the unilateral range, in these frequencies did not go beyond
Table 1. Time values in seconds, corresponding to the sound intensity level curve peaks (dB) and the curves of greater cochle-ograph excitation for the two sequences of shots from 10 samples of weapons.
Weapon Temporal Form Analysis Cochleograph Analysis
Time (s) Time (s)
1st shot 2nd shot 1st shot 2nd shot
.38 Revolver 0.48 1.03 0.45 0.89
0.33 0.75 0.36 0.67
0.19 0.60 0.24 0.54
1.39 1.85 1.24 1.60
1.50 1.94 1.27 1.60
.40 Pistol 1.52 2.56 1.29 2.11
1.04 1.92 0.91 1.62
1.08 1.86 0.93 1.60
1.76 2.42 1.50 1.99
16.7% (re) and 33.3% (Le), and the normal bilateral in 13.7%. The Mcnemar statistical test employed resulted in accepting the null hypothesis (Ho) with a lower p value = 0.22 (p>a=0.01), statistically confirming the symmetry of the hearing alteration in this sample.
DISCUSSION
during practice with firearms, we identified at least
600 sound impacts caused by firing the weapons. Since the norma Técnica Fundacentro3 establishes the maximum level of noise for these impacts to be 109 dB (C), it is clear the unhealthy situation lived by these professional during their practice.
Other authors also found high levels of sound in-tensity in the occupational environment of police officers7, and studies of audiological assessment of police officers found high levels of hearing loss in this population5.
The data hereby presented is in agreement with those in the national and international literature, concern-ing the identification of an unhealthy occupational environ-ment and point to the need to create a hearing protection program for these law enforcement professionals3,10,15,16,19,20.
The temporal (Figure 1a) and spectral (Figure 2) analyses findings concerning the sounds from the firearms showed a high energy density in a broad frequency range and short time duration. We noticed that the transitional attack period happens near 200 to 250 Hz, the stability period is within the 300 and 5000 Hz range, and the extinc-tion transiextinc-tional period starts at 5,000 Hz. The duraextinc-tion of the pulses is less than one second and the high intensity of noises near 120 dB(C) enabled us to preliminarily as-sume these police officers had their hearing acuity altered. The acoustic and psychoacoustic analyses of the gun shooting sounds pointed to some relevant aspects on the cause-and-effect analyses concerning the hearing loss detected in this sample of police officers. it established, a priori, the regions in which there was a higher degree of
Table 2. Frequency range obtained from the base membrane excitation pattern in the Bark scale for the 10 samples of sounds from the weapons (in two sequences of shots) analyzed by the positional cochleograph and the excitation graph.
Weapon Shot 1- Shot 2 Frequency range
(Bark scale) (Hz)
.38 Revolver 17 - 18 3700 5300
18 - 18 4400 5300
18 - 18 4400 5300
17 - 18 3700 5300
18 - 18 4400 5300
.40 Pistol 18 - 18 4400 5300
17 - 18 3700 5300
18 - 18 4400 5300
17 - 17 3700 4400
18 - 18 4400 5300
Table 3. Distribution of the audiometric alteration measures in a sample of 30 officers from the police force population, unilateral RE, unilateral LE and bilateral, considering the range of time spent in the service.
f (kHz) Audiometric
alteration
Time in Service (years) Total Total Total
0 -10 11 - 15 16 - 20 21- 25 N % %
< 3,0
RE 0 0 1 1 2 6.7
30,0
LE 0 0 1 3 4 13.3
Bilateral 1 0 0 2 3 10.0
3,0
RE 0 1 1 1 3 10.0
56,7
LE 0 0 3 5 8 26.7
Bilateral 0 1 3 2 6 20.0
4,0
RE 0 1 1 3 5 16.7
86,7
LE 2 0 5 3 10 33.3
Bilateral 0 2 5 4 11 36.7
6,0
RE 0 1 1 1 3 10.0
66,7
LE 1 0 2 3 6 20.0
Bilateral 0 2 5 4 11 36.7
8,0
RE 0 2 1 1 4 13.3
36,6
LE 0 0 3 1 4 13.3
Bilateral 0 0 2 1 3 10.0
cochlear basal membrane excitation with this type of noise, enabling the establishment of corresponding frequency ranges. in the praat cochleograph analysis it was pos-sible to notice an intense concentration of energy within 17.9±0.3 Barks, in other words, in the sensitivity region of the high cochlear frequencies: 4120 and 4580 Hz.
Audiometric findings corroborated what was pre-sented in the praat cochleograph, since the frequency with the worst auditory thresholds was the 4,000 Hz (Table 3). Therefore, these policemen had the sensorineural notch-like hearing loss28, the classical noise-induced hearing loss type6,7.
The data presented in the acoustic and audio-metric analyses confirm that the permanent exposure to noise damage the outer hair cells, especially those on the cochlear basal turn, very likely because this is the part of the organ which is most commonly stimulated8.
Although the statistical results on the hearing loss asymmetry between the ears (right and left) lead us to accept the null hypothesis (Ho), we have noticed that the proportion of hearing loss is slightly higher on the left ear for all frequencies, except 8,000 Hz - in which the propor-tion is the same (Table 3). This fact is associated with the head position during the shooting and it is relevant during the creation of a hearing protection program with the use of proper hearing protection devices for each ear29.
The measures and analyses carried out enabled the recognition of the environment and the quantification of the noise exposure21, and, in a complementary fashion, it was also possible to establish the reference audiogram for the police officers by means of audiological evalua-tions. Considering the need for continuity in audiometric management in this population, we will continue this work, with notices about the harmful effects of noise and the periodic follow up of the hearing situation of each police officer.
Concerning the acoustic analysis, the present study found results which were similar to those reported from the united States: the highest energy peaks were concen-trated in the low and medium frequencies, with a drop in the high frequencies24. Thus the psychoacoustic analysis importance: it enables a more accurate correlation of the noise influence on the cochlea.
Another study reports on the relationship between the noise acoustic spectrum and niHL; however, the au-thors did not do a psychoacoustic analysis to prove their results25. Thus, we do not corroborate this data, which describes the intensity as the main cochlear lesion factor, despite the acoustic spectrum.
CONCLUSION
The present study identified sound pressure levels which were higher than the ones recommended by the Fundacentro nHO 01 standard, which establishes that the
maximum limit for the population studied should not go above 109 dB(C).
Based on the acoustic and psychoacoustic analy-ses of the gun shots, it was possible to show that there is a coincidence between the main areas of energy concen-tration (Praat’s cochleograph) on the high frequencies, and the audiometric findings show the cause and effect relation between the firearm shots and the hearing loss.
Thus, we conclude for the need of developing a hearing protection program for the police officers in order to prevent the onset, as well as the worsening, of hearing loss in this population.
ACkNOwLEDGEMENT
We thank dr. Larissa Cristina Berti for her help in collecting the gun shot noise data.
REFERENCES
1. de Almeida SiC, Albernaz pLM, Zaia pA, Xavier OG, karazawa eHi. História da perda auditiva ocupacional provocada por ruído. rev Assoc Med Bras.2000;46:143-58.
2. Brasil. portaria nº 3214. Ministério do Trabalho 08/07/1978; nr 15. Atividades e operações insalubres (d.O.u. 06/07/1978).
3. plontke Skr, dietz k, Hans Cp, Zener p. The incidence of acoustic trauma due to new year’s firecrackers. eur Arch Otorhinolaryn-gol.2002;259:247-52.
4. Bento rF, Miniti A, Marone SAM. Tratado de otologia. São paulo: editora uSp; 1998.p.274-82.
5. Alberti pW. deficiência auditiva induzida pelo ruído. em: Lopes OF, Campos AH. Tratado de otorrinolaringolgia. São paulo: roca; 1994.p.934-49.
6. Fiorini AC. Audição: impacto ambiental e ocupacional. em: Ferreira Lp, Befi-Lopes dM, Limongi SCO. Tratado de Fonoaudiologia. São paulo: roca, 2004,p.631-42.
7. American College of Occupational and enviromental Medicine; ACOeM evidence-Based Statement. noise-induced hearing loss. J Occup environ Med. 2003;45.
8. Jerger S, Jerger J. Alterações auditivas. São paulo: Atheneu, 1989. 9. Fundacentro. nHO 01 - norma de higiene ocupacional procedimento
técnico - Avaliação da exposição ocupacional ao ruído. [citado 2007 out 31]. disponível em: http://isegnet.com.br/arquivoscurso/atuais/ anexo2.htm
10. Stewart M, pankiw r, Lehman Me, Simpson TH. Hearing loss and hearing handicap in users of recreational firearms. J Am Acad Au-diol.2002;13:160-8.
11. Godoy TCM. perdas auditivas induzidas pelo ruído em militares: enfoque preventivo. São paulo, 1991, p.136, (dissertação de Mes-trado - Faculdade de Fonoaudiologia da pontifícia universidade de São paulo).
12. neves-pinto rMn, Monteiro ArC, Seligmam J. perda auditiva indu-zida pelo ruído: revisão das publicações por brasileiros no período 1938-1970. em: nuldeman AA, Costa eA, Seligman J, Bañez rn. pAir - perda auditiva induzida por ruído. porto Alegre: Bagaggem Comunicação, 1997,p.33-39.
13. neves Be, Mello MGS. O uso de dispositivos de proteção auditiva nos tiros de fuzil e artilharia. Cad Saúde Colet.2007;15:97-116. 14. Silva Ap, Costa eA, rodrigues SMM, Souza HLr, Massafera VG.
Avaliação do perfil auditivo de militares de um quartel do exército Brasileiro. rev Bras Otorrinolaringol.2004;70:344-50.
16. Battaiola CM, Cassab TV, Feniman Mr, richieri-Costa A. Como vai a audição dos policiais militares da cidade de Bauru? em: Anais da Vi Jornada de Fonoaudiolgia; 2000, 17 19 agosto; Marília, Brasil. Marília: universidade estadual paulista, 2000.p.119-124.
17. Teo kJ, Chia Se, Tan CT, Ali SM. effects of basic military training on hearing in the Singapore Armed Forces. Singapore Med.2008;49:243-47.
18. Silva rCL, Zuba dCd. perfil audiológico dos instrutores de tiro da polícia militar de Montes Claros - MG. revista Consciência exten-são.2008;1:14-24.
19. ylikoski Me, ylikoski JS. Hearing loss and handicap of professional soldiers exposed to gunfire noise. Scand J Work environ Heal-th.1994;20:93-100.
20. pelausa eO, Abel SM, Simard J, dempsey i. prevention of noise-induced hearing loss in the Canadian military. J Otolaryn-gol.1995;24:271-80.
21. Ferreira Junior M. perda auditiva induzida por ruído, bom senso e consenso. São paulo: editora Vk;1998.p.85-92.
22. Henrique L. Acústica Musical. Lisboa: Fundação Calouste Gulbenkian; 1997.
23. Gaver WW. What in the World do We Hear?: An ecological Approach to Auditory event perception. ecological psychology.1993;5:1-29. 24. Flamme GA, Wong A, Liebe k, Lynd J. estimates of auditory risk
from outdoor impulse noise ii: Civilian firearms. noise Heal-th.2009;11:231-42.
25. Boger Me, Barbosa-Branco A, Ottoni AC. A influência do espectro de ruído na prevalência de perda auditiva induzida por ruído em trabalhadores. Braz J Otorhinolaryngol.2009;75:328-34.
26. Boersma p, Weenink: praat: doing phonetics by computer (Version 5.1.05) Computer program. [citado 2007 jun 28]. disponível em http: //www.praat.org/.
27. Momensohn-Santos TM, russo iCp. prática da audiologia clínica. 5a ed. São paulo: Cortez; 2005.
28. Lloyd LL, kaplan H. Audiometric interpretation: a manual of basic audiometry. Baltimore: university park press; 1978.