*Correspondence: S. M. Salgado. Laboratório de Experimentação e Análise de Alimentos, Departamento de Nutrição, Universidade Federal de Pernambuco. Av. Prof.Moraes Rego, s/n, Cidade Universitária, 50670-00 - Recife - PE, Brasil. E-mail: [email protected]
A
rti
Pharmaceutical Sciences vol. 47, n. 1, jan./mar., 2011
Effect of the addition of inulin on the nutritional,
physical and sensory parameters of bread
Jacira Antonia Brasil, Karina Correia da Silveira, Silvana Magalhães Salgado*,
Alda Verônica Souza Livera, Zelyta Pinheiro de Faro, Nonete Barbosa Guerra
Laboratory for Testing and Analysis of Food, Nutrition Department, Center for Health Sciences, University Federal of Pernambuco
The present work evaluated the effect of the addition of inulin on sensory, nutritional and physical parameters of white bread. Three formulations containing 0%, 6% and 10% of inulin were produced. Physical analyses of mass, volume, speciic volume, density, centesimal composition, glycemic index (GI) and qualitative descriptive sensory analyses, were carried out. The reduction in bread volume seen with 10% inulin was higher than that reported in the literature. Bread weight did not differ statistically. There was an 85% reduction in fat content for bread with 6% inulin and 86% for bread containing 10% inulin. Glycemic index in bread containing 10% inulin was lower than bread with 6% inulin and equal to inulin-free bread. A level of 6% inulin added to bread was regarded to yield good sensory quality.
Uniterms: Inulin/effect of application. White bread/analysis. Fat/substitutes. Foods/ sensory analyse.
O presente trabalho avaliou o efeito da adição de inulina sobre os parâmetros sensoriais, nutricionais e físicos do pão branco. Foram desenvolvidas três formulações contendo 0%, 6% e10% de inulina. Foram realizadas análises físicas de massa, volume, volume especíico, densidade, composição centesimal, índice glicêmico (IG) e análise sensorial descritiva quantitativa. A redução do volume do pão contendo 10% de inulina foi maior que os dados da literatura. O peso do pão não diferiu estatisticamente. Houve uma redução de 85% do teor de gordura do pão com 6% de inulina e 86% para o pão com 10% de inulina. O índice glicêmico obtido no pão com 10% de inulina foi menor do que o com 6% de inulina e igual ao sem inulina. O pão adicionado de 6% de inulina foi tido como de boa qualidade sensorial.
Unitermos: Inulina/efeitos da adição. Pão branco/análise. Gordura/substitutos. Alimentos/análise sensorial.
INTRODUCTION
With the aim of reducing the risk of non-trans-missible chronic illnesses, many bioactive constituents found in victuals are being extracted for use in a range of formulations. As an example, we can highlight the
carbo-hydrate inulin found mainly in endive roots (Cichorium
intybus L) and in other species of vegetables that grow in temperate regions.
Inulin presents a hygroscopic property and is able to reduce the available water contents during gelatiniza-tion of starch, causing carbohydrates to be less absorbed,
leading to a lower glycemia rate (Capito, Filisetti, 1999; Saad, 2006). Besides the physiologic effect on glycemia outlined, the addition of these fructans is promising as they do not alter the appearance or lavor of foods. Moreover, the substance adds softness and moistness allowing its use as a substitute for fat in starch-rich products such as cakes, biscuits as well as pasta for soup and spaghetti (Franck, 2002).
Studies carried out have determined that the addition of 5.7% of inulin to white bread as a substitute for fat, did not affect its sensory characteristics (Lajolo, Menezes,
2006). Wang et al. (2002), while studying the quality of
bread enriched with inulin, algarroba iber and pea iber, noted that its soft part was even softer, although there had been a reduction in speciic volume.
consump-tion in Brazil is just half World Health Organizaconsump-tion (WHO, 2003) recommendations of 60 kg/year, its inges-tion is important, where a signiicant proporinges-tion of the global population consume amylaceous food due to its high glycemic response. Thus, bread is recommended in moderation for diabetic and obese individuals.
Studies have shown that besides these population groups, low glycemic index food should be recommended for those harboring heart disease as well as for healthy individuals, as it contributes to better sensitivity to insulin, which it is an important factor concerning the reduction of diabetes development risk (Caruso, Menezes, 2000;
Letexier et al., 2003).
The goal of this study was to evaluate the effect of inulin addition on physical, nutritional, and sensory parameters of bread, bearing in mind the beneits of a low glycemic index food intake and knowledge on inulin’s functional and technological properties.
MATERIAL AND METHODS
Samples
Samples comprised 3 groups of bread with diffe-rent inulin proportions (0%, 6% and 10%). Each group included three repetitions using lour (100%) and inulin Raftiline HPX provided by the Bunge and the Beneo Com-panies, respectively. Pressed fresh biological yeast (4%), hydrogenate vegetal fat (6, 0 and 0%), whole milk (60%, 62%, and 63%), crystal sugar (1%) and salt (2%) were purchased at local shops in Recife-PE. White bread, used as a standard for the glycemic index, was also purchased at local shops.
The bread was processed through a direct method (AACC, 2000) in an experimental bakery at the Bunge Company.
Nutritional parameters
The centesimal composition was determined in three replicates in standard and experimental samples 1 and 2, according to the Horowitz (2002) methods: moisture content (method 935.29), ash (method 930.22-32.3.08), ethereal extract (method 963.15-31.4.02), proteins (me-thod 991.20-33.2.11), and dietary iber (985.29-45.4.08). The total carbohydrates were determined by the difference among these constituents.
The determination of glycemic index (GI) in vitro was done using an enzymatic method, according to Salgado
et al. (2006), from samples dried on a ventilated stove at
104 oC for 1 hour.
The hydrolysis curve area of glucoses was calculated by the graphic analysis program (Findgraph, 2002), based on the relationship between the reference food curve area (whi-te bread) and the hydrolysis curve of the case food studied
(Salgado et al., 2006).
Physical parameters
Physical analyses were done on three samples, in-cluding mass, speciic volume, and density measurements. Sample masses were determined on semi-analytical digital scales, and the volume was determined by the displace-ment of mustard seeds, considering the principle of water displacement through the inlow-outlow technique; the speciic volume was determined based on the volume/mass
ratio of the atmosphere (EL-dash et al., 1994).
Sensory analysis
A selected and trained sensory panel, made up of six experienced panelists, evaluated the samples using quantitative descriptive analysis (QDA); the generation of terminology and the other steps were performed ac-cording to the ABNT NBR 12806 (1993) and Stone and Sidel (2004). A 9 cm line scale was used (running from ‘‘none’’ to ‘‘very intense’’) and panelists were trained for 6 sessions of 2 hours each. The repetition, discrimination and homogeneity of the judges’ scores were checked by two-way ANOVA analysis. The development of termino-logy was based on a net grid method, whereby the products were offered to panelists, so that their differences and similarities could be listed (Dutcosky, 2007).
The bread formulation adopted in this experiment is described in the item Samples. Single samples (25 g) were introduced to panelists at room temperature (21 ± 2 ºC) in white pottery dishes covered by a watch glass, and codiied by three random digits . During the evaluation, panelists were allowed to drink water.
The three sessions were carried out in the morning (9 h), at one week intervals. The sensory test was a quanti-tative descriptive analysis, incorporating a 9 cm line scale (Stone, Sidel, 2004). The evaluated attributes of the bread were volume, crest color, shape, symmetry, and general characteristics of crust. For a 1 cm-thick sliced loaf, the aroma, color, porosity, crumb texture, lavor and unctuosi-ty (properunctuosi-ty of spreading butter on bread) were evaluated. For the latter attribute, panelists were instructed to spread butter (1g/slice) using a spatula.
color of the crust (2), shape and symmetry (2), general cha-racteristics of crust (3), crumb color (1), crumb porosity (2), texture (2), lavor (2) and unctuosity (1). The scores of each product were calculated by the adding the attribute averages multiplied by the factors. The bread samples were then classiied as good quality of bread (81 – 100 points), regular (61 – 80), bad – unacceptable quality (31 – 60) and very bad (≤30).
Statistical analysis
The data on sensory characteristics were analyzed by the Chi-square test. The parametric data were evaluated using Student’s t-test, adopting a 5% signiicance level in all cases (Statsoft, 1996).
RESULTS AND DISCUSSION
Nutritional parameters
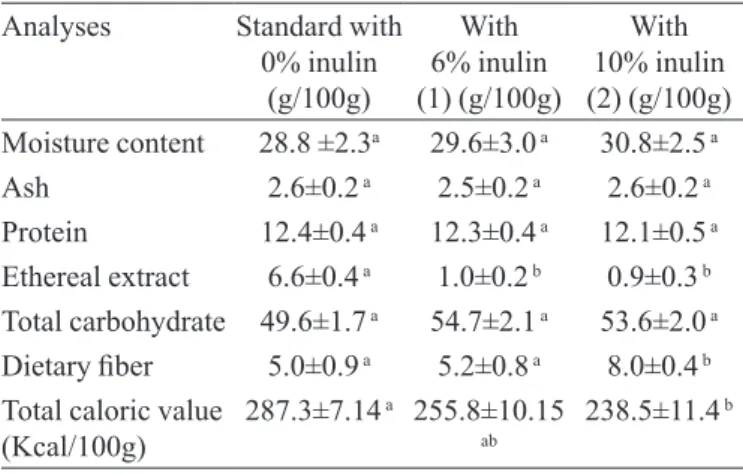
The bread centesimal composition (Table I) eviden-ces that, as expected, fat substitution caused a signiicant 85% (sample 1) and 80% (sample 2) reduction in ethereal extract, compared to the standard bread. These results enabled the bread to be classiied as light or low-fat content (Brasil, 1998). In terms of caloric value, the replacement of fat by inulin led to an 11% and 17% reduction for ex-perimental samples 1 and 2, respectively. Therefore, only the latter sample was signiicant.
In relation to dietary iber content, the addition of 6% inulin did not cause a signiicant increase in this cons-tituent. This fact can be attributed to both the sensitivity
of the analytic method and the hydrolysis of soluble ibers by enzymes produced during fermentation, or perhaps to the partial destruction of inulin during cooking (Abdul-Hamid, Siew-Luan, 2000).
Figure 1 shows that 0% inulin standard white bread and its assessment achieved a lower value on hydrolysis of carbohydrate. This result for the standard bread is likely due to the presence of fat which can encapsulate starch grains hindering enzymatic hydrolysis and its subsequent absorption (Grossmann, Barber, 1997). Inulin’s ability to absorb enough water can reduce grain intumescences and starch gelatinization thereby leading to lower hydrolysis
(Brennan et al., 2004; Tudorica et al., 2002).
The GI of standard bread with 0% inulin was 82, bread with 6% inulin was 85 and bread with 10% inulin, 82. These results showed that the proportion of inulin used
was not able to reduce in vitro GI to values less than or
equal to 75 (Lajolo, Menezes, 2006).
However, in vivo studies have shown that soluble
ibers are capable of reducing post-meal glycemic
res-ponses. A similar effect was registered by Brennan et al.,
(2004) for spaghetti with 10% added inulin. This data allow us infer that the effect of inulin on glycemia could be dependent on the process to which the food was submitted.
Comparing these research results with data reported in the literature (Table II), reveals that whole wheat bread is usually recommended for diabetic and overweight in-dividuals, as it presents a higher GI than the bread studied in the samples, except for oat bread containing 50% lour, rye, laxseed and soy.
Physical parameters
According to Table III, 10% inulin in bread produ-ced a signiicant reduction in speciic volume (41.66%) in relation to the standard sample and (38%) and compared
TABLE I - Centesimal composition of bread with added inulin
Analyses Standard with
0% inulin (g/100g) With 6% inulin (1) (g/100g) With 10% inulin (2) (g/100g) Moisture content 28.8 ±2.3a 29.6±3.0 a 30.8±2.5 a
Ash 2.6±0.2 a 2.5±0.2 a 2.6±0.2 a
Protein 12.4±0.4 a 12.3±0.4 a 12.1±0.5 a
Ethereal extract 6.6±0.4 a 1.0±0.2 b 0.9±0.3 b
Total carbohydrate 49.6±1.7 a 54.7±2.1 a 53.6±2.0 a
Dietary iber 5.0±0.9 a 5.2±0.8 a 8.0±0.4 b
Total caloric value
(Kcal/100g) 287.3±7.14
a 255.8±10.15
ab 238.5±11.4
b
*Values followed by different letters represent significant difference p<0.05
to 6% inulin bread. Similar behavior of volume reduction
was reported by Wang et al., (2002) when adding 3%
inulin to bread, and by O’Brien et al., (2003) in bread
containing 5% insulin. Studies carried out by Moinho Rio
Negro (Ferreira et al., 2001) consider ideal speciic volume
to be 4 to 5 cm3/g, which mirrors the results found for the
samples containing 0% and 6% inulin.
The density and speciic volume evidenced the relationship between the amount of solid and the fraction of air contained in baked dough. Products of higher density are associated to a high level of moisture (Esteller, Lannes, 2005). According to Grossman and
Barber (1997) and Sánchez et al., (1998) bread volume
is related to the processing method, quality and quantity of ingredients, particularly those that beneit the lour.
Wang et al. (2002) highlighted that interactions
betwe-en flour proteins and fiber added to the product, can prevent the expansion of bread during the fermentation period.
Characteristics of bread are illustrated in Figure 2. Experimental bread C showed larger alveolus and thinner
walls, thus producing many holes. These characteristics had some effect on sensory evaluation, particularly on the descriptor “crumb porosity” which obtained the lowest scores according to Figure 2. Dough presenting a high liquid content tended to produce, after baking, products with larger alveolus (Esteller, Lannes 2005).
Sensory parameters
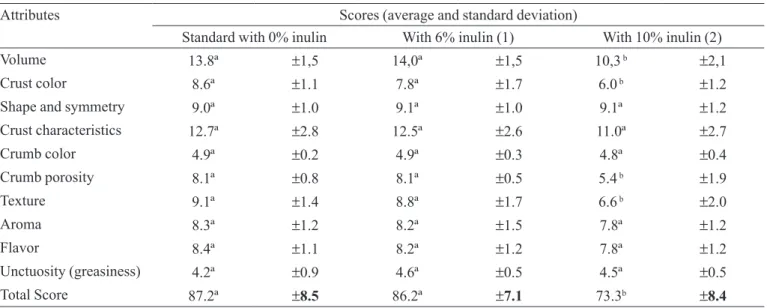
Analysis of results (Table IV and Figure 3) eviden-ces that the most inluential descriptors concerning bread evaluation were: volume, crust color, porosity and texture, on which 10% inulin in bread yielded the lowest scores,
unlike the other formulations. Sommier et al. (2005)
des-cribed several factors that interfere in the quality of bread including the quality of wheat, the dough treatment and the ingredients applied, as a result of color, lavor, volume and texture change.
The total score of experimental sample 2 was 73.3, which according to Dutcosky, (2007), corresponds to regular quality bread. The other samples, whose scores exceeded 85, were classiied as good quality bread. Wang
et al. (2002) also obtained reasonably acceptable bread, despite a reduction in specific volume, when adding
dietary staple ibers, including 3% inulin. Korus et al.,
(2006) reported a similar result in a study of gluten-free bread supplemented with prebiotics, in which good quality products were obtained by introducing 5% inulin .
TABLE III - Physical analysis of bread samples with added inulin
Physical parameters Standard Bread 0% inulin Bread with 6% inulin (1) Bread with 10% inulin (2)
Weight (g) 57 ± 1.6a 58 ± 1.5 a 59 ± 0.8 a
Volume (cm3) 269 ± 3.1 a 259 ± 19.6 a 168 ± 21.9 b
Speciic volume (cm3/g) 4.8 ± 0.1 a 4.5 ± 0.3 a 2.8 ± 0.3 b
Density (g/ cm3) 0.21± 0.01 a 0.22± 0.01 a 0.35± 0.01 a
*Values followed by different letters represent signiicant difference p<0.05. TABLE II - Glycemic index of several types of bread
Types of bread GI* GI**
White Flour bread 101 101
100% rye lour bread 95 96
80% rye lour bread 95 95
Bread with oat seed - 93
Oat bread with 50% lour - 72
Bread with rye seed 71 58
Dark Rye (black) bread 92 109
Light rye bread - 97
White bread with high iber - 96
Linseed and soy bread - 71
Whole wheat bread US
Whole wheat bread CAN -- 104102
*Source: Caruso, & Menezes, 2000.**Source: Foster-Powell, Holt, & Brand-Miller, 2002.
CONCLUSION
The 6% inulin experimental sample was sensorially rated as being of good quality. The percentage of inulin used altered the centesimal composition of the bread and consequently reduced its calories.
Although the products tested did not reach low GI values, they could be recommended to diabetics and overweight individuals for their high dietary iber content.
ACKNOWLEDGEMENTS
The authors would like to thank the BUNGE Com-pany for support in testing, and the BENEO ComCom-pany for the inulin provided, as well as the Coordenação de Aperfeiçoamento de Pessoal de Nível Superior (CAPES) for the scholarship granted to the irst author.
TABLE IV - Weighted average of scores assigned to sensorial attributes of bread with added inulin
Attributes Scores (average and standard deviation)
Standard with 0% inulin With 6% inulin (1) With 10% inulin (2)
Volume 13.8ª ±1,5 14,0ª ±1,5 10,3 b ±2,1
Crust color 8.6ª ±1.1 7.8ª ±1.7 6.0 b ±1.2
Shape and symmetry 9.0ª ±1.0 9.1ª ±1.0 9.1ª ±1.2
Crust characteristics 12.7ª ±2.8 12.5ª ±2.6 11.0ª ±2.7
Crumb color 4.9ª ±0.2 4.9ª ±0.3 4.8ª ±0.4
Crumb porosity 8.1ª ±0.8 8.1ª ±0.5 5.4 b ±1.9
Texture 9.1ª ±1.4 8.8ª ±1.7 6.6 b ±2.0
Aroma 8.3ª ±1.2 8.2ª ±1.5 7.8ª ±1.2
Flavor 8.4ª ±1.1 8.2ª ±1.2 7.8ª ±1.2
Unctuosity (greasiness) 4.2ª ±0.9 4.6ª ±0.5 4.5ª ±0.5
Total Score 87.2ª ±8.5 86.2ª ±7.1 73.3b ±8.4
*Values followed by different letters represent signiicant difference.
REFERENCES
AMERICAN ASSOCIATION OF CEREAL CHEMISTS.
Approved methods of the American Association of Cereal Chemists. 10.ed. Saint Paul: AACC, 2000. 1200p.
ABDUL-HAMID, A.; SIEW LUAN, Y. Functional properties of dietary iber prepared from defatted rice bran. Food Chem., v.68, p.15-19, 2000.
ASSOCIAÇÃO BRASILEIRA DE NORMAS TÉCNICAS.
NBR 12806: análise sensorial dos alimentos e bebidas. Rio de Janeiro: ABNT, 1993. 8p.
HOROWITZ, W. (Ed.) Official methods of analysis of the Association of Official Analytical Chemistry. 17.ed. Washington: AOAC, 2002. v.2.
BRASIL. Portaria n.27, de 13 de janeiro de 1998. Regulamento técnico referente à informação nutricional complementar. Available at: http://e-legis.anvisa.gov.br/leisref/public/. Accessed on: 25 jan. 2009.
BRENNAN, C. S.; KURI, V.; TUDORICA, C. M. Inulin – enriched pasta: effects on textural properties and starch degration. Food Chem., v.86, p.189-193, 2004.
CAPITO, S. M. P.; FILISETTI, T. M. C. C. Inulina: um ingrediente alimentar promissor. Cad. Nutr., v.18, p.1-11, 1999.
CARUSO, L.; MENEZES, E. W. Índice glicêmico dos alimentos. Nutrire,v.19, n.20, p.49-64, 2000.
DUTCOSKY, S. D. Análise sensorial de alimentos. 2.ed. Curitiba: Champagnat, 2007. 239 p.
EL-DASH, A. A.; MAZZARI, M. R.; GERMANI, R. Tecnologia de farinhas mistas: uso de farinha mista de trigo e milho na produção de pães. EMBRAPA-CTAA, v.1, p.42-88, 1994.
ESTELLER, M. S.; LANNES, S. C. S. Parâmetros complementares para ixação de identidade e qualidade de produtos paniicados. Ciênc. Tecnol. Aliment., v.25, n.4, p.802-806, 2005.
FERREIRA, S. M. R.; OLIVEIRA, P. V.; PRETO, D. Parâmetros de qualidade do pão francês. Bol. Cent. Pesqui. Process. Aliment., v.19, n.2, p.301-318, 2001.
FINDGRAPH for Windows. Vancouver: Uniphiz Lab, 2002.
FOSTER-POWELL, K.; HOLT, S. H. A.; BRAND-MILLER, J. C. International table of glycemic index and glycemic load values. Am. J. Clin. Nutr., v.76, n.1, p.5-56, 2002.
FRANCK, A. echnological functionality of inulin and oligofructose. Br. J. Nutr.,v.87, n.2, p. S287-S291, 2002.
GROSSMAN, M. V. E.; BARBER, C. B. Envejecimento del pan: efecto combinado de α- amilasa bacteriana y emulsicante en la textura e en las características amilográicas de la miga.
Arch. Latinoam. Nutr.,v.47, n.3, p.229-233, 1997.
KORUS, J.; GRZELAK, K.; ACHREMOWICZ, K.; SABAT, R. Influence of prebiotic additions on the quality of gluten-free bread and on the content of inulin and frucyooligosaccharides. Food Sci. Technol. Int.,v.12, n.6, p.489-495, 2006.
LAJOLO, F. M.; MENEZES, E. W. Carboidratos en alimentos regionales Iberoamericanos. São Paulo: EDUSP, 2006. 648 p.
LETEXIER, D.; DIASION, F. BEYLOT, M. Addition of inulin to a high carbohydrate diet reduces hepatic lipogenesis and plasma triacyglycerol concentration in humans. Am. J. Clin. Nutr., v.77, n.3, p.559-564, 2003.
O’BRIEN, C. M.; MUELLER, A.; SCANNELL, A. G. M.; ARENDT, E. K. Evaluation of the effects of fats replacers on the quality of wheat bread. J. Food Eng.,v.56, n.2, p.256-267, 2003.
SAAD, S. M. I. Probióticos e prebióticos: o estado da arte. Rev. Bras. Cienc. Farm.,v.42, n.1, p.1-16, 2006.
SALGADO, S. M.; LIVERA, A. V. S.; GUERRA, N. B.; SCHÜLLER, A. R. P.; ARAÚJO, A. L. L. Resposta fisiológica in vitro do amido do feijão macassar (Vigna unguiculata L. Walp). Braz. J. Food Technol., v.9, n.4, p.297-303, 2006.
SÁNCHEZ, H. D.; OSELLA, C. A.; TORRE, M. A. G. Mejoramiento de la calidad nutricional de pan tipo francés.
Arch. Latinoam. Nutr., v.48, n.4, p.349-353, 1998.
STATSOFT INC. Statistica for windows. Tulsa: STATSOFT, 1996.
STONE, H.; SIDEL, J. L. Sensory evaluation practices. 3.ed. Redwood City: Academic Press, 2004. 337 p.
TUDORICA, C. M.; KURI, V.; BRENNAN, C. S. Nutritional physicochemical characteristics of dietary enriched pasta.
J. Agric. Food Chem., v.50, n.2, p.347-356, 2002.
WANG, J.; ROSELL, C. M.; BARBER, C. B. Effect of the addition of different ibres on dough performance and bread quality. Food Chem., v.79, n.2, p.221-226, 2002.
WORLD HEALTH ORGANIZATION. Diet, nutrition and the prevention of chronic diseases. Geneve: WHO, 2003. 160 p. (Technical Report Series, 916).
Received for publication on 01st December 2009