*Correspondence: P. M. Scheuer. Federal University of Santa Catarina – UFSC. Rod. Admar Gonzaga, 1346, Itacorubi, 88034-001 – Florianópolis - SC, Brasil. E-mail: [email protected]
http://dx.doi.org/10.1590/S1984-82502014000400005
Effects of fat replacement on properties of whole wheat bread
Patrícia Matos Scheuer
1,*, Bruna Mattioni
1, Pedro Luiz Manique Barreto
1,
Flávio Martins Montenegro
2, Cristiane Rodrigues Gomes-Rufi
2, Sílvia Biondi
2,
Mariana Kilpp
3, Alicia de Francisco
11Federal University of Santa Catarina, UFSC, Florianópolis, SC, Brazil, 2Food Technology Institute, Campinas, SP, Brazil, 3Federal Institute of Santa Catarina, IFSC, Florianópolis, SC, Brazil
Bread characteristics are dependent upon the chemical composition and iber content of the wheat lour used. A healthy diet can help prevent chronic diseases, where whole grains and fewer calories from fat are components of a healthy diet. The aims of this study were to determine the centesimal composition of wheat lour samples (whole, reined, and lour blends) along with their farinographic parameters (water absorption, development time and stability) and also to verify the speciic volume, crumb texture proile and digital imaging of bread loaves made with 60% whole wheat lour and 3% fat or fat replacer. Increasing the whole wheat lour percentage in the blends also increased levels of protein, ash and insoluble iber. All the farinographic parameters were also increased. Enzymatically modiied starch was found to be an effective fat replacer in whole wheat loaves. The loaves made using fat replacer had the same speciic volume and higher cell density as those made with fat, but exhibited different texture proile parameters such as higher hardness value and lower springiness value.
Uniterms: Wheat lour/centesimal composition. Whole wheat bread/characteristics. Fat/replacers. Food ibers.
A composição química da farinha de trigo e a presença de ibras afeta as características dos pães. Uma forma de contribuir com a prevenção de doenças crônicas não transmissíveis é através de alimentação saudável, incluindo grãos integrais na dieta alimentar e reduzindo as calorias de determinado alimento, substituindo a gordura. Assim, este trabalho tem como objetivo determinar a composição centesimal das amostras de farinha de trigo integral, reinada e as misturas entre elas; bem como os parâmetros farinográicos (absorção de água, tempo de desenvolvimento e estabilidade) das mesmas. Além disso, veriicar volume especíico, peril de textura do miolo e análise de imagem de pães elaborados com 60% de farinha de trigo integral e com 3% de gordura ou com substituto de gordura. Os dados foram submetidos à análise de variância. À medida que aumenta o percentual de farinha integral, os teores de proteína, cinzas e ibra insolúvel alcançam valores signiicativamente maiores e a absorção de água ica maior na farinograia, bem como o tempo de desenvolvimento e a estabilidade. O amido modiicado enzimaticamente utilizado na elaboração de pão com 60% de farinha de trigo integral funcionou como um efetivo substituto de gordura. O pão integral elaborado com substituto de gordura apresentou volume especíico signiicativamente igual ao pão integral elaborado com gordura, porém com diferenças em relação a parâmetros do peril de textura, maior irmeza e menor elasticidade além de maior densidade celular do que o pão elaborado com gordura.
Unitermos: Farinha de trigo/composição centesimal. Pão de trigo integral/características. Gordura/
INTRODUCTION
Wheat is one of the ten most important commodities
globally (FAO, 2010) and numbers among the world’s ‘big three’ cereal crops in terms of harvested area. Wheat is the main staple food for approximately 35% of the world’s population (Torres, 2008).
Of all the cereal grains, wheat is unique because only wheat flour can form dough with the rheological
properties required for the production of leavened bread and the broad variety of foods that have been developed
owing to these attributes (Gianibelli et al., 2001). The
grain structure (germ, scutellum, pericarp, aleurone layer and endosperm) which is extracted by the milling process affects the wheat lour composition (Kulp, Ponte, 1981). The unique properties of the wheat grain can be attributed
primarily to the gluten-forming storage proteins of the endosperm. These dough-forming properties have made
wheat the most important source of protein in the human diet (Gianibelli et al., 2001).
Including whole-grains in the diet can impact health and lifestyle because the functional components of wheat, such as protein and iber, help reduce the risk of chronic diseases, stroke, hypertension, cardiovascular disease and cancers (Jones, Engleson, 2010), osteoporosis (USA, 2010) and obesity (Mann, Cummings, 2009). While lipids lubricate (Ghotra, Dyal, Narine, 2002) and plasticize the dough, in particular the gluten polymers (Mehta et al., 2009), fat should be restricted or reduced in the diet
because it is the most important obesity factor (Valenzuela, Sanhueza, 2008) and non-communicable chronic disease factor (Brasil, 2005a).
The American Association of Cereal Chemists
(AACC) has deined whole wheat lour as lour that has been prepared from wheat (other than durum) without altering the intact grain (AACC, 2000). All grains share
the same basic anatomical structures: an outer bran layer,
a germ fraction and a starchy endosperm (Hoseney, 1991). Grains are sources of abundant dietary iber used to fortify foods, resulting in healthier products while grains also
serve as a functional ingredient to improve the physical
and structural properties of foods (Elleuch et al., 2011).
Several national dietary guidelines suggest eating
plenty of whole-grain cereal foods without added fat (Truswell, 2002). These cereals have high starch content as their energy source and provide dietary iber, nutritious
protein plus lipids rich in essential fatty acids and
micronutrients, such as vitamins, minerals, antioxidants and phytochemicals (Dewettinck et al., 2008).
A fat replacer is an ingredient that can provide the
functions of fat yet with fewer calories (Choe et al., 2013):
from 0 to 9 kcal/g. Fat replacers mimic the sensory and physical functions of fat and confer lavor, mouth feel, texture, structure and lubricity to food (ADA, 2005).
An ideal fat replacer should have the same functionality
as fat, be partially or totally undigested, and non-toxic (Valenzuela, Sanhueza, 2008). Modiied starch is one such fat replacer. It has speciic applications such as increasing water holding capacity and minimizing starch syneresis (Miyazaki et al., 2006).
A food can be called a ‘whole-grain food’ when at least 51% of the grain ingredients are whole grains, according to the Whole Grain Council (2013). The Food and Drug Administration stipulate tha low-fat foods must contain ≤ 3 g fat per reference amount (FDA, 2010).
The aim of this study was to characterize the chemical and farinographic properties of whole wheat lour, reined wheat lour and different percentage blends of the two. Additionally, the specific volume, texture proile and image analysis of whole wheat bread made using fat or a fat replacer were analyzed.
MATERIAL AND METHODS
Material
Commercially refined wheat flour and whole wheat flour for bread making, harvested in 2012 and stored at -18 ºC, were provided by Cooperativa Agrária Agroindustrial, Guarapuava, Paraná - Brazil. Selectamyx C150 an enzymatically modiied corn starch used in this work as a commercial fat replacer, was provided by Dutch Starchs International, Netherlands. Moreover, commercial vegetable fat by Bunge (Brazil) was added to produce the
bread dough.
Different blends of whole wheat flour (WF) and refined wheat flour (RF) were prepared and encoded: 100WF (100%WF); 95.35WF (95.35%WF + 4.65%RF); 85WF (85%WF + 15%RF); 60WF (60%WF + 40%RF); 35WF (35%WF + 65%RF); 24.64WF (24.64%WF + 75.36%RF); 0% WF (100%RF).
Methods
The chemical characteristics of the flours were
measured in duplicate by AACC Approved Methods
were obtained in duplicate using Brabender Org Duisburg equipment (Brabender, Germany), model Type 820600, method 54-21 (AACC, 2000), to measure and record the resistance of the dough to mixing under experimental conditions. The bread loaves were made in duplicate according to the optimized straight dough bread-making method 10-10B (AACC, 2000) with a 60 min fermentation time and based on the following formulation: whole wheat flour (60%), refined wheat flour (40%), sucrose (6%), instant active dry yeast (1.8%), chemically pure salt- NaCl (1.5%), shortening (hydrogenated vegetable fat) or enzymatically-modiied maize starch as a fat replacer (3%), and tap water (Flander et al., 2007). The amount of water
used corresponded to 86% of the water absorption content based on the farinogram and was optimized in preliminary assays (methodology adapted from Seyer and Gélinas (2009)). The ingredients were mixed at the second speed for 6 min (Oro, 2013; Flander et al., 2007) in a mixer (Líder
model RPD 25, Brazil). The temperature of the dough was kept at 28-29 °C after mixing. Subsequently, 900-g pieces of dough were placed in a prooing cabinet (Perfecta model CFC20, Brazil) at 30 °C and 85% relative humidity for 35 min. The dough was then kneaded once, fermented for 17 min then kneaded again and fermented for the further 8 min. The dough was sheeted by hand, placed into a rectangular mold (9.5 cm × 20 cm × 4.5 cm) and fermented for 24 min. The dough was baked in a revolving oven (Líder model Ventile, Brazil) for 24 min at 180 °C. After cooling
for 1 h at room temperature on metal grids, the technological
parameters of the loaves were measured in triplicate. The inished loaves were rectangular with curved upper crust. The speciic volume (SV), a technological parameter, was determined by the rapeseed displacement method 10-05 (AACC, 2000) and measured in duplicate. The crumb texture profile analysis (TPA) was performed on eight 25 mm cubes from the center of each loaf, according to method 74-10A (AACC, 2000). The TPA was measured in duplicate with a Texture Analyzer TA-XT Plus (Stable Micro System, Surrey, UK) equipped with a 50 kg load cell and a 36 mm aluminum cylindrical probe, which underwent two double compression tests up to 40% penetration of the original height (distance of 10 mm) at a crosshead speed of 2 mm/s with a 5 s gap between compressions of the crumb cubes. Four textural parameters were extracted from the curves: hardness (force necessary to attain a given deformation), springiness (rate at which a deformed
material returns to the undeformed condition after the
deforming force is removed), cohesiveness (strength of the internal bonds making up the body of the product) and chewiness (the energy required to masticate a solid product to a state ready for swallowing) (Szczesniak, 2002).
The crumb cell analysis was performed by scanning 1-cm-thick longitudinal and cross section samples of each loaf (Pourfarzad, Mohebbi, Mazaheri-Tehrani, 2012). Images of the three slices were acquired on a scanner (Multifunctional Brother DCP – 7065DN, Japan). The
brightness and contrast parameters of the scanner program
were set to the default values (zero) for all samples. The images were saved as bitmap iles at a resolution of 150 dots per inch (dpi) in the Red-Green-Blue (RGB) color
modern and bmp format. The values of the scanned images
were obtained in pixels and converted into millimeters by using known length values. A single 40 mm x 40 mm square ield of view was evaluated for each image. The free GNU Image Manipulation Program (GIMP), USA, version 2.6, was used to make the two measurements. After cropping, the images were pre-processed and converted to greyscale (8 bit). The pre-processing (change to grey-level), segmentation (manual thresholding tool with greyscale polarization into binary images from 0 to 106) and crumb grain measurements (extraction of parameters) were carried out using the ImageJ software Fiji 1.46 freeware, USA. The following crumb grain properties were extracted and calculated: number of cells (objects); mean cell area (mm2); cell density (nº cell/mm2)
and circularity.
Analysis of variance (ANOVA) and Tukey’s test (significance level p≤0.05) were used to determine
the significance of the data. The statistical analysis
and graphical representations were performed using STATISTICA 7.0 software, Copyright StatSoft (USA), Inc. 1984-2004.
RESULTS AND DISCUSSION
Flour chemical analysis
All flour samples (whole flour, refined flour and mixes) were analyzed chemically and the results are given
in Table I.
The wheat flour moisture analysis results ranged from 11.94% for WF to 13.63% for RF. The moisture content of all of the samples followed the highest value of lour moisture (15% for RF and 13% for WF) (Brasil, 2005b).
The total protein content of the flours ranged
from 10.91% to 13.85%, corresponding to RF and WF, respectively. The protein content of WF was signiicantly higher than the other lour samples (p≤0.05).
The RF protein values agree with the results obtained by Park et al. (2010) and Barros et al. (2010).
Barros et al. (2010) and Doblado-Maldonado et al.
(2012). According to Oro (2013), variations in protein
content can be caused by differences in the percentage
of WR and RF in the flour mix. The environmental conditions and fertilization of wheat cultivars can signiicantly inluence the protein content of the resulting lour (Turnbull, Rahman, 2002).
The ash content ranged between 0.53% and 1.78% for RF and WF, respectively (Table I).
Park et al. (2010) obtained similar ash content
values for RF whereas Doblado-Maldonado et al. (2012)
reported lower ash content for WF than the level found in
the present study. The mineral fraction represented by the
ash content of wheat was located primarily in the pericarp; therefore, the ash content should be low for RF, indicating low contamination in the milling process (Chiang, Chen, Chang, 2006).
In this study, WF displayed significantly higher
protein and ash contents (Table I) (p≤0.05). These variations most likely occurred because both WF and RF were made from the same batch of grains.
The lipid content ranged from 1.74% to 2.91% (Table I) and did not differ signiicantly (p≥0.05) across the wheat lour samples.
The lipid content of the WF was 2.80%, higher than the values obtained by Oro (2013) (1.90 and 2.10%) and by Prabhasankar and Rao (2001) (1.30 and 2.00%). We found that WF had higher lipid content than RF, which agrees with the results of Chung et al. (2009).
The IDF was between the minimum value of 1.93% for RF and the maximum value of 12.30% for WF. The IDF values for 100% WF and 95.35% WF are signiicantly higher than the values of the other samples (p≤0.05). For all other samples, the signiicance of the IDF decreased as the WF percentage decreased (p≤0.05) (Table I). The
SDF content of the lours ranged from 3.17% to 1.71%. The lowest SDF value was signiicantly lower than the other values, which did not differ signiicantly (p≥0.05) (Table I).
The IDF increased proportionally to the WF percentage because whole grains have higher iber content (USA, 2010) than reined grains, as the iber is mainly located in the pericarp of wheat (Atwell, 2001). Similar results for WF IDF were observed by Seyer and Géllinas (2009).
The SDF for RF was 2.08%, consistent with the values obtained by Seyer and Géllinas (2009).
The total starch content ranged from 54.74% to 64.84% and increased with decreasing WF percentage, reaching the highest significant value (p≤0.05) for RF (0%WF).
Total starch values for high % WF were in agreement with results obtained by Fujita and Figueroa (2003).
Chanvrier et al. (2007) found a total starch content in RF
of 67%, a level similar to the results of this study.
Flour farinography
The farinographic characterization of all flour
samples (whole lour, reined lour and lour mixes) are shown in Table II.
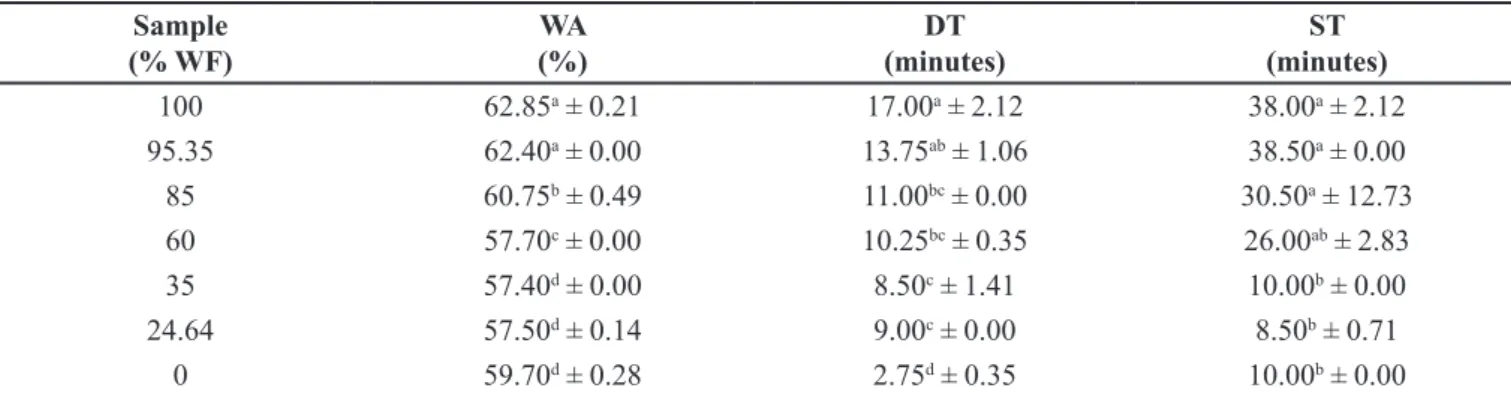
The water absorption (WA) content ranged from 57.40% to 62.85% (Table II).
Park et al. (2010) obtained similar WA contents
for RF using a mixograph. Kihlberg et al.(2004) found
similar WA contents for WF on a farinograph. WA
values signiicantly increased for higher WF percentages (p≤0.05), in line with Sudha et al. (2007) and Noort et al.
(2010). Rosell et al. (2001) reported that the differences
in WA are caused predominantly by the greater number TABLE I - Chemical characterization of lours
Sample (% WF)
Moisture (%)
Protein (%)
Ash (%)
Lipids (%)
IDF (%)
SDF (%)
Total Starch (%)
100 11.94b ± 0.12 13.85a ± 0.59 1.78a ± 0.14 2.80a ± 0.55 12.30a ± 0.25 2.90ab ± 0.23 55.46e ± 0.66
95.35 12.59ab ± 1.34 12.90b ± 0.05 1.68ab ± 0.18 2.72a ± 0.60 11.89a ± 0.07 3.17a ± 0.75 54.74e ± 0.55
85 12.50ab ± 0.56 12.88b ± 0.07 1.48abc ± 0.17 2.53a ± 0.54 10.72b ± 0.52 3.09ab ± 0.23 56.88de ± 0.85 60 12.38b ± 1.27 12.23bc ± 0.02 1.15bcd ± 0.18 2.91a ± 0.17 8.07c ± 0.09 2.55ab ± 0.17 58.57cd ± 0.73
35 13.01ab ± 0.26 11.72cd ± 0.12 0.92cde ± 0.13 1.74a ± 0.33 5.45d ± 0.25 2.09ab ± 0.06 60.86abc ± 0.08
24.64 13.04ab ± 0.52 11.62cd ± 0.10 0.76de ± 0.06 1.86a ± 0.22 3.83e ± 0.09 1.71b ± 0.06 63.33ab ± 1.04 0 13.63a ± 0.49 10.91d ± 0.07 0.53e ± 0.06 2.27a ± 0.31 1.93f ± 0.08 2.08ab ± 0.41 64.84a ± 0.34
TABLE II - Farinographic characterization of lours
Sample (% WF)
WA (%)
DT (minutes)
ST (minutes)
100 62.85a ± 0.21 17.00a ± 2.12 38.00a ± 2.12
95.35 62.40a ± 0.00 13.75ab ± 1.06 38.50a ± 0.00
85 60.75b ± 0.49 11.00bc ± 0.00 30.50a ± 12.73
60 57.70c ± 0.00 10.25bc ± 0.35 26.00ab ± 2.83
35 57.40d ± 0.00 8.50c ± 1.41 10.00b ± 0.00
24.64 57.50d ± 0.14 9.00c ± 0.00 8.50b ± 0.71
0 59.70d ± 0.28 2.75d ± 0.35 10.00b ± 0.00
Mean values ± standard deviation in the same column followed by a different letter are signiicantly different (p≤0.05), in duplicate. Farinographic properties: WA, Water Absorption (based on 14% humidity); DT, Development Time; ST, Stability. Variable: WF, Whole Wheat Flour.
TABLE III - Speciic volume and texture proile analysis of bread loaves
Samples SV
(cm3/g)
Texture proile analysis
Hardness
(g) Springiness Cohesiveness
Chewiness (g) Loaf made with fat
replacer
1.8734a ± 0.2325 1162.514a ± 357.714 0.500b ± 0.169 0.455a ± 0.122 306.19a ± 228.67
Loaf made with fat 2.0049a ± 0.1030 686.038b ± 149.166 0.672a ± 0.140 0.530a ± 0.069 241.31a ± 69.32
Mean values ± standard deviation in the same column followed by a different letter are signiicantly different (p≤0.05), in duplicate. SV, Speciic Volume.
of hydroxyl groups that exist in the iber structure, which allows for more water interaction through hydrogen bonding. WA is inluenced by protein content and starch damage caused by the milling process (Bockstaele et al., 2008; Gélinas et al., 2009), which may explain the
100% WF characterization in this study. Moreover, the iber present in WF increased the WA (Gómez, Gonzáles, Oliete, 2012).
For the development time (DT), the 100% WF (17.00 min) and 95.35% WF (13.75 min) had signiicantly higher values (p≤0.05) than the RF (2.75 min) (Table II). Kihlberg et al.(2004) found a maximum DT of 15
min for WF. DT increases when iber fractions are added
to the lour because the iber absorbs water (Noort et al.,
2010), a phenomenon also observed in the present study (17 min).
For stability (ST), the 100% WF (38.00 min) and 95.35% WF (38.50 min) had signiicantly higher values (p≤0.05) than RF (10.00 min) (Table II).
The ST values of this study agree with results obtained by Indrani and Rao (2007), who found that
dough ST can be characterized as an indicator parameter
of mixing resistance; and also mirrored the results of
Gómez et al. (2003), who found that the addition of iber
increases dough ST. Seyer and Gélinas (2009) examined RF and reported a DT of 2.6 min, ST of 10.7 min, 11.2% protein content, and 0.52% ash content. These indings are
similar to the results observed in this study.
Bread specific volume
The SV of the loaves made with 60% WF are given in Table III. No signiicant difference (p≥0.05) was found between the loaves made using the fat replacer (1.87 cm3/g) or fat (2.00 cm3/g) (Table III).
The greater SV seen in the fat loaf might have been
due to the crystalline lipid that coats the gluten proteins
and starch granules (Chin et al., 2010). The added solid
lipid uniformly distributes within the gluten network between the starch granules, forming thin and easily expandable gluten ilms with less tendency to contract after expansion (Watanabe, Yokomizo, Eliasson, 2003). Shortening works as a gas-stabilizing agent during bread making and inluences the incorporation of air into the dough (Alvarez-Jubete et al., 2010) which in turn affects
The SV value for the fat loaf agrees with results obtained for a loaf prepared with RF, which had an SV range of 1.80 to 2.05 cm3/g (El-Porai et al., 2013), and for
a loaf prepared with 100% WF, which had an SV range of 2.82 to 4.14 cm3/g (Seyer, Gélinas, 2009).
The SV value of the fat replacement loaf agrees with results obtained for bread made with 0.5% guar gum (SV of 2.5 cm3/g) (Skara et al., 2013), 1.4% β-glucan (SV of
2.26 cm3/g) (Skendi et al., 2010), 40% amaranth lour (SV
of 2.51 cm3/g) (Sanz-Penella et al., 2012) or with 10% iber
(SV of just over 2.3 cm3/g after 6 days of storage) (Rosell,
Santos, 2010).
Bread crumb texture profile analysis (TPA)
The bread crumb texture proile analysis of loaves made with 60% WF and fat replacer or fat are reported in Table III. The TPA results showed signiicant differences (p≤0.05) in bread hardness and springiness between loaves made using fat replacer (1162.514 g and 0.500, respectively) and loaves made with hydrogenated vegetable fat (686.038 g and 0.678, respectively) (Table III). No signiicant differences (p≥0.05) were observed for cohesiveness and chewiness (Table III).
Similar hardness results for bread made with fat were obtained in breads made with 10% iber mix and no fat (Rosell, Santos, 2010); in breads with 2% cellulose after 72 h of storage (Gómez et al., 2003); and in breads
made with 2.5% fat (O’Brien et al., 2003).
Similar hardness results for bread with fat replacer were obtained in breads made with 2.5% inulin powder (O’Brien et al., 2003), a carbohydrate-based fat replacer that
results in higher crumb hardness than in bread made with
fat. The increase in crumb hardness could be a consequence
of the thickening of walls surrounding the gas cells that
occurs upon the addition of hydrocolloids into bread
formulas (Rosell, Rojas, Barber, 2001). Furthermore, an
increase in bread hardness may result from a decrease in the
total area of the gas cell; greatest crumb hardness is usually observed in breads with the lowest loaf volume.
Cohesiveness is higher in loaves made with fat, as
observed by Collar et al. (1999), while more cohesive
dough results in higher SV and softer loaves.
In this study, the loaf containing fat had a softer breadcrumb than the loaf containing the fat replacer. Furthermore, the loaf made using the fat replacer had
lower springiness (capacity to return to undeformed condition after deforming force is removed from the bread) than the loaf made with fat.
Image analysis
There were no significant differences (p≥0.05) between the image analysis parameters (number of cells, mean cell area and circularity of bread loaves) for the loaves made with fat and those containing fat replacer (Table IV).
The bread made with fat replacer had signiicantly higher cell density (12255.34 nº cell/mm2) (p≤0.05) than
the bread made with fat (5688.42 nº cell/mm2) (Table IV).
The cell density was calculated by dividing the number of
cells by the mean cell area.
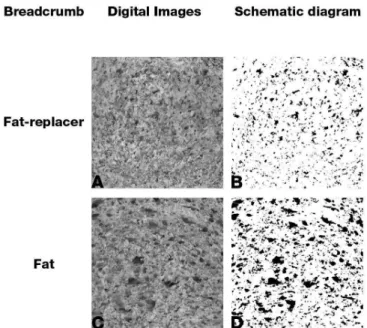
Bread made using the fat replacer had a more
compact structure (Figure 1A, 1B) with smaller pores than the bread made with fat (Figure 1C, 1D).
TABLE IV - Image analysis parameters of bread loaves
Samples Number of cells
(objects)
Mean cell area (mm2)
Cell density
(nº cell/mm2) Circularity Loaf made with fat replacer 1431.50a ± 286.37 0.117a ± 0.029 12255.34a ± 586.56 0.826a ± 0.011
Loaf made with fat 1201.50a ± 3.54 0.211a ± 0.017 5688.42b ± 301.99 0.812a ± 0.006
Mean values ± standard deviation in the same column followed by a different letter are signiicantly different (p≤0.05), in triplicate.
The bread made with fat replacer (Figure 1A, 1B) had smaller pores (cell area <0.1 mm2) and a lower cell
density than the bread made with fat (Figure 1C, 1D). These results agree with those obtained by Polaki et al.
(2010) in oat bread. The main function of the fat ingredient is to entrap air into the batter during mixing, which could explain the loss of pore size in the bread with fat replacer. When the air begins to expand, the fat crystals that are adsorbed to the air–water interface melt and release the fat–water interface for bubble expansion. Large numbers of adsorbed crystals release suficient interface to allow the bubbles to expand without rupturing (Kocer et al.,
2007). Different breadcrumb textures might be attributed
to the different amount of air incorporated into the dough as a consequence of the differing consistency of the breads
(Rosell, Santos, 2010).
According to Polaki et al. (2010), the pore
distribution reveals information about the effect on bread
structure. Pores can be small (area < 4 mm2), medium (area
4-8 mm2) or large (area >8 mm2).
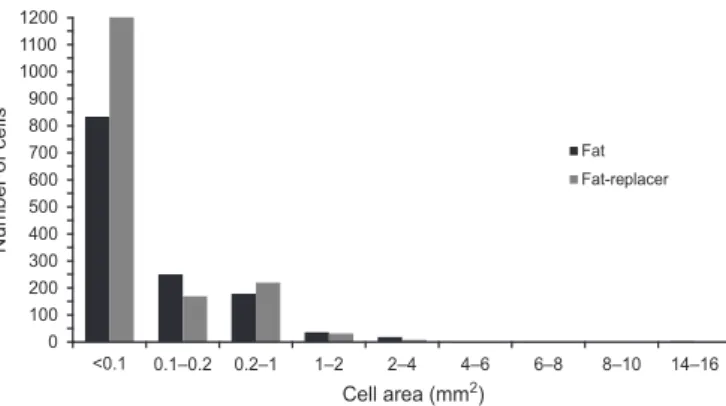
The pores of the breads made with fat (Figure 1C, 1D) and with fat replacer (Figure 1A, 1B) were characterized as small (Figure 2). Large pores, with
cell area 8-10 and 14-16 mm2, were especially evident
in breadcrumbs made with fat (Figure 2), in agreement with results obtained in polydextrose bread by Polaki et al. (2010).
No signiicant differences were observed in cell circularity between the bread made with fat replacer and the bread made with fat. Rosell and Santos (2010) showed that use of inulin, hydroxypropylmethylcellulose or locust bean gum did not inluence the mean cell area.
Bread made with fat replacer presented a smaller speciic volume, a smaller mean cell area and a higher cell density, in agreement with results found in wheat bread made with corn and oat (Hruskova et al., 2012).
FIGURE 2 - Histogram: Number of cells by cell area of loaves produced with fat and with fat replacer.
0 100 200 300 400 500 600 700 800 900 1000 1100 1200
<0.1 0.1–0.2 0.2–1 1–2 2–4 4–6 6–8 8–10 14–16
Number of
cells
Cell area (mm )2
Fat
Fat-replacer
CONCLUSION
As expected, WF (100%) had signiicantly higher values for protein, lipid, ash, iber and total starch contents than RF. Higher percentages of WF were associated with greater WA on farinograph and also increased the dough’s DT and ST. These results can be attributed to the increase in the iber, which affects the technological parameters of
the bread.
An increase in crumb hardness and a decrease in
crumb springiness were observed in breads with a fat replacer, as compared with fat-containing bread.
Enzymatically-modiied starch was found to be an effective fat replacer in whole wheat loaves - a staple food
that besides being a good source of fiber also contains
fewer calories.
ACKNOWLEDGEMENTS
The authors would like to thank the Fundação de
Amparo à Pesquisa e Inovação do Estado de Santa Catarina
(FAPESC) for the financial support, the Cooperativa Agrária Agroindustrial for providing the wheat flours and also Dutch Starchs International for providing the
commercial fat replacer.
REFERENCES
AMERICAN ASSOCIATION OF CEREAL CHEMISTS. AACC. Approved methods of analysis. 10ed. St Paul: AACC International, 2000. 1018 p.
AMERICAN DIETETIC ASSOCIATION. ADA. Position of the american dietetic association: fat replacers. J. Am. Diet. Assoc., v.105, n.2, p.266-275, 2005.
ALVAREZ-JUBETE, L.; AUTY, M.; ARENDT, E.K.; GALLAGHER, E. Baking properties and microstructure of pseudocereal lours in gluten free bread formulations. Eur. Food Res. Technol., v.230, n.3, p.437-445, 2010.
ATWELL, W.A. Wheat lour. Eagen press handbook series. St. Paul: AACC, 2001. 134 p.
BOCKSTAELE, F.V.; LEN, I.D.; EECKHOUT, M.; DEWETTINCK, K. Rheological properties of wheat lour dough and the relationship with bread volume I. Creep-recovery measurements. Cereal Chem., v.85, n.6,
p.753-761, 2008.
BRASIL. Ministério da Saúde. Secretaria de Atenção à Saúde. Coordenação Geral da Política de Alimentação e Nutrição. Guia Alimentar para População Brasileira. Série A. Normas e Manuais Técnicos. Brasília, 2005a. Available at: http:// www.sonutricao.com.br/downloads/Guia_Alimentar_ Populacao_Brasileira.pdf. Accessed on: Aug. 2014.
BRASIL. Ministério da Agricultura. Pecuária e Abastecimento. Instrução Normativa n°8 de 02 de junho de 2005b. Regulamento Técnico de Identidade e de Qualidade da Farinha de Trigo. Diário Oicial da República Federativa do Brasil, Brasília, DF, 3 jun. 2005b. Seção 1, n.105, p.91.
CHANVRIER, H.; UTHAVAKUMARAN, S.; LILLFORD, P. Rheological properties of wheat lour processed at low levels of hydration: Inluence of starch and gluten. J. Cereal Sci., v.45, n.3, p.263-274, 2007.
CHIANG, S.; CHEN, C.; CHANG, C. Effect of wheat flour protein compositions on the quality of deep-fried gluten balls. Food Chem., v.97, n.4, p.666-673, 2006.
CHIN, N.L.; RAHMAN, R.A.; HASHIM, D.M.; KOWNG, S.Y. Palm oil shortening effects on baking performance of white bread. J. Food Process Eng., v.33, n.3, p.413-433, 2010.
CHOE, J.; KIM, H.; LEE, J.; KIM, Y.; KIM, C. Quality of frankfurter-type sausages with added pig skin and wheat iber mixture as fat replacers. Meat Sci., v.93, n.4,
p.849-854, 2013.
CHUNG, O.K.; OHM, J.B.; RAM, M.S.; PARK, S.H.; HOWITT, C.A. Wheat lipids in wheat chemistry and technology. In: KHAN, K.; SHEWRY, P. R. Wheat: chemistry and technology. St. Paul: AACC, 2009. p.363-399.
COLLAR, C.; ANDREU, P.; MARTÍNEZ, J.C.; ARMERO, E. Optimization of hydrocolloid addition to improve wheat bread dough functionality: a response surface methodology study. Food Hydrocolloid, v.13, n.6, p.467-475, 1999.
DEWETTINCK, K.; BOCJSTAELE, F.V.; KÜHNE, B.; VAN DE WALLE, V.; COURTENS, T.M.; GELLYNCK, X. Nutritional value of bread: Inluence of processing, food interaction and consumer perception. J. Cereal Sci., v.48, n.2, p.243-257, 2008.
DOBLADO-MALDONADO, A.F.; PIKE, O.A.; SWELEY, J.C.; ROSE, D.J. Key issues and challenges in whole wheat lour milling and storage. J. Cereal Sci., v.56, n.2,
p.119-126, 2012.
ELLEUCH, M.; BEDIGIAN, D.; ROISEUX, O.; BESBES, S.; BLECKER, C.; ATTIA, H. Dietary ibre and ibre-rich by-products of food processing: characterisation, technological functionality and commercial applications: a review. Food Chem., v.124, n.2, p.411-421, 2011.
EL-PORAI, E.S.; SALAMA, A.E.; SHARAF, A.M.; HEGAZY, A.I.; GADALLAH, M.G.E. Effect of different milling processes on Egyptian wheat lour properties and pan bread quality. Ann. Agric. Sci., v.58, n.1, p.51-59, 2013.
FOOD AND AGRICULTURE ORGANIZATION OF THE UNITED NATIONS. FAO. For a world without hunger. Available at: http://faostat3.fao.org/home/index. html#VISUALIZE_TOP_20. Accessed on: July 2012.
FOOD AND DRUG ADMINISTRATION. FDA. Nutrition labeling and education requirements. Available at: <http:// www.fda.gov/ICECI/Inspections/InspectionGuides/ ucm114092.htm> Accessed on: Apr. 2013.
FLANDER, L.; SALMENKALLLIO-MARTILA, M.; SUORTTI, T.; AUTIO, K. Optimization of ingredients and baking process for improved wholemeal oat bread quality.
LWT – Food Sci. Technol., v.40, n.5, p.860-870, 2007.
FUJITA, A.H.; FIGUEROA, M.O.R. Composição centesimal e teor de β-glucanas em cereais e derivados. Ciênc. Tecnol. Aliment., v.23, n.2, p.116-120, 2003.
GÉLINAS, P.; MORIN, C.; REID, J.F.; LACHANCE, P. Wheat cultivars grown under organic agriculture and the bread making performance of stone-ground whole wheat lour.
Int. J. Food Sci. Technol., v.44, n.3, p.525-530, 2009.
GIANIBELLI, M.C.; LARROQUE, O.R.; MACRITCHIE, R.; WRIGLEY, C.W. Biochemical, genetic, and molecular characterization of wheat glutenin and its component subunits. Cereal Chem., v.78, n.6, p.635-646, 2001.
GÓMEZ, M.; GONZÁLES, J.; OLIETE, B. Effect of extruded wheat germ on dough rheology and bread quality. Food Bioprocess Technol., v.5, n.6, p.2409-2418, 2012.
GÓMEZ, M.; RONDA, F.; BLANCO, C.A.; CABALLERO, P.A.; APESTEGUÍA, A. Effect of dietary ibre on dough rheology and bread quality. Eur. Food Res. Technol., v.216,
n.1, p.51-56, 2003.
HOSENEY, R.C. Principios de ciencia y tecnologia de los cereales. Zaragoza: Acribia, 1991. 321 p.
H R U S K O VA , M . ; S V E C , I . ; H O F M A N O VA , T. ; DVORAKOVA, J. Image analysis – comparison of recipe composition effect. Procedia Eng., v.42, p.955-963, 2012.
INDRANI, D.; RAO, G.V. Rheological characteristics of wheat lour dough as inluenced by ingredients of parotta. J. Food Eng., v.79, v.100-105, 2007.
JONES, J.M.; ENGLESON, J. Whole grains: benefits and challenges. Annu. Rev. Food Sci. Technol., v.1, p.19-40,
2010.
KIHLBERG, I.; JOHANSSON, L.; KOHLER, A.; RISVIK, E. Sensory qualities of whole wheat pan bread – inluence of farming system, milling and baking technique. J. Cereal Sci., v.39, n.1, p.67-84, 2004.
KOCER, D.; HICSASMAZ, Z.; BAYINDIRLI, A.; KATNAS, S. Bublle and pore formation of the high-ratio cake formulation with polydextrose as a sugar- and fat-replacer.
J. Food Eng., v.78, n.3, p.953-964, 2007.
KULP, K.; PONTE, J. G. Staling of white pan bread: Fundamental causes. Crit. Rev. Food Sci. Nutr., v.15, n.1, p.1-48, 1981.
MANN, J.I.; CUMMINGS, J.H. Possible implications for health of the different deinitions of dietary ibre. Nutr. Metab. Cardiovasc. Dis., v.19, n.3, p.226-229, 2009.
MEHTA, K.L.; SCANLON, M.G.; SAPIRSTEIN, H.D.; PAGE, J.H. Ultrasonic investigation of the effect of vegetable shortening and mixing time on the mechanical properties of bread dough. J. Food Sci., v.74, n.9, p.E455-E461, 2009.
MIYAZAKI, M.; HUNG, P.V.; MAEDA, T.; MORITA, N. Recent advances in application of modiied starches for breadmaking. Trends Food Sci. Technol., v.17, n.11,
p.591-599, 2006.
NOORT, M.W.J.; HAASTER, D.V.; HEMERY, Y.; SCHOLS, H.A.; HAMER, R.J. The effect of particle size of wheat bran fractions on bread quality – Evidence for ibre – protein interations. J. Cereal Sci., v.52, n.1, p.59-64, 2010.
O’BRIEN, C.M.; MUELLER, A.; SCANNELL, A.G.M.; ARENDT, E.K. Evaluation of the effects of fat replacers on the quality of wheat bread. J. Food Eng., v.56, n.2-3,
p.265-267, 2003.
ORO, T. Adaptação de métodos para avaliação da qualidade tecnológica de farinha de trigo integral. Florianópolis, 2013. 157 p. [Thesis of PhD degree. Center of Agricultural Sciences. Federal University of Santa Catarina].
PAREYT, B.; FINNEI, S.M.; PUTSEYS, J.A.; DELCOUR, J. Lipids in bread making: Sources, interactions, and impact on bread quality. J. Cereal Sci., v.54, n.3, p.266-279, 2011.
PARK, C.; KANG, C.; CHENG, Y.; JUNG, W.; WOO, S. Inluence of puroindoline genotypes on grain characteristics, physico-chemical properties of lour and end-use quality of korean wheats. Breeding Sci., v.60, n.3, p.233-242, 2010.
POLAKI, A.; XASAPIS, P.; FASSEAS, C.; YANNIOTIS, S.; MANDALA, I. Fiber and hydrocolloid content affect the microstructural and sensory characteristics of fresh and frozen stored bread. J. Food Eng., v.97, n.1, p.1-7, 2010.
POURFARZAD, A.; MOHEBBI, M.; MAZAHERI-TEHRANI, M. Interrelationship between image, dough and Barbari bread characteristics; use of image analysis to predict rheology, quality and shelf life. Int. J. Food Sci. Tech., v.47, n.7, p.1354-1360, 2012.
PRABHASANKAR, P.; RAO, P. H. Effect of different milling methods on chemical composition of whole wheat lour. Eur Food Res. Technol., v.213, p.465-469, 2001.
ROSELL, C.M.; ROJAS, J.A.; BARBER, C.B. Inluence of hydrocolloids on dough rheology and bread quality. Food Hydrocolloid, v.15, n.1, p.75-81, 2001.
SANZ-PENELLA, J.M.; WRONKOWSKA, M.; SORAL-SMIETANA, M.; HAROS, M. Effect of whole amaranth lour on bread properties and nutritive value. LWT - Food Sci. Technol., v.50, n.2, p.679-685, 2013.
SEYER, M.; GÉLINAS, P. Bran characteristics and wheat performance in whole wheat bread. Int. J. Food Sci. Technol., v.44, n.4, p.688-693, 2009.
SKARA, N.; NOVOTNI, D.; CUKELJ, N.; SMERDEL, B.; CURIC, D. Combined effects of inulin, pectin and guar gum on the quality and stability of partially baked frozen bread.
Food Hydrocolloid, v.30, n.1, p.428-436, 2013.
SKENDI, A.; BILIADERIS, C.G.; PAPAGEORGIOU, M.; IZYDORCZYK, M.S. Effects of two barley β-glucan isolates on wheat lour dough and bread properties. Food Chem., v.119, n.3, p.1159-1167, 2010.
SUDHA, M.L.; VETRIMANI, R.; LEELAVATHI, K. Inluence of ibre from different cereals on the rheological characteristics of wheat lour dough and on biscuit quality.
Food Chem., v.100, n.4, p.1365-1370, 2007.
SZCZESNIAK, A.S. Texture is a sensory property. Food Qual. Prefer., v.13, n.4, p.215-225, 2002.
TORRES, G.A.M. Proteínas de reserva do trigo: o pão ou o biscoito nosso de cada dia (2008). Available at: <www. agrolink.com.br/cereaisdeinverno/NoticiaDetalhe. aspx?codNoticia=62613> Accessed on: Jan. 2008.
TRUSWELL, A.S. Cereal grains and coronary heart disease.
Eur. J. Clin. Nutr., v.56, n.1, p.1-14, 2002.
TURNBULL, K.M.; RAHMAN, S. Endosperm texture in wheat.
J. Cereal Sci., v.36, n.3, p.237-337, 2002.
UNITED STATES OF AMERICA. Department of Agriculture and Department of Health and Human Services. Dietary guidelines for americans, 2010. 7.Ed. Washington: Government Printing Office. Available at: <www. dietaryguidelines.gov> Accessed on: Mar. 2012.
VALENZUELA, A.; SANHUEZA, S. Lípidos estructurados y los sustitutos de grasas: los lípidos del futuro. Aceites y Grasas, v.3, n.72, p.532-540, 2008.
WATANABE, A.; YOKOMIZO, K.; ELIASSON, A.C. Effect of physical states of nonpolar lipids on rheology, ultracentrifugation, and microstructure of wheat flour dough. Cereal Chem., v.80, n.3, p.281-284, 2003.
WHOLE GRAINS COUNCIL. WGC. A quick quiz on whole grains. Available at: <http://wholegrainscouncil.org/iles/6.
Standards+Deinitions.pdf> Accessed on: Apr. 2013.
Received for publication on 23rd August, 2013