A Work Project, presented as part of the requirements for the Award of a Masters Degree in Economics from the Faculdade de Economia da Universidade Nova de
Lisboa.
A HAPPINESS INDEX OF HUMAN DEVELOPMENT
Carina da Conceição Filipe Number 239
Work Project presented as part of the requirements of the Master Degree in Economics, with the supervision of:
2
Abstract
Nowadays many social scientists defend the advantages to define a measure of well being able to complement the GDP per capita. This work project proposes a new index of human development: the happiness index. Many studies have been undertaken in order to determine the best measurement of happiness. Happiness is much more than just feeling good, it is also living and doing well. Thus, in order to create a measure of happiness, it is required to evaluate all factors that intervene and, on the other hand, to consider the best practices, combining growth, environmental sustainability and efficiency.
The estimation was made based on data for 83 countries, and then applied to 130 countries in the period 1997-2005. Countries with the highest GDP per capita or Human Development Index are not the ones with the higher happiness index.
3
1.
Introduction
Dr Richard Suzman, associate director of the National Institute on Ageing, (US National Institutes of Health), said: “The construction of a national well-being account that supplements the measure of gross national product with a measure of aggregate happiness is a revolutionary idea.” and also: “A national well-being account, similar to the gross domestic product, would give us a better understanding of how changes in policy and social trends affect quality of life.”
Happiness economics is the study of a country´s quality of life through the combination of several areas, such as economics, psychology and sociology. The level of happiness reported by people depends on its actual context and on each conception and dimension of happiness. The economics of happiness aims complement the income-based measures of welfare with measures of well-being in order to evaluate a country´s relative success. So it is very difficult to measure, quite subjective, but some studies suggest that can be created an effective measure of happiness.
4 On happiness surveys, both developed and developing countries show significant differences in what concerns happiness. Developed countries are on the top, but in fact some developing countries, as for example Costa Rica, Mexico and Panama perform better than some developed ones. According the Happy Planet Index 2005, top countries are developing countries, being the majority Latin American.
Costa Rica performs relatively well in most indices, namely in the World Database of Happiness. Some reasons to these good results from Costa Rica might be by being one of the few countries that abolished its army (in 1949), investing largely in education; have beaches in both sides of country, preserves nature (it is an ecological pioneer), have a good gender equality ranking, better than United States, in the World Economic Forum Gender Gap Index. As expected, given that more education leads to better health, life expectancy increased. On the other hand, Latin countries generally perform well in happiness and one reason is because their culture, family and friends are very important and so the social capital is above the financial capital.
The present work project aims to create a new measure of well-being based on data related to happiness and country-level measures of some indicators that can improve the well-being. After defining the weight of the variables based on the model, it will be computed the happiness level of countries for the years 1997-2005. Furthermore, the 2005 results will be related with some other existing indices. Based on the happiness index that it is proposed in the work project, the international comparisons of countries can be done through the joyful disposition of their inhabitants and not on goods and services they produce.
5 view, Section 4 presents the model and the data used and Section 5 discusses the results. The main conclusions are summarized on Section 6.
2.
Existing Indices
Given the increasing need to measure how well or bad people live, there are already some indices that have as objective measure the well-being of countries.
The GDP per capita is a measure of growth, but being an average of individual income does not take into consideration inequalities between people. Nevertheless, GDP per capita is still one of the most common measure used in economics.
The Human Development Index (HDI) which is supposed to capture more than GDP per capita, it is based on life expectancy, GDP per capita; and the educational attainment index1.
This index has been criticized since its creation; in fact, in its computation, equal weights are given to its component indices (1/3) and it does not take into consideration the poverty within countries. Therefore, it becomes just an average of the components involved. D. K. Despotis (2005) proposed a new measure in which instead of a simple rank of countries, human development is benchmarked on the basis of empirical observations of best practice countries. The arguments are that the human development of a country should be benchmarked against best practice countries and also that the weights of the component indices should be directly derived by the data themselves.
1
6 There are already indices related to happiness but none is considered fully complete. It is the case of the Happy Planet Index that relates ecological footprint, life expectancy and self-reported happiness. The Happy Planet Index (July 2006), an index of human well-being and environmental impact, was built in order to challenge the GDP and the HDI, which do not take into consideration the sustainability of the planet. This index seeks to be a measure of the environmental efficiency of supporting the well-being in a given country. In the Happy Planet Index of 2005, developing countries perform much better than developed ones. Costa Rica is in first place, followed by Dominican Republic and Jamaica, while developed countries as Singapore, Switzerland or the United States are respectively in the 49th, 52nd and the 114th position. From these conclusions the wealthiest countries are not the most effectives and no country scores well in all categories. As cons, the Happy Planet Index makes no explicit use of income or income-adjusted measures, it uses both objective and subjective data and it combines fundamental inputs (planetary resources consumption) and ultimate ends (well-being). Graph 1 reports the HPI scores for the different world regions, as well as the scores of each component (life satisfaction, life expectancy and ecological footprint).
Graph 1. Happy Planet Index, 2005
Source: Happy Planet Index 2.0
0 20 40 60 80 100 120 140 160
Central America, Mexico & Carribean Australia & NZ Western Europe Southern Europe Middle East / South West Asia East Africa South Asia Wealthy East Asia Central Asia & Caucuses Russia, Ukraine & Belarus
7 Another index is the Gross National Happiness, a concept introduced by the King of Bhutan (1972), as an alternative to GDP. The Gross National Happiness tries to satisfy four pillars: the promotion of sustainable development, the preservation and promotion of cultural values, the conservation of the natural environment and the establishment of good governance. However, it lacks a specific definition.
The Happy Life Years relates self-reported happiness with life expectancy. The Satisfaction with Life Index is an attempt to illustrate the average self-reported happiness (subjective life satisfaction) in different nations. This is an example of the recent trend to use direct measures of happiness, such as surveys asking people how happy they are, as an alternative to traditional measures of policy success to GDP or GNP.
The advantage of the new measure proposed in this work project, is that it is based on component indicators weights derived as a result of an estimation process, and therefore less arbitrary and contestable.
3.
What can influence Happiness?
3.1 Specialists’View
Some of economists studying Happiness are Richard Easterlin (Easterlin’s Paradox), Alberto Alesino, Andrew Oswald, Carol Graham, among others.
8 it tends to disappear. Graph 2 reports information about life satisfaction and Gross National Income (GNI) per capita, in 2005. Important countries, such as USA, Japan and UK, are labeled. Mexico stands out for its lower GNI per capita and high life satisfaction score.
Graph 2. Life satisfaction vs. GNI per capita, 2005
Note: Each circle is a country, with diameter proportional to population.
Source: Happy Planet Index 2.0; World Bank
Happiness scores are not comparable across people; they might change over time. The sense of happiness adapts itself to changes in the level of income, along the life cycle course, but it depends on factors as socio-economic status or the educational level (Easterlin, 1974). When income rises, people want more, they move up to another level of happiness, they look forward to more spare time, or better health, but the differences in the happiness feeling between socio-economic groups, at least, remain the same. Higher educated and the very rich people tend to be happier than the poor ones, confirming the traditional assertion that “money buy happiness”. Fluctuations of happiness and income are positively correlated over time. However, according the
DNK FIN FRA GER GRE IT NOR PTR ESP SWE SZD UK Australia JPN Korea NZ CAN USA MEX 5,0 5,5 6,0 6,5 7,0 7,5 8,0 8,5 9,0
0 10000 20000 30000 40000 50000 60000 70000
L if e S a t is fa c t io n
9 Easterlin Paradox – this is true only within countries, given that happiness, that is to say, life satisfaction, it is characterized by diminishing marginal gains. It increases only up to a maximum point known as the “saturation point”, and in that sense, as countries get richer; they do not get happier necessarily. Nevertheless, the trend has been increasing life satisfaction, at least in mostly OECD countries as it is observed in graph 3. Actually, United States and Canada are both highly developed countries and even overall life satisfaction suffered a decrease from 2000 until 2006. Therefore, Economic growth does not guarantee improvement in the average level of happiness, except for low-income countries.
Graph 3. Life Satisfaction in OECD countries (change index 2000-2006)
Source: Society at a Glance 2009 –OECD Social Indicators
Alesino, Di Tella and MacCulloch (2004) argue that individuals have a lower tendency to report themselves happy when they face high inequality. In their opinion, this is more evident in Europe than in USA, due to mobility of people and political reasons.
Oswald (1999) states that wealth seems not bring as much contentment as the about the expected. The reported happiness is higher among people who are: highly educated, female, have higher income, young or old (not middle-aged), married, retired, looking after the home and that are self-employed. Whereas unemployment, divorce and
10 severe ill-health contribute to individual’s sadness. In what concerns education, higher educated people are happier maybe because transmits a sense of higher security.
Graham ( June 2005),states that the economics of happiness can help explain the differences between the standard measures of poverty and inequality as well as the reported measurement of welfare in countries in the process of integration in the global economy. The vulnerability of poverty is difficult to measure at a micro level. Self-reports of well-being might enhance the knowledge of poverty and inequality dynamics Surveys can in fact reveal many elements that are not captured by income measures alone, and thus it might improve our understanding about the real effects of the globalization process.
According to Graham (June 2005), as countries become richer, indicators like morbidity, mortality, literacy rates or enrollment in school improve as well. Healthier, more educated, employed and married people have generally a higher level of happiness. On the other hand, factors like crime make people unhappy. But in a certain way the Easterlin Paradox is confirmed: if after a certain point income does not matter, after a certain level, long term gains in education and health also do not make people happier. After basic needs are met, the increase in income does not make people happier, which it might be inference that there is nothing that policymakers can do to improve people happiness.
11
3.2 My hypothesis
In order to determine the level of happiness, several variables related to human development can be applied. By assuming that people have a good access to health care and education, they are employed and inflation is not high, they are above the poverty line, children do not work, there are a good environmental performance, a good access to drinkable water sources and sanitation conditions, gender differences are very small and countries are democratic, it is possible to argue that the main conditions for happiness are found. In the next section, these variables are presented in a more detailed form.
3.2.1. Income
Norberg (2005) shows that reported well-being depends on income but just up to a certain level. However, this level is not well specified, i.e., after basic needs are met, income becomes less important. This means that GDP can be seen as inappropriate since most people do not have as ultimate aim to be rich, but to be happy and healthy. Consequently individuals tend to care more about rising aspirations, relative income differences and security of gains. If a given individual is able to escape from poverty, it might continues to be unhappy thanks to the insecurity feeling and the fear of falling back into poverty again. In order to study the relative success of a country, GDP do not inform about the inequalities in the country, how bigger the inequality is within a country, and how unhappier people are.
12 middle, upper middle or high income countries established by the International Monetary Fund.
Based on an article published in The Economist (2006) rich countries are generally happier than the poor but the rich ones do not get happier as they get richer. They do not think that doing well is enough; people also want to do better than their similar and so people would like work less but just if other people work less also.
The fact that people have active lifestyles and work a lot can represent higher levels of happiness, but it is difficult to clearly identify the level from which people prefer have also some spare time. So this variable would not be considered in this study.
Countries with similar degrees of development can differ greatly in terms of income inequality and in this way they resent lower levels of well-being. Richer countries should not be taken necessarily as the happiest ones, given it depends on socio economic factors.
3.2.2. Health and Education
13 Higher access to education within a country may influence happiness. The more education is publicly provided, the less unequal will be the country and the happiness levels. Otherwise, given that agents are not all born with the same abilities, education could be considered as a luxury good.
Income causes “good” health and the transfer of income from rich to poor makes health more accessible for all population, increasing well-being in general. However, health is not determined by absolute but relative income. People with poor income do have also poor health, but again, after a certain limit, the income does not influence health as much. Increases in income causes improvements in health and in this way decrease the mortality. If health is low there can be inability of work, contributing for the early retirement. When countries are rich enough, and income inequality not significant, there is no further effect on mortality rates. So, health may follow the same pattern that income; after a certain point, happiness does not depend so much on these variables. Poverty in developing countries has as consequence higher rates of infant and child mortality.
3.2.3. Employment and Inflation
14 3.2.4. Environment
The environment will also be considered in the present index construction through the CO2 (Carbon Dioxide) emissions. The country that emits less CO2 will be more sustainable in the future. Other indicators of environment and sustainability of a given country is the ecological footprint. This computes how many planets are needed to sustain the lifestyle of current lifestyles, i.e., it compares human demand with planet Earth's ecological capacity to regenerate, representing the amount of biologically productive land and sea area needed to regenerate the resources that are consumed and wasted by the human population. But there is not sufficient data to include this. The other measure is The environmental performance index regards also environmental questions since it focuses on information about core pollution and resource management issues. This index contains a mixture of some “measured” data sets and some “modeled” indicators with a degree of imputation for missing data; it contains 25 indicators.
3.2.5. Inequality
Growth does not ensure poverty reduction, as Graham (June 2005) stresses out. If inequality increases with growth, the probability is that rich people become richer, and there is not poverty reduction. If we link to the question of environmental protection, it can there be growth without a major damage for environment; there are good alternatives “friends” of the planet.
15 because there is dominance of political parties committed to better provision of social welfare, to the reduction of inequalities, poverty and insecurity within countries.
3.2.6. Democracy
Institutional conditions have systematic and sizeable impact on individual well-being, in addiction to demographic and economic factors. Institutions tend to be stable along time in which facilitates to the analysis of happiness dynamics. The fact that in a democratic system people can participate actively and freely choose the government contributes to a general increase in the level of well-being. Democracy definition should include government based on majority rule and the consent of the governed, the existence of free and fair elections, the protection of minorities and respect for basic human rights; it presupposes equality before the law, due process and political pluralism. A political system in which there are few opportunities for improvement of life on strictly individual terms it is expected to decrease people’s hopes and desires. The government choice indicates the citizens’ preferences.
The Economist created a democracy index that it will be used on the construction
of the index
3.2.7. Other factors:
Globalization can influence the levels of happiness, if people have better understanding about the lifestyles of people in other countries and knowledge allows them to feel more or less happy.
16 People with the highest well-being are those ones who live where social and political institutions are effective, mutual trust is high and corruption is low, and not necessarily in the richest countries, where in some case inequality is high. If life expectancy is high and disease incidence is lower, people are happier, wealthier and healthier will live more years, enjoying them.
Considering both child mortality and child labor high, as it happens in the poorest countries, economic and social development creates effective conditions to its decreasing. If child mortality is high, fertility is higher too. Child survival is determined by income and parents have some control on it providing better health care and nutrition. But in poor countries fertility is seen as important due to its contribution to higher family income given that there are more persons to work.
4.
Computing the Index
4.1. The Model
I estimate an Ordinary Least Squares (OLS) regression taking as dependent variable the country-level happiness and as independent variables the mortality rate of children under 5 years, the incidence of tuberculosis, the carbon dioxide emissions and the income groups. The coefficients obtained from this regression will provide the weights for each variable necessary to compute the happiness index.
17 The data for the dependent variable is from 1995 until and including 2005, the ideal would be have data just for 2005 but as it is a continuous register and they do not do the same question every time to each country is the only way to obtain data related to happiness. As there is not data from 1995 for independent variables it will be considered just the last year, 2005. It will be considered in the beginning 83 countries and after that, with the estimation results, it will be computed the happiness level for 130 countries that have data for independent variables for each one of the 9 years.
The equation stays like this:
ଶ5 ଷ ସ2
ହ ! ! ଼"#
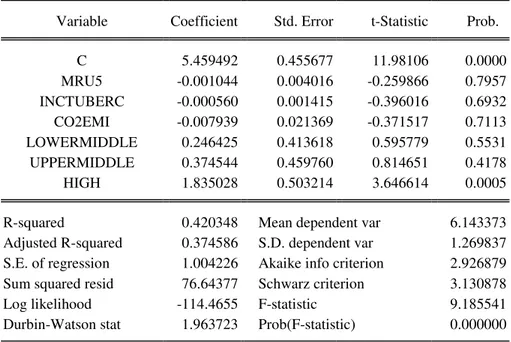
Table 1 reports the empirical results. The mortality rate, carbon dioxide emissions and incidence of tuberculosis have a negative influence, of respectively 0,001, 0,0006 and 0,008 in happiness, although not statistically significant. The income affects positively and how richer, happier. A low income country has no influence once was dropped to effects of computations (the four dummies are perfectly collinear), a lower middle income, upper middle income and high income countries influence positively in 0,246, 0, 375 and 1,835 respectively, they are statistically significant.
With the weights the equation stays:
5,459 ' 0,001 * 5 ' 0,0006 * '
0,0082 * 0 * ! 0,246 * !
18
4.2.
The Data
Life satisfaction was taken from Ruut Veenhoven’s World Database of Happiness, a database of continuous register, where life-satisfaction is assessed by means of surveys in general population samples. The mean scores may be inflated in some countries, due to under sampling of rural and illiterate population. The data is from 1995 until, and including, 2005. The ideal would be having data just for 2005 but as it is a continuous register and they do not do the same question every time to each country is the only way to obtain data related to happiness. The estimation was made based on data for 83 countries, and then applied to 130 countries in the period 1997-2005.
If mortality rate of under-five is high, it means that health is not good in the country. In what concerns the incidence of tuberculosis, is higher in less developed countries and it is a signal of poor health. Finally, CO2 emissions will measure the environment question.
19
5.
Results
Computing the happiness levels for the 9 years with the help of the Eviews program, can be seen that the how richer the country, how happy it is. But have to be considered that there is a lot of omitted variables that may be correlated with income (education, unemployment,…), so income cannot have so much influence as the results say. Nevertheless analyzing data (Table 2) as it is we can see that in 2005 Germany was in first place with a happiness level of 7,286, followed by Denmark with 7,285 and in the third place it is Iceland with 7,472, between 1997 and 2005 the country with the higher happiness level was Germany in 2005. In the last positions are: in last: Zambia with a happiness level of 4,959, in penultimate is Kenya with 4,968 and in antepenult Sierra Leone with 4,970.
The happiness index presents the higher average for the 130 countries in 2005 (5,881) and the lower in 1998 (5,819). The higher standard deviation is in 2001 (0,797) and the lower in 1998 (0,780).
20 Comparing with other indices (Table 1), for the year 2005, we can see that the results differ a lot. Looking at the Happy Planet Index, It has Costa Rica in first place and Germany in the 51th position (total of 143 countries), as it was mentioned early, in this new index Germany is in 1st place and Costa Rica in 38th. The Human Development Index in 2005 had Iceland in 1st place (total of 183 countries), Germany in the 22nd and Denmark in 14th. Taking a look to GDP per capita, in 2005 the country with the highest value was Luxembourg followed by Norway and then Singapore, in this happiness index Luxembourg is in the 31st place, Norway in the 22nd and Singapore in 25th. So this happiness index´s rank differs greatly from GDP rank.
Taking a look at the means of independent variables (Table 3), the mortality rate of under five years decreased from 1997 to 2005 presenting an average of 65,2 deaths per 1000 children with less than 5 years in 1997 and 51,6 deaths in 2005. The incidence of tuberculosis increased during this period in more than 11 infected between 100000 people. The emissions of carbon dioxide also increased from 4,346 metric tons per capita in 1997 to 4,631 in 2005. In relation to income groups, the number of low income countries decreased during the period under study and the others groups of income had a positive evolution.
6.
Conclusion
21 The main objective of this paper was to try arranging a good measure of happiness, based on some specialists’ findings and to perceive which the necessary conditions for people to feel properly good are. However, there was not sufficient data available, so just some of the variables mentioned were considered. With these ones can be observed that income has a bigger influence than the one that was expected by some authors, such as Easterlin (1974). The other variables had the expected sign, excluding adolescent fertility rate.
Taking into account that the results differ considerably from other indices, countries with the higher HDI level or GDP per capita are not the happiest ones presented here.
22
References
• “Economics discovers its feelings Not quite as dismal as it was”, Dec 19th 2006,
The Economist; Printed edition;
• 2010 Environmental Performance Index, Yale Center for Environmental Law & Policy and Center for International Earth Science Information Network;
• Abdallah, Saamah, Thompson, Sam, Michaelson, Juliet, Marks, Nic and Steuer, Nicola, June 2009, “The Happy Planet Index”, New Economics Foundation;
• Alesina, Albert, Tella, Rafael Di, and MacCulloch, Robert, 2004, “Inequality and Happiness: are Europeans and Americans Different?”, Journal of Public Economics 88 (2004), 2009-2042;
• Brittan, Samuel, Nov 2001, “Happiness is not Enough”, Speech on Templeton Lecture Inst. of Economic Affairs;
• Conrad, Fred R., Jan 2010, “The Happiest People”, New York Times;
• Deaton, Angus, Mar 2003, “Health, Inequality, and Economic Development”,
Journal of Economic Literature, Vol. 41, 113-158;
• Despotis, D. K., “A Reassessment of the Human Development Index Via Data Envelopment Analysis”, The Journal of the Operational Research Society, Vol 56, No 8 (Aug 2005), 969-980;
• Di Tella, Rafael and MacCulloch, Robert, 2006, “ Some Uses of Happiness Data in Economics”, Journal of Economic Perspectives, Vol 20, No 1, 25-46;
• Easterlin, Richard A. (1974) "Does Economic Growth Improve the Human Lot?" in Paul A. David and Melvin W. Reder, eds., Nations and Households in Economic
Growth: Essays in Honor of Moses Abramovitz, New York: Academic Press, Inc. ,
89-125;
• Easterlin, Richard A., Sep 2006, “Explaining Happiness”, PNAS, vol. 100 no. 19 11176-11183
• Frey, Bruno S. and Slutzer, Alois, 2000, “Happiness, Economy and Institutions”, Working Paper No 15, The Economic Journal, No 110, 918-938;
• Graham, Carol, June 2005, “Globalization, Poverty, Inequality, and Insecurity – Some Insights from Economics of Happiness”, Research Paper No 2005/33, World Institute for Development Economics Research;
• Graham, Carol, 2005, “The Economics of Happiness Insights on Globalization From a Novel Approach, World Economics, Vol 6, No3;
• Kekic, Laza, 2007, “The Economist Intelligence Unit’s index of democracy”, The
23
• Marks, Nic, Abdallah, Saamah, Simms, Andrew and Thompson, Sam, 2006, “The Unhappy Planet Index, An Index of Human Well-Being and Environmental Impact”,
New Economics Foundation;
• Norberg, Johan, 2005, “The Scientist’s Pursuit of Happiness”, The Centre for
Independent Studies;
• OECD(2009), Society at a Glance 2009 - OECD Social Indicators;
• Oswald, Andrew, Dec 1999, “A Non-Technical Introduction to the Economics of Happiness”, published by Institute of Chartered Accountancy
• Revkin, Andrew C., Oct 2005, “A New Measure of Well-Being From a Happy Little Kingdom, New York Times;
• Strulik, Holger, Jul 2004, “Child Mortality, Child Labour and Economic Development”, The Economic Journal, Vol. 114, No 497, 547-568;
• Tella, Rafael Di, MacCulloch, Robert J. and Oswald, Andrew J., Nov 2003, “The Macroeconomics of Happiness”, The Review of Economics and Statistics, 85(4):809-827;
• Templeton, Sarah-Kate, Dec 2004, “Happiness in the New Economics”, Times Online;
24
Appendices
A. Results
Table 1: Results of OLS estimation using happiness index as dependent variable Dependent Variable: HAPPINESS
Method: Least Squares Sample: 1 83
Variable Coefficient Std. Error t-Statistic Prob.
C 5.459492 0.455677 11.98106 0.0000 MRU5 -0.001044 0.004016 -0.259866 0.7957 INCTUBERC -0.000560 0.001415 -0.396016 0.6932 CO2EMI -0.007939 0.021369 -0.371517 0.7113 LOWERMIDDLE 0.246425 0.413618 0.595779 0.5531 UPPERMIDDLE 0.374544 0.459760 0.814651 0.4178 HIGH 1.835028 0.503214 3.646614 0.0005
R-squared 0.420348 Mean dependent var 6.143373 Adjusted R-squared 0.374586 S.D. dependent var 1.269837 S.E. of regression 1.004226 Akaike info criterion 2.926879 Sum squared resid 76.64377 Schwarz criterion 3.130878 Log likelihood -114.4655 F-statistic 9.185541 Durbin-Watson stat 1.963723 Prob(F-statistic) 0.000000
Where:
MRU5: Mortality rate, under-5 (per 1,000);
INCTUBERC: Incidence of tuberculosis (per 100,000 people); CO2EMI: CO2 emissions (metric tons per capita);
LOWERMIDDLE: Lower middle income countries; UPPERMIDDLE: Upper middle income countries; HIGH: High income countries.
Table 2: Results and comparison of rankings
Happiness level
Country 1997 1998 1999 2000 2001 2002 2003 2004 2005
Happiness Rank
2005
GDP per capita
Rank 2005
Human Development
Index Rank 2005
Happy Planet Index Rank 2005
25
France 7,270 7,271 7,271 7,272 7,273 7,273 7,274 7,274 7,275 4 19 10 71 Greece 7,265 7,266 7,267 7,269 7,270 7,271 7,271 7,272 7,273 5 24 24 97 Sweden 7,247 7,248 7,248 7,248 7,248 7,240 7,240 7,240 7,248 6 13 6 53 Finland 7,235 7,236 7,236 7,237 7,237 7,238 7,238 7,239 7,240 7 16 11 59 Switzerland 7,234 7,235 7,235 7,244 7,237 7,237 7,245 7,245 7,237 8 6 7 52 Malta 5,749 5,781 7,235 7,243 7,244 7,245 7,237 7,237 7,237 9 29 34 44 New
Zealand 7,217 7,225 7,217 7,217 7,218 7,218 7,219 7,227 7,227 10 26 19 103
…… …… …… …… …… …… … …… …… …… …… …… …… …… …… … …
Sri Lanka 5,648 5,649 5,649 5,642 5,643 5,644 5,645 5,646 5,646 61 74 99 22 Macedonia 5,616 5,611 5,615 5,619 5,621 5,631 5,633 5,634 5,635 62 53 69 111 Syria 5,626 5,628 5,629 5,631 5,634 5,636 5,638 5,632 5,634 63 70 108 38 Nicaragua 5,347 5,353 5,358 5,364 5,369 5,373 5,378 5,382 5,632 64 99 110 11 Armenia 5,374 5,374 5,374 5,374 5,376 5,624 5,626 5,628 5,630 65 78 83 48 Paraguay 5,620 5,621 5,622 5,623 5,624 5,625 5,626 5,627 5,628 66 88 95 55 Guatemala 5,603 5,605 5,608 5,610 5,613 5,615 5,618 5,620 5,622 67 67 118 4 Belarus 5,601 5,598 5,597 5,599 5,604 5,608 5,609 5,601 5,609 68 47 64 104 Dominican
Republic 5,582 5,585 5,588 5,590 5,593 5,596 5,598 5,600 5,603 69 81 79 2 Algeria 5,604 5,597 5,597 5,597 5,597 5,598 5,598 5,598 5,598 70 57 104 40
…… …… …… …… …… …… … …… …… …… …… …… …… …… …… … …
Mali 5,059 5,063 5,068 5,072 5,076 5,080 5,085 5,089 5,093 121 100 173 132 Nigeria 5,109 5,106 5,104 5,094 5,090 5,087 5,085 5,088 5,091 122 97 158 115 Chad 5,132 5,124 5,117 5,109 5,102 5,095 5,091 5,090 5,089 123 95 170 109 Cambodia 5,036 5,041 5,046 5,052 5,057 5,062 5,067 5,072 5,077 124 91 131 80 Ethiopia 5,053 5,050 5,048 5,053 5,043 5,033 5,026 5,031 5,060 125 112 169 124 Mozambique 5,056 5,052 5,049 5,045 5,042 5,038 5,039 5,046 5,053 126 116 172 133 Congo,
Dem. Rep. of the
5,089 5,079 5,070 5,061 5,052 5,044 5,031 5,031 5,031 127 71 168 120
Sierra Leone 4,994 4,992 4,992 4,990 4,988 4,985 4,981 4,976 4,970 128 119 177 136 Kenya 5,162 5,136 5,108 5,082 5,059 5,031 5,005 4,987 4,968 129 93 148 125 Zambia 4,954 4,952 4,942 4,944 4,932 4,930 4,920 4,940 4,959 130 117 165 127
Mean 5,826 5,819 5,831 5,846 5,847 5,842 5,856 5,864 5,881
Standard
Deviation 0,788 0,780 0,790 0,796 0,797 0,785 0,790 0,784 0,790
Maximum 7,280 7,281 7,282 7,284 7,284 7,284 7,285 7,285 7,286
Minimum 4,954 4,949 4,942 4,944 4,932 4,930 4,920 4,940 4,959
B. Data Sources
• Happiness Index: World Database of Happiness, Report 2006;
• Mortality rate, under-5 (per 1,000) - World Development Indicators CD-Rom 2007;
26
• CO2 emissions (metric tons per capita) – World Bank’s Database;
• GNI per capita, Atlas method (currentUS$) - International Monetary Fund, World Economic Outlook Database, October 2009;
• GDP per capita: International Monetary Fund, World Economic Outlook Database, October 2009;
• Human Development Index: Human Development Report 2007 2008, “Fighting Climate Change: Human Solidarity in a Divided World”, UNDP
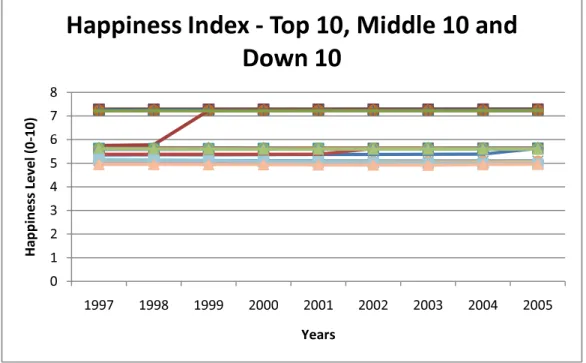
Graph 4: The Top 10, some in the middle and the last 10 in 2005 – Evolution1997-2005
Table 2: Classification of Countries by Income Group:
World Bank GNI per capita Atlas method (current US$) Analytical Classifications
Data for calendar year : 1997 1998 1999 2000 2001 2002 2003 2004 2005
Low income <= 785 <= 760 <= 755 <= 755 <= 745 <= 735 <= 765 <= 825 <= 875
Lower middle income
786-3,125 761-3,030 756-2,995 756-2,995 746-2,975 736-2,935 766-3,035 826-3,255 876-3,465
Upper middle income
3,126- 9,655 3,031-9,360 2,996-9,265 2,996-9,265 2,976-9,205 2,936-9,075 3,036-9,385 3,256-10,065 3,466-10,725 High income > 9,655 > 9,360 > 9,265 > 9,265 > 9,205 > 9,075 > 9,385 > 10,065 > 10,725 0 1 2 3 4 5 6 7 8
1997 1998 1999 2000 2001 2002 2003 2004 2005
H a p p in e ss L e v e l (0 -1 0 ) Years
27 Table 3: Descriptive Statistics
Life Satisfaction (0-10) Years 1995-2005
Mean 5,956 Standard Deviation 1,379
Maximum 8,500
Minimum 2,446
Mortality rate, under-5 (per 1,000) Incidence of tuberculosis (per 100,000 people) CO2 emissions (metric tons per capita) Low Income Lower Middle Income Upper Middle Income High Income 1997
Mean 65,164 129,987 4,346 0,369 0,246 0,154 0,231
Standard Deviation 67,985 137,004 5,092 0,484 0,432 0,362 0,423 Maximum 276,900 668 31 1 1 1 1 Minimum 4,300 4,167 0 0 0 0 0
1998
Mean 63,393 132,818 4,238 0,362 0,246 0,169 0,223
Standard Deviation 66,560 141,494 5,088 0,482 0,432 0,376 0,418 Maximum 269,500 679,116 33 1 1 1 1 Minimum 4 4,022 0 0 0 0 0
1999
Mean 61,653 135,143 4,231 0,362 0,238 0,169 0,231
Standard Deviation 65,162 146,423 5,046 0,482 0,428 0,376 0,423 Maximum 260,700 690,417 32 1 1 1 1 Minimum 4 4,310 0 0 0 0 0
………..
2003
Mean 55,088 142,059 4,462 0,315 0,277 0,169 0,238 Standard Deviation 60,260 165,542 5,350 0,466 0,449 0,376 0,428 Maximum 231,400 737,533 32 1 1 1 1 Minimum 3 2,484 0 0 0 0 0
2004
Mean 53,178 141,670 4,562 0,300 0,269 0,192 0,238 Standard Deviation 59,129 166,129 5,557 0,460 0,445 0,396 0,428 Maximum 229,100 749,805 34 1 1 1 1 Minimum 3 2,665 0 0 0 0 0
2005