New molecular evidence supports the species status of Kaempfer’s
Woodpecker (Aves, Picidae)
Lorena de Sousa Azevedo
1, Alexandre Aleixo
2, Marcos Pérsio Dantas Santos
3, Iracilda Sampaio
1,
Horacio Schneider
1, Marcelo Vallinoto
1and Péricles Sena do Rêgo
11
Instituto de Estudos Costeiros, Universidade Federal do Pará, Bragança, PA, Brazil.
2
Coordenação de Zoologia, Museu Paraense Emílio Goeldi, Belém, PA, Brazil.
3
Laboratório de Ecologia e Zoologia de Vertebrados, Instituto de Ciências Biológicas,
Universidade Federal do Pará, Belém, PA, Brazil.
Abstract
Kaempfer’s Woodpecker (Celeus obrieni) is the only species of the genus Celeus endemic to Brazil. The description of this taxon as a subspecies of the Rufous-headed Woodpecker (Celeus spectabilis) was based on a single speci-men. WhileC. obrieni and C. spectabilis are now considered separate species based on morphological and limited molecular evidence, no study has critically tested the reciprocal monophyly and degree of evolutionary independ-ence between these taxa with several specimens. Herein, fragments of the mitochondrial and nuclear DNA of three recently-collected specimens ofC. obrieni were analyzed to evaluate the degree of evolutionary differentiation of this taxon with respect toC. spectabilis. The results confirm the reciprocal monophyly between the specimens of C. obrieni and C. spectabilis. The genetic divergence values for the two taxa also support their classification as inde-pendent species, given that they are greater than the values recorded among other closely-related but separate spe-cies of the same genus. Estimates of the divergence time betweenC. obrieni and C. spectabilis indicate that cladogenesis occurred in the mid-Pleistocene, during a period of major climatic fluctuations and landscape change, consistent with the hypothesis of a corridor of open bamboo dominated forests and woodland stretching.
Keywords: Bamboo, biogeography,Celeus obrieni,Celeus spectabilis, taxonomy. Received: September 20, 2012; Accepted: January 29, 2013.
Introduction
The woodpeckers of the genusCeleusare endemic to the Neotropics. At the present time, 10 species are recog-nized (Remsenet al., 2012), of which, nine are found in Brazil. The Kaempfer’s Woodpecker (Celeus obrieniShort 1973) is the onlyCeleusendemic to this country (Winkler and Christie, 2002; CBRO, 2011).
Celeus obrieni(Short 1973) was originally described as a subspecies of the Rufous-headed Woodpecker (Celeus spectabilis), based on a specimen collected in 1926 by Emil Kaempfer in the region of Uruçuí, in the Brazilian state of Piauí (Hidasiet al., 2008). More than thirty years later, the South American Classification Committee (SACC - Rem-senet al., 2012) re-evaluated the status ofCeleus s. obrieni
based on a comparison of plumage characters with speci-mens ofC. spectabilisfrom Ecuador, Peru, and Bolivia, and concluded thatobrieniwas a distinct species. The total lack of new records over almost a century led some
orni-thologists to believe that the taxon had become extinct (Tobias et al., 2006). The first record since the original
specimen collected by Emil Kaempfer was obtained only in 2006, when the species was rediscovered in Goiatins, in the northeast of the Brazilian state of Tocantins, some 400 km from the type locality (Prado, 2006).
Subsequently, several new records were obtained from the state of Maranhão (Santos and Vasconcelos, 2007; Santoset al., 2010), in addition to the states of Tocantins (Pinheiro and Dornas, 2008), Goiás (Dornaset al., 2009; Pinheiro et al., 2012), and Mato Grosso (Dornas et al., 2011). All of these new records extended the known geo-graphic range of C. obrieni quite considerably. Even though, the size of the species population has yet to be de-fined, since its rediscovery more than 50 individuals have been recorded within an area extending more than one thousand kilometers between extreme localities of distribu-tion. Despite this expansion in the known range of the spe-cies, currently estimated at some 280,000 km2(Benz and
Robbins, 2011; BirdLife International, 2011), a cautious estimate of the total population is 50-250 individuals, www.sbg.org.br
Send corresponce to Péricles Sena do Rêgo. Laboratório de Genética e Biologia Molecular, Instituto de Estudos Costeiros, Universidade Federal do Pará, Alameda Leandro Ribeiro S/N, 68.600-000 Bragança, PA, Brazil. E-mail: [email protected].
which is consistent with the IUCN critically threatened (CR) category (IUCN, 2010).
Recently, Benz and Robbins (2011) published a phy-logeny for the genusCeleusbased on molecular and
mor-phological data, including the genetic material from the holotype ofC. obrieni, collected in 1926. This specimen
was identified as the sister taxon ofC. spectabilis, as
pre-dicted by the traditional classification. In their study, four mitochondrial (ND2, ND3, ATP6-8/COIII, and the Control Region) and two nuclear markers (Intron 7 of theb -fibri-nogen gene and HMGN2) were analyzed, although only the ND2 and ND3 genes and part of the HMGN2 sequence were amplified successfully forC. obrieni(Benz and Rob-bins, 2011). The results indicated a genetic divergence of approximately 1% betweenC. obrieni andC. spectabilis
for the mitochondrial marker ND2. The authors suggested that further sampling would be needed to confirm the recip-rocal monophyly of these forms and their status as distinct evolutionary lineages (Benz and Robbins, 2011). Nonethe-less, Benz and Robbins (2011) treated species treatment for
C. obrieni.
In the present study, a multi-locus molecular ap-proach was used to confirm the validity of the species status ofC. obrieni, an essential initial step in the development of
a conservation plan for this threatened taxon. Three re-cently collected specimens ofC. obrieniwere sequenced,
together with individuals representing three other species of the genus (C. spectabilis,Celeus undatusWaved
Wood-pecked, and Celeus grammicus Scale-breasted
Wood-pecked) to estimate phylogenetic relationships and pair-wise genetic distances within this group.
Materials and Methods
Sampling
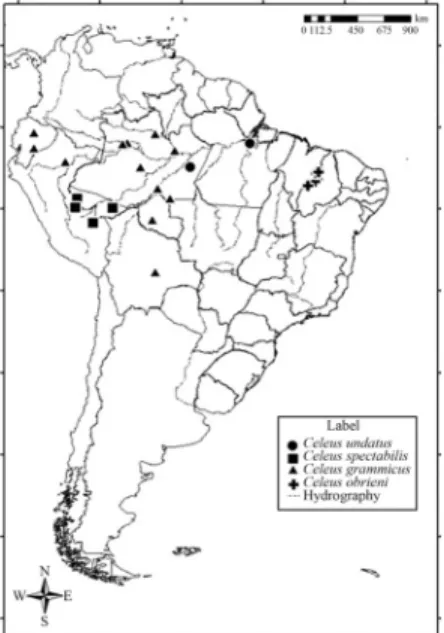
Three specimens of C. obrieni were collected by
MPDS during surveys of bird populations at three sites in the Brazilian state of Maranhão (Figure 1, Table 1) - Serra da Raposa, (06º35’S, 43º37’W), in the municipality of São João dos Patos (specimen registered in the Museu Paraense Emílio Goeldi [MPEG] under the accession number 61549), Fazenda Castiça (05°28’ S, 43°13’W), in the mu-nicipality of Matões (MPEG 69978), and Fazenda Normasa (05°36’S, 43°28’W), in the municipality of Parnarama (MPEG 69979). Specimens were collected under special li-cense 20902-1 issued to MPDS.
Samples of muscle tissue were obtained from each of the three specimens ofC. obrieni, together with 16 samples
of specimens representing three otherCeleusspecies -C. spectabilis(n= 5),C. undatus(n= 2), andC. grammicus
(n= 9) - all of which were provided by the ornithological
collection of the Goeldi Museum (Table 1). Samples ofC. undatusandC. grammicus, two sister lineages historically
regarded as separate species by traditional taxonomy and close toC. obrieni / spectabilis(Benz and Robbins, 2011),
were included in the analysis so that genetic distances be-tween these species pairs could be contrasted. The samples were divided into aliquots and kept frozen at -20 °C until processing in the UFPA Genetics and Molecular Biology Laboratory.
Extraction, amplification and sequencing of the DNA
Once the samples were processed, the genetic mate-rial was extracted using the standard phenol-chloroform protocol, followed by precipitation in sodium acetate and isopropanol (Sambrook et al., 1989). The samples were
then electrophoresed in 1% agarose gel, stained with ethi-dium bromide and viewed under an UV transilluminator to the confirm the successful extraction of genetic material, its integrity and concentration. Using specific primers, the polymerase chain reaction (PCR) technique was used to amplify three regions of the mitochondrial genome (rDNA 16S, Cytochromeb, subunit 2 of the NADH dehydrogenase
region) and one nuclear marker, intron 7 of theb-fibrinogen
gene. The primers described by Sorenson et al.(1999)
-L-15298 and H-16064 - were used for the cytochromeb
gene (Cytb), and those presented by Palumbiet al.(1991)
-L-1987 and H-2609 -for the rDNA 16S (16S) gene. For subunit 2 of the NADH dehydrogenase region (ND2), the primers described by Hackett (1996) were used - H-6313 and L-5215. Part of intron 7 of the b-fibrinogen gene (I7BF) was amplified using the primers (FIB-BI7U and FIB-BI7L) described by Prychitko and Moore (1997).
Each reaction was conducted in a final volume of 25mL, containing 4mL of the deoxynucleotides (1.25 mM), 2.5mL of 10xTaqbuffer, 1mL of MgCl2(25 mM), 0.5mL
of each primer (200 ng/mL), approximately 80 ng of the
to-tal DNA extracted from the samples, 0.25mL ofTaq
merase (5 U/mL, Taq DNA Polymerase, Recombinant
-Invitrogen) and sterile distilled water to complete the final reaction volume. The PCR for each of the genetic markers was run in a thermocycler (GeneAmp, PCR System 9700 -Applied Biosystems). For the mitochondrial markers
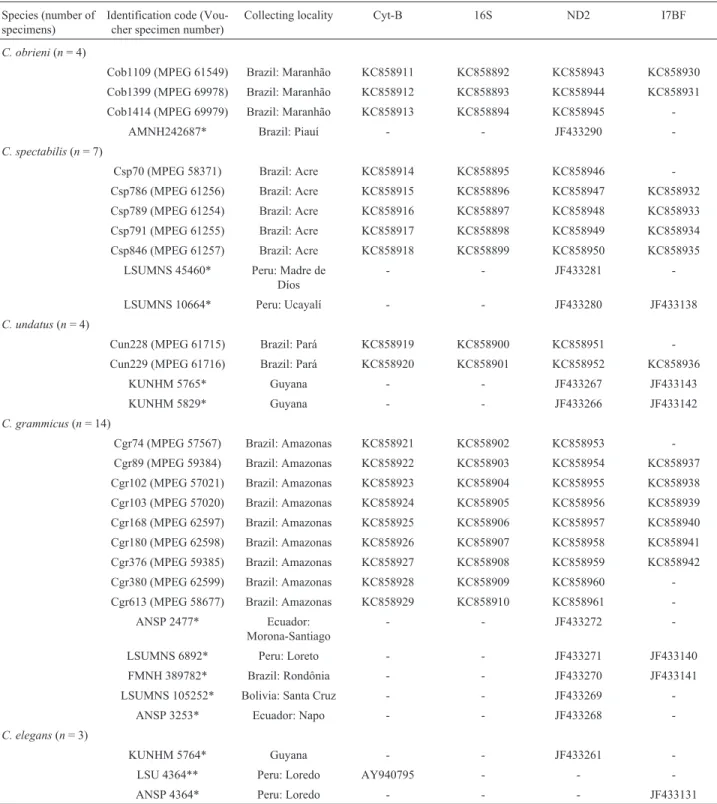
(rDNA 16S, Cyt b, and ND2), the protocol began with 3 min at 94 °C, followed by 35 cycles of 30 s at 94 °C, one minunte at 55 °C, two min at 72 °C, with a final extension of 7 min at 72 °C. For the nuclear fragment (I7BF), the pro-tocol was 3 min at 94 °C, followed by 35 cycles of 20 s at Table 1-Celeusspecimens analyzed in the present study, showing the species name, number of specimens analyzed, identification code, collecting local-ity, and GenBank accession numbers for the sequences of the different molecular markers analyzed.
Species (number of specimens)
Identification code (Vou-cher specimen number)
Collecting locality Cyt-B 16S ND2 I7BF
C. obrieni(n= 4)
Cob1109 (MPEG 61549) Brazil: Maranhão KC858911 KC858892 KC858943 KC858930 Cob1399 (MPEG 69978) Brazil: Maranhão KC858912 KC858893 KC858944 KC858931 Cob1414 (MPEG 69979) Brazil: Maranhão KC858913 KC858894 KC858945
-AMNH242687* Brazil: Piauí - - JF433290
-C. spectabilis(n= 7)
Csp70 (MPEG 58371) Brazil: Acre KC858914 KC858895 KC858946 -Csp786 (MPEG 61256) Brazil: Acre KC858915 KC858896 KC858947 KC858932 Csp789 (MPEG 61254) Brazil: Acre KC858916 KC858897 KC858948 KC858933 Csp791 (MPEG 61255) Brazil: Acre KC858917 KC858898 KC858949 KC858934 Csp846 (MPEG 61257) Brazil: Acre KC858918 KC858899 KC858950 KC858935
LSUMNS 45460* Peru: Madre de Díos
- - JF433281
-LSUMNS 10664* Peru: Ucayalí - - JF433280 JF433138
C. undatus(n= 4)
Cun228 (MPEG 61715) Brazil: Pará KC858919 KC858900 KC858951 -Cun229 (MPEG 61716) Brazil: Pará KC858920 KC858901 KC858952 KC858936
KUNHM 5765* Guyana - - JF433267 JF433143
KUNHM 5829* Guyana - - JF433266 JF433142
C. grammicus(n= 14)
Cgr74 (MPEG 57567) Brazil: Amazonas KC858921 KC858902 KC858953 -Cgr89 (MPEG 59384) Brazil: Amazonas KC858922 KC858903 KC858954 KC858937 Cgr102 (MPEG 57021) Brazil: Amazonas KC858923 KC858904 KC858955 KC858938 Cgr103 (MPEG 57020) Brazil: Amazonas KC858924 KC858905 KC858956 KC858939 Cgr168 (MPEG 62597) Brazil: Amazonas KC858925 KC858906 KC858957 KC858940 Cgr180 (MPEG 62598) Brazil: Amazonas KC858926 KC858907 KC858958 KC858941 Cgr376 (MPEG 59385) Brazil: Amazonas KC858927 KC858908 KC858959 KC858942 Cgr380 (MPEG 62599) Brazil: Amazonas KC858928 KC858909 KC858960 -Cgr613 (MPEG 58677) Brazil: Amazonas KC858929 KC858910 KC858961
-ANSP 2477* Ecuador: Morona-Santiago
- - JF433272
-LSUMNS 6892* Peru: Loreto - - JF433271 JF433140
FMNH 389782* Brazil: Rondônia - - JF433270 JF433141
LSUMNS 105252* Bolivia: Santa Cruz - - JF433269
-ANSP 3253* Ecuador: Napo - - JF433268
-C. elegans(n= 3)
KUNHM 5764* Guyana - - JF433261
-LSU 4364** Peru: Loredo AY940795 - -
-ANSP 4364* Peru: Loredo - - - JF433131
94 °C, 15 s at 50 °C, and 1 min at 72 °C, with a final exten-sion of 7 min at 72 °C.
The amplified products were purified using an ExoSAP-IT kit (Amersham Pharmacia Biotech. Inc., UK). The purified samples were used for the sequencing reac-tion, using the dideoxy-terminal method (Sanger et al., 1977) with reagents of the Big Dye kit (ABI PrismTMDye
Terminator Cycle Sequencing Ready Reaction - Applied Biosystems, USA), following the manufacturer’s instruc-tions. Reagents not incorporated during the reaction were eliminated through ethanol washes. The gene fragments re-sulting from this sequencing reaction had their nucleotide sequences determined by an ABI 3500 automatic sequencer (Applied Biosystems). Sequences obtained from GenBank for the Cytb(Webb and Moore, 2005), ND2, and I7BF seg-ments (Benz and Robbins, 2011) were also used in the pres-ent analysis (see Table 1 for access numbers).
Sequence alignment
The sequences obtained by electrophoresis were aligned automatically using the CLUSTAL-W application (Thompsonet al., 1994), with the parameters suggested by
Schneider (2007). The file generated by this procedure was converted into the FASTA format and transferred to the BioEdit sequence editor (Hall, 1999) for visual inspection of the alignment and possible correction of the codification of observed insertions or suppressions. The nucleotide composition, transition/transversion rates, polymorphic sites, and divergence rates (P distances) within and between species were calculated using the MEGA software, version 4.0. (Tamuraet al., 2007). The DnaSP program, version
5.10 (Librado and Rozas, 2009) was used to determine the haplotypes obtained, and the Network program, version 4.6 (Bandeltet al., 1999) was used to produce a haplotype
net-work.
Statistical analyses
The best fitting evolutionary model for each separate gene region and the concatenated data was determined by the Akaike Information Criterion (AIC), run in jModeltest 0.1.1 (Posada, 2008). The phylogenetic arrangements of the species were obtained using the PAUP* program, v. 4.0b 10 (Swofford, 2002), for the production of maximum parsimony (MP) and maximum likelihood (ML) trees, with the bootstrap support for nodes being based on 1000 pseu-do-replicates (Felsenstein, 1985), which provides an esti-mate of the confidence limits for the arrangement of each tree. The Bayesian Inference analysis was run in MrBayes v3.0b4 (Huelsenbeck and Ronquist, 2001) with three heated chains and one “cold” chain, each with five million generations, sampled every 100 generations, with the appli-cation of the stopping rule command. The sequences of the speciesCeleus elegans- Chestnut Woodpecker were
ob-tained from GenBank (Table 1) for use as the outgroup to root the phylogenetic arrangements.
The BEAST 1.7.2 program (Drummond and Ram-baut, 2007) was used to visualize the phylogenetic relation-ships among the different taxa by generating species trees using the *BEAST procedure (Heled and Drummond, 2010), with 60 million generations. This approach is based on the prior selection of the most appropriate evolutionary model for each gene, which is adapted to the database for the generation of the species tree. This approach contrasts with the simple concatenation of the different models, with only a single model being selected for the concatenated data. The results of this analysis were visualized in Tracer v. 1.5 (Drummond and Rambaut, 2007) to determine the quality of the Markov chain search process. The trees were visualized and edited in FigTree v. 1.3.1 (Drummond and Rambaut, 2007). The divergence time among the Celeus
species was estimated based on a relaxed molecular-clock analysis of the species tree, assuming a 2.1% nucleotide substitution rate per million years for Cyt b (Weir and
Schluter, 2008), using the *BEAST methodology imple-mented in BEAST 1.7.2 software.
Results
A total of 3113 base pairs were sequenced, of which 2234 belonged to the mitochondrial markers (ND2, Cytb,
and 16S), while the other 879 represent the nuclear seg-ment, I7BF. The analyses were complemented by se-quences obtained from GenBank, belonging to the four species analyzed here, together withC. elegans(Webb and
Moore, 2005; Benz and Robbins, 2011), which was used as the outgroup for the phylogenetic analyses. No evidence was found that the mitochondrial segments analyzed here may have been nuclear copies (NUMTs) of the mitochon-drial genome, based on standard analytical criteria (La-cerdaet al., 2007; Rêgoet al., 2010).
The nucleotide composition of the mitochondrial se-quences was broadly similar among the four species, with an AT content of 51% for the mitochondrial sequences and 64% for the nuclear ones. Most changes in the mitochon-drial sequences were transitions, at rates four to ten times higher than those recorded for transversions, indicating a lack of saturation in the sequences. This ratio was more bal-anced (ts/tv = 1.7) for the nuclear I7BF segment. A total of 28 amino-acid substitutions were recorded for the two cod-ing regions (Cytband ND2). Of these, 10 were exclusive to
C. obrieniandC. spectabilis.
A total of 66 variable sites were identified for Cytb,
97 for ND2, 16 for 16S, and nine for I7BF in the 19Celeus
specimens examined. In all, 170 of these 188 sites were in-formative for phylogenetic analysis. There were 36 vari-able sites betweenC. obrieniandC.spectabilis, of which
26 were informative for parsimony analysis, with ND2 and Cytb, once again, being the most variable.
diver-gence was observed in Cytband ND2, with lower levels being observed in 16S and I7BF. Divergence betweenC. obrieni and C. spectabilis was much higher for Cyt b
(1.3%) and ND2 (1.2%) than that observed between C. undatusandC. grammicus- Cyt b (0.5%) and ND2 (0.7%). The haplotype network for Cytband ND2 indicated a clear differentiation betweenC. obrieniandC. spectabilis, with no shared haplotypes (Figure 2). As expected for a rela-tively well-conserved marker, the 16S fragment presented only a single haplotype for each species, separated by two mutations.
The most appropriate evolutionary models selected by the jModeltest program for the Bayesian Inference (BI)
criterion of the four markers were HKY (rRNA 16S), TPM3uf+G (Cytb), HKY+I (ND2), and F81 (I7BF). The topology obtained for the species tree indicated a high de-gree of statistical support for both the C. obrieni / C. spectabilisand theC. undatus /C. grammicusgroupings (Figure 3). Similarly, the phylogenetic analyses of the con-catenated data provided by the MP, ML, and BI approaches confirmed the results of the species tree, particularly the distinction betweenC. obrieni and C. spectabilis, which represent two reciprocally monophyletic groups, with branch support values of over 95% in all the analyses (data not shown). The estimated divergence time obtained based on the Cytbmarker indicated that the cladogenesis ofC. obrieniandC. spectabiliswas probably completed between 400,000 and 800,000 years ago, which coincides with the mid-Pleistocene (Figure 3).
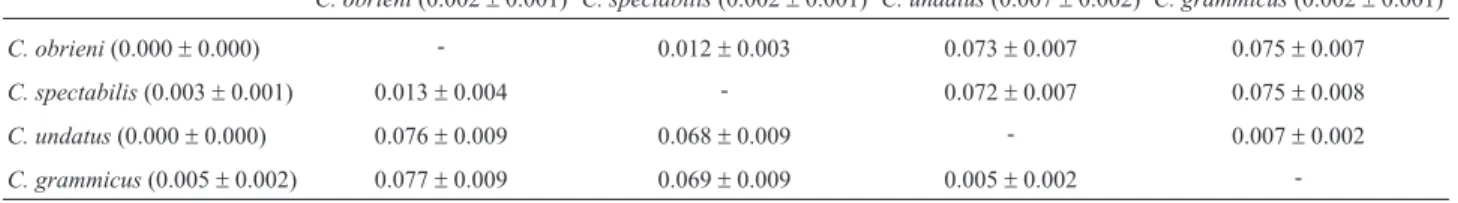
Table 2- Mean pairwise distances (p distances) and standard deviations forCyt b(752 bps; below the diagonal) and ND2 (1041 bps; above the diagonal) for the fourCeleusspecies analyzed in the present study. Intraspecific distances in parentheses.
C. obrieni(0.002±0.001) C. spectabilis(0.002±0.001) C. undatus(0.007±0.002) C. grammicus(0.002±0.001)
C. obrieni(0.000±0.000) - 0.012±0.003 0.073±0.007 0.075±0.007
C. spectabilis(0.003±0.001) 0.013±0.004 - 0.072±0.007 0.075±0.008
C. undatus(0.000±0.000) 0.076±0.009 0.068±0.009 - 0.007±0.002
C. grammicus(0.005±0.002) 0.077±0.009 0.069±0.009 0.005±0.002
-Table 3- Mean pairwise distances (p distances) and standard deviations for 16S (441 bps; below the diagonal) and I7BF (879 bps; above the diagonal) for the fourCeleusspecies analyzed in the present study. Intraspecific distances in parentheses.
C. obrieni(0.001±0.001) C. spectabilis(0.000±0.000) C. undatus(0.000±0.000) C. grammicus(0.001±0.000)
C. obrieni(0.000±0.000) - 0.002±0.001 0.004±0.002 0.004±0.002
C. spectabilis(0.000±0.000) 0.005±0.003 - 0.002±0.002 0.002±0.002
C. undatus(0.000±0.000) 0.034±0.008 0.029±0.007 - 0.000±0.000
C. grammicus(0.000±0.000) 0.036±0.008 0.032±0.008 0.002±.002
-Figure 2- Haplotype networks forCeleus obrieni(black circles) and Celeus spectabilis(white circles) for three molecular markers - Cytb(A), ND2 (B), and I7BF (C). Haplotypes are represented by circles, the sizes of which are proportional to their frequencies. Numbers on the lines that join the circles correspond to the positions of the divergent nucleotides in the region studied.
Discussion
The conservation of species is often hampered by the uncertain taxonomic status of different forms, and the reli-able definition of such status is a primary preoccupation in conservation biology (Assiset al., 2006). The use of
molec-ular techniques is fundamental to the analysis of the taxo-nomic status of most uncertain forms (Silveira and Olmos, 2007; Lacerdaet al., 2007), although this approach is
lim-ited by the need for an adequate supply of biological mate-rial from which DNA can be isolated. Celeus obrieni
presents a good example of the importance of this ap-proach, given that the existence of a single specimen, de-posited at the American Museum of Natural History in New York in 1926, was used for the confirmation of the species status of this form in relation toC. spectabilis(Benz and
Robbins, 2011). However, the availability of only a single specimen from almost a century ago led these authors to emphasize the need for a larger sample in order to confirm the reciprocal monophyly of these forms, and the reliability of the evolutionary lineages identified. The present study provides additional support for the status ofC. obrienias a
valid species, distinct fromC. spectabilis, thus
reconfirm-ing the findreconfirm-ings of Benz and Robbins (2011). The present findings were based on a larger number ofC. obrieni
speci-mens, with the results of all the analyses - intra- and inter-specific divergence values, haplotype networks, and species trees - confirming reciprocal monophyly between
C. obrieniandC. spectabilis, with a high degree of
statisti-cal support.
In addition, the comparative analysis indicated a greater degree of divergence between C. obrieni and C. spectabilis in comparison with C. undatus and C. grammicus, and the species tree (Figure 1) was consistent
with the complete separation of these four taxa. These anal-yses, however, did not include the specimens used by Benz and Robbins (2011), given that sequences for the genetic markers used in both studies were not available for all the specimens.
One important detail in the results of Benz and Rob-bins (2011) is that the mtDNA divergence value withinC. grammicus was larger than those recorded between the grammicusandundatusforms, resulting in a paraphyletic
arrangement. Nonetheless, a number of substitutions ob-served in the nuclear loci indicated a different arrangement, in which the taxa were clearly separated, indicating the pos-sibility that the mtDNA data were the result of introgres-sion. Given this, Benz and Robbins (2011) indicated the need for a more definitive evaluation of the taxonomic ar-rangement of this group (grammicus-undatus) based on a
larger sample from a wider range of populations and a larger number of independent genetic markers for the eval-uation of possible gene flow, especially in the western Am-azonian populations of grammicus, and in the eastern
contact zone mentioned above, to provide a more conclu-sive assessment of the status of these taxa. The low distance
values separatingundatusand grammicusthat we found
also call into question the specific distinctiveness of these two taxa.
WhileC. obrienihad long been considered a
subspe-cies ofC. spectabilis(Short, 1982), based on the availabil-ity of a single specimen, subsequent morphological and ecological data indicated thatC. obrieniandC. spectabilis
are distinct, albeit closely-related species (Santos and Vas-concelos, 2007; Remsenet al., 2012). The geographic
dis-tribution of the two species is probably related to the availability of habitats with bamboo (Pinheiroet al., 2012).
In the western Amazon basin,C. spectabilisis dependent
on patches of humid bamboo forest, in which it forages and reproduces (Kratter, 1997, 1998; Whittaker and Oren, 1999; Guilherme and Santos, 2009). Tobiaset al.(2006)
also highlight that the known geographic range of C. obrieni(from the type specimen) coincided with open and
forested Cerrado habitats, interspersed with narrow and discontinuous belts of gallery forest. New observations (Pinheiro and Dornas, 2008; Pinheiroet al., 2012) indicate
that this species is specialized for occupation of patches of bamboo habitat within this landscape, especially those dominated byGuadua paniculata, in which approximately
98% of the records ofC. obrieniforaging behavior were
ob-tained at Cerrado sites. The marked dependence of the spe-cies on a bamboo habitat could be related to the dietary preferences of this bird species (Kratter, 1997; Winkler and Christie, 2002). The heterogeneous distribution of C. obrieniwithin the Cerrado may thus be related to this
de-pendence on bamboo habitats, which are relatively widely dispersed within this biome.
The present-day distribution of C. obrieniincludes
the Brazilian states of Goiás, Maranhão, Piauí, and Tocan-tins (Pinheiro and Dornas, 2008; Dornaset al., 2011), and
more recently, Mato Grosso (Pinheiroet al., 2012). This
distribution encompasses wooded environments - gallery and semideciduous forests, both with bamboo habitats -within the Cerrado biome, and reduces the distance (to ap-proximately 1000 km) between the known range of C. obrieniand the nearest recorded localities forC. spectabilis
in the Brazilian state of Acre in the southwestern Amazon basin (Guilherme and Santos, 2009). The available data on the distribution ofC. obrieniandC. spectabilisindicate a
pattern different from that of other birds dependent on bam-boo habitats, such asSyndactyla ucayalae, Anabazenops dorsalis, Cercomacra manu, Drymophila devillei, and Ramphotrigon megacephalum, whose stronghold lies in
southwestern Amazonia (Kratter, 1997). When they occur outside this area, these species tend to be associated with minor tracts of bamboo habitats, which form a diagonal from southwestern Amazonia, passing through the states of Rondônia and Mato Grosso to southeastern Pará, in the re-gion of Carajás, reaching even the Belém area of endemism in easternmost Amazonia (Parkeret al., 1997; Leeset al., in
lo-cally but continuously distributed in this area, the distribu-tions of C. obrieni andC. spectabilis appear to be truly
disjunct, with the latter restricted to western Amazonia and the former to its eastern portion (Kratter, 1997). If this pat-terns holds, the allopatry ofC. obrieniandC. spectabilis
may help explain the comparative divergent phenotypes and genotypes when compared to another phylogenetically close sister species pair ofCeleus,such asC. undatusand C. grammicus.
The evidence suggests that in the past, these open bamboo forests were more widely distributed than in the present day, extending eastwards towards the Cerrado, with offshoots that reached as far south as the Atlantic Forest of southeastern Brazil. This major corridor of open forest hab-itats would provide a historic connection between the geo-graphic ranges of the two species. According to the molecu-lar clock analysis, the cladogenetic event that led to the separation ofC. obrieniandC. spectabilistook place
dur-ing the climatic fluctuations and associated habitat modifi-cations of the mid Pleistocene. It is worthy of note that the 2.1% nucleotide substitution rate used in the present study is based on average across many unrelated taxa (Weir and Schluter, 2008), therefore, such conclusions must be inter-preted with caution.
The climate cycles and related shifts in the distribu-tion of habitats that occurred during the Pleistocene have been identified by several biogeographers (Prance, 1987; Haffer, 2001; Silva and Bates, 2002) as the primary factor driving recent speciation processes in both forested and sa-vanna environments in South America. In particular, the climatic fluctuations of the mid-Pleistocene would have provoked a reduction and fragmentation of the forest cover, leading to the isolation of the ancestral populations ofC. obrieniandC. spectabilis. The geomorphological evidence
indicates that a single major refuge would have formed in the center of the present-day distribution of the Cerrado biome during this period, when even gallery forests may have shrunk to the point of interrupting the connection with adjacent areas of forest (Ab’Saber, 1983). The subsequent warming of the climate would have led to an expansion of the forest cover, expanding from the refugia to more pe-ripheral areas, and re-establishing the connectivity of the gallery forests.
Because the latest Brazilian checklist of endangered species was completed in 2003, before Kaempfer’s Wood-pecker was rediscovered, it is currently not listed as a threatened species in Brazil, but the IUCN lists it globally as critically endangered (BirdLife International, 2011). Ho-wever, the recent extensions reported in the known geo-graphic range of the species, which now includes Mato Grosso (Dornaset al., 2011), may contribute to a
re-eval-uation of the species’ status in the near future (IUCN, 2010). On the other hand, Pinheiroet al.(2012) have
con-cluded that the specialization ofC. obrienifor foraging in G. paniculatabamboo patches within the Cerrado may
de-termine its low population densities and its high degree of intolerance of anthropogenic impacts. This would make the species vulnerable to extinction, especially in the current context of agricultural expansion in the Brazilian Cerrado, where large tracts of natural habitat are being converted into soybean and rice plantations (Silva and Bates, 2002). The destruction of local ecosystems has accelerated consid-erably in recent years (Klink and Machado, 2005). Over the short term, the development of effective conservation strat-egies forC. obrieniwill depend on the collection of more
reliable data on population size and viability, for which mo-lecular markers will provide a fundamentally important an-alytical tool.
Acknowledgments
We thank anonymous reviewers for contributions to earlier versions of the manuscript. L.S.A. received a gradu-ate fellowship from CNPq during the study. A.A., M.V., I.S., and H.S. are supported by productivity fellowships from CNPq.
References
Ab’Saber AN (1983) O domínio dos cerrados: Introdução ao conhecimento. Rev Serv 111:41-55.
Assis CP, Raposo MA and Parrini R (2006) Validação de
Poospiza cabanisiBonaparte, 1850 (Passeriformes,
Embe-rizidae). Rev Bras Ornitol 15:103-112.
Bandelt HJ, Forster P and Rohl A (1999) Median-joining net-works for inferring intraspecific phylogenies. Mol Biol Evol 16:37-48.
Benz BW and Robbins MB (2011) Molecular phylogenetics, vo-calizations, and species limits inCeleuswoodpeckers (Aves,
Picidae). Mol Phylogenet Evol 61:29-44.
Dornas T, Valle NC and Hidasi J (2009)Celeus obrieni: Dois novos registros históricos para o estado de Goiás. Atual Ornitol 147:18-19.
Dornas T, Leite GA, Pinheiro RT and Crozariol MA (2011) Primeiro registro do criticamente ameaçado pica-pau-do-parnaíbaCeleus obrienino Estado do Mato Grosso (Brasil) e comentários sobre distribuição geográfica e conservação. Cotinga 33:91-93.
Drummond AJ and Rambaut A (2007) BEAST: Bayesian evolu-tionary analysis by sampling trees. BMC Evol Biol 7:e214. Felsenstein J (1985) Confidence limits on phylogenies: An
ap-proach using the bootstrap. Evol 39:783-791.
Guilherme E and Santos MP (2009) Birds associated with bamboo forests in eastern Acre, Brazil. Bull Br Ornithol Club 129:229-240.
Hackett SJ (1996) Molecular phylogenetics and biogeography of Tanagers in the genusRamphocelus(Aves). Mol Phylogenet
Evol 5:368-382.
Haffer J (2001) Hypotheses to explain the origin of species in Amazonia. In: Vieira ICG, Silva JMC, Oren DC and D’In-cao MA (eds) Biological and Cultural Diversity in Ama-zonia. Museu Paraense Emílio Goeldi, Belém, pp 45-118. Hall TA (1999) BIOEDIT: A user-friendly biological sequence
Heled J and Drummond AJ (2010) Bayesian inference of species trees from multilocus data. Mol Biol Evol 27:570-580. Hidasi JL, Mendonça GA and Blamires D (2008) Primeiro
re-gistro documentado de Celeus obrieni (Picidae) para o
estado de Goiás, Brasil. Revista Brasileira de Ornitologia 16:373-375.
Huelsenbeck JP and Ronquist F (2001) MrBayes: Bayesian infer-ence of phylogeny. Bioinformatics 17:754-755.
Klink CA and Machado RB (2005) A conservação do Cerrado Brasileiro. Megadiversidade 1:147-155.
Kratter AW (1997) Bamboo specialization by Amazonian birds. Biotropica 29:100-110.
Kratter AW (1998) The nests of two bamboo specialists:Celeus spectabilisandCercomacra manu. Biotropica 69:37-44.
Lacerda DR, Marini MÂ and Santos FR (2007) Mitochondrial DNA corroborates the species distinctiveness of the Planalto (Thamnophilus pelzelniHellmayr, 1924) and the Sooretama
(T. ambiguous Swainson, 1825) Slaty-antshrikes
(Passeriformes, Thamnophilidae).Braz JBiol 67:873-882.
Lees AC, Moura NG, Santana A, Aleixo A, Barlow J, Berenguer E, Ferreira J and Gardner TA (2012) Paragominas: A quanti-tative baseline in ventory of an eastern amazonian avifauna. Rev Brasil Ornitol 20:93-118.
Librado P and Rozas J (2009) DnaSP v. 5.10: A software for com-prehensive analysis of DNA polymorphism data. Bioin-formatics 25:1451-1452.
Palumbi S, Martin A, Romano S, McMillian WO, Stice L and Grabowski G (1991) The Simple Fool’s Guide to PCR. Uni-versity of Hawaii Press, Honolulu, 45 pp.
Parker TA, Stotz DF and Fitzpatrick JW (1997) Notes on avian bamboo specialists in southwestern Amazonian Brazil. Ornithol Monogr 48:543-547.
Pinheiro RT and Dornas T (2008) New records and distribution of Kaempfer’s WoodpeckerCeleus obrieni. Rev Bras Ornitol 16:167-169.
Pinheiro RT, Dornas T, Leite GA, Crozariol MA, Marcelino DG and Corrêa AG (2012) Novos registros do pica-pau-do-parnaíbaCeleus obrienie status conservação no estado de Goiás, Brasil. Rev Bras Ornitol 20:59-64.
Posada D (2008) jModelTest: Phylogenetic Model Averaging. Mol Biol Evol 25:1253-1256.
Prado AD (2006)Celeus obrieni: 80 anos depois. Atual Ornitol
134:4-5.
Prance GT (1987) Biogeography of neotropical plants. In: Whitmore TC and Prance GT (eds) Biogeography and Qua-ternary History in Tropical America. Clarendon Press, Ox-ford, pp 46-65.
Prychitko TM and Moore WS (1997) The utility of DNA se-quences of an intron from the b-fibrinogen gene in phylo-genetic analysis of Woodpeckers (Aves, Picidae). Mol Phylogenet Evol 8:193-204.
Rêgo PS, Araripe J, Silva WAG, Albano C, Pinto T, Campos A, Vallinoto M, Sampaio I and Schneider H (2010) Population genetic studies of mitochondrial pseudo-control region in the endangered Araripe Manakin (Antilophia bokermanni).
Auk 127:335-342.
Sambrook J, Fritsch EF and Maniatis T (1989) Molecular Clon-ing. A Laboratory Manual. Cold Spring Harbor Laboratory Press, New York.
Sanger F, Nichlen S and Coulson AR (1977) DNA Sequencing with chain-termination inhibitors. Proc Natl Acad Sci USA 74:5463-5468.
Santos MPD and Vasconcelos MF (2007) Range extension for Kaempfer’s WoodpeckerCeleus obrieniin Brazil, with the first male specimen. Bull Br Ornithol Club 127:249-252. Santos MPD, Cerqueira PV and Soares LMS (2010) Avifauna em
seis localidades no Centro-Sul do Estado do Maranhão, Brasil. Ornithologia 4:49-65.
Schneider H (2007) Método de Análise Filogenética: Um Guia Prático. Editora Holos and Sociedade Brasileira de Genética Press, Ribeirão Preto, 200 pp.
Short LL (1982) Woodpeckers of the World. Delaware Museum of Natural History, Greenville, 676 pp.
Silva JMC and Bates JM (2002) Biogeographic patterns and con-servation in the South American Cerrado: A tropical sa-vanna hotspot. BioScience 52:225-233.
Silveira LF and Olmos F (2007) Quantas espécies de aves existem no Brasil? Conceitos de espécie, conservação e o que falta descobrir. Rev Bras Ornitol 15:289-296.
Sorenson MD, Ast JC, Dimcheff DE, Yuri T and Mindell DP (1999) Primers for a PCR-based approach to mitochondrial genome sequencing in birds and other vertebrates. Mol Phy-logenet Evol 12:105-114.
Swofford DL (2002) PAUP* Phylogenetic Analysis Using Parsi-mony (*and Other Methods). Beta Version v. 4.10b. Sinauer Associates, Sundeland, Massachusetts.
Tamura K, Dudley J, Nei M and Kumar S (2007) MEGA4: Molec-ular Evolutionary Genetics Analysis (MEGA) software ver. 4.0. Mol Biol Evol 24:1596-1599.
Thompson JD, Higgins DG and Gibson TJ (1994) CLUSTAL W: Improving the sensitivity of progressive multiple sequence alignment through sequence weighting, position-specific gap penalties and weight matrix choice. Nucleic Acids Res 22:4673-4680.
Tobias JA, Butchart SHM and Collar NJ (2006) Lost and found: A gap analysis for the Neotropical avifauna. Neotrop Bir-ding1:4-22.
Webb DM and Moore WS (2005) A phylogenetic analysis of woodpeckers and their allies using 12S,Cyt b, and COI
nu-cleotide sequences (class Aves; order Piciformes). Mol Phylogenet Evol 36:233-248.
Weir JT and Schluter D (2008) Calibrating the avian molecular clock. Mol Ecol 17:2321-2328.
Winkler H and Christie DA (2002) Family Picidae (Wood-peckers). In: del Hoyo J, Elliott A and Sargatal J (eds) Hand-book of the Birds of the World. Vol. 7: Jacamars to Wood-peckers. Lynx Edicions, Barcelona, pp 296-555.
Whittaker A and Oren DC (1999) Important ornithological re-cords from the rio Juruá, western Amazonia, including twelve additions to the Brazilian avifauna. Bull Br Ornithol Club119:235-260.
Internet Resources
BirdLife International (2011) Celeus obrieni. In: IUCN 2011. IUCN Red List of Threatened Species.Version 2011.2, http://www.iucnredlist.org (June 29, 2012).
IUCN (2010)Celeus obrieni. In: IUCN 2010. IUCN Red List of
Threatened Species. Version 2010.4.,
http://www.iucnredlist.org (June 29, 2012).
Remsen JV, Cadena CD, Jaramillo A, Nores M, Pacheco JF, Rob-bins MB, Schulenberg TS, Stiles FG, Stotz DF and Zimmer KJ (2012) A classification of the bird species of South
America. AOU,
http://www.mu-seum.lsu.edu/~Remsen/SACCBaseline.html (June 29,
2012).
Associate Editor: Fabrício Rodrigues dos Santos