Vol.46, n. 4 : pp. 521-527, December 2003
ISSN 1516-8913 Printed in Brazil
BRAZILIAN ARCHIVES OF
BIOLOGY AND TECHNOLOGY
A N I N T E R N A T I O N A L J O U R N A L
Genetic Diversity in Passion Fruit (
Passiflora
spp.)
Evaluated by RAPD Markers
Maria Lúcia Crochemore
*, Hugo Bruno Correa Molinari and Luiz Gonzaga Esteves Vieira
Laboratório de Biotecnologia; Instituto Agronômico do Paraná (IAPAR); C. P. 481; 86001970; Londrina PR -BrazilABSTRACT
The objective of this study was to characterize the genetic diversity within a Passiflora collection by PCR-RAPD markers. Genetic analysis was performed in 70 accessions, representing 11 species of the genus Passiflora. The use of only five primers produced 136 reproducible polymorphic bands. The hierarchical classification showed high levels of dissimilarities between and within the species studied. A clear separation was obtained among species and accessions of P. edulis and P. edulis f. flavicarpa, which were forms of the high commercial value species. The fingerprints produced from the studied genotypes would allow the identification of improved varieties/populations in an easy, fast and inexpensive manner.
Key words: Passiflora spp., germoplasm, genetic diversity, RAPD-PCR
* Author for correspondence
INTRODUCTION
Passiflora is the most important genus in the
family Passifloriaceae and it is distributed within
tropical and sub-tropical regions. Approximately, 460 species of the genus Passiflora have already
been described. From these, about 90% have originated from the Americas and close to 150 species occur in Brazil (Sousa and Meletti, 1997). The economical importance of some species is associated to the quality of the fruits for consumption and medicinal properties.
The passion fruit is an allogamous plant and the edible fruit-producing species are diploids (2n=18), namely, the purple (P. edulis) and the
yellow passion fruit (P. edulis f. flavicarpa)
(Martin and Nakasone, 1970), which is cultivated in Brazil. The high interspecific compatibility in natural and artificial crossings among the diploid species leads to a wide genetic diversity
distributed in different agro-climatic regions. Morphological characters used for taxonomical description of passion fruit have allowed a classification up to the species level, but not to an intraspecific discrimination. Besides fruit color, flavor and resistance to diseases, P. edulis and P. edulis f. flavicarpa do not show contrasting
differences (Martin and Nakasone, 1970). Although still not much used in passion fruit genetic variability studies, RAPD markers have been shown to be polymorphic, allowing the characterization of the variability among and within species as well as for the identification of hybrids and parentals (Fajardo et al., 1998, Cassiano, 1998; Otoni et al., 1995). The characterization of the genetic diversity within a Brazilian Passiflora spp. collection using RAPD
duplicated accessions resulting in a complementary tool for selection of progenitors for breeding programs. Also, the identification of cultivars, which are forms of the high commercial value species by molecular markers, may be a valuable support in view of Cultivar Protection Laws (Jondle, 1992). Although these molecular descriptors are not accepted for protecting
intellectual property by the UPOV convention (International Union for the Protection of New Varieties of Plants), these techniques have an enormous potential for cultivars discrimination and deserve further investigation. The objective of this study was to characterize the genetic diversity within a Passiflora collection by RAPD markers.
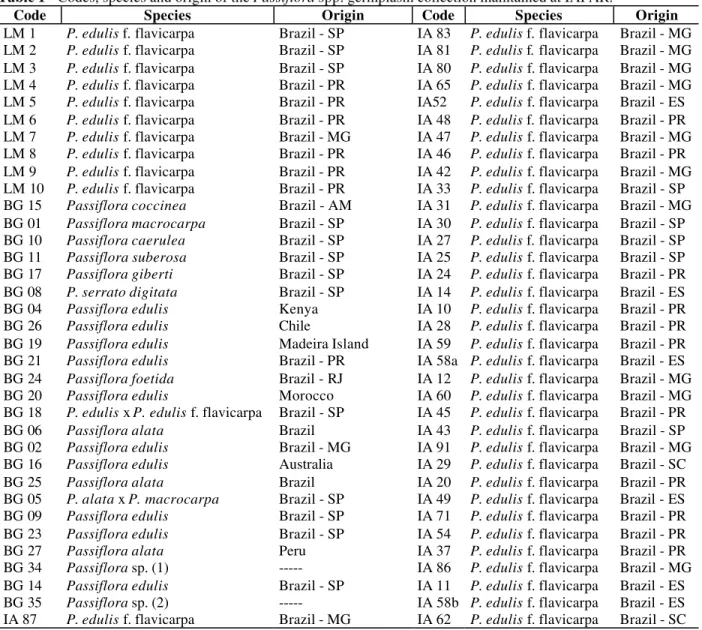
Table 1 - Codes, species and origin of the Passiflora spp. germplasm collection maintained at IAPAR.
Code Species Origin Code Species Origin
LM 1 P. edulis f.flavicarpa Brazil - SP IA 83 P. edulis f. flavicarpa Brazil - MG LM 2 P. edulis f. flavicarpa Brazil - SP IA 81 P. edulis f. flavicarpa Brazil - MG LM 3 P. edulis f. flavicarpa Brazil - SP IA 80 P. edulis f. flavicarpa Brazil - MG LM 4 P. edulis f. flavicarpa Brazil - PR IA 65 P. edulis f. flavicarpa Brazil - MG LM 5 P. edulis f. flavicarpa Brazil - PR IA52 P. edulis f. flavicarpa Brazil - ES LM 6 P. edulis f. flavicarpa Brazil - PR IA 48 P. edulis f. flavicarpa Brazil - PR LM 7 P. edulis f. flavicarpa Brazil - MG IA 47 P. edulis f. flavicarpa Brazil - MG LM 8 P. edulis f. flavicarpa Brazil - PR IA 46 P. edulis f. flavicarpa Brazil - PR LM 9 P. edulis f. flavicarpa Brazil - PR IA 42 P. edulis f. flavicarpa Brazil - MG LM 10 P. edulis f. flavicarpa Brazil - PR IA 33 P. edulis f. flavicarpa Brazil - SP BG 15 Passiflora coccinea Brazil - AM IA 31 P. edulis f. flavicarpa Brazil - MG BG 01 Passiflora macrocarpa Brazil - SP IA 30 P. edulis f. flavicarpa Brazil - SP BG 10 Passiflora caerulea Brazil - SP IA 27 P. edulis f. flavicarpa Brazil - SP BG 11 Passiflora suberosa Brazil - SP IA 25 P. edulis f. flavicarpa Brazil - SP BG 17 Passiflora giberti Brazil - SP IA 24 P. edulis f. flavicarpa Brazil - PR BG 08 P. serrato digitata Brazil - SP IA 14 P. edulis f. flavicarpa Brazil - ES BG 04 Passiflora edulis Kenya IA 10 P. edulis f. flavicarpa Brazil - PR BG 26 Passiflora edulis Chile IA 28 P. edulis f. flavicarpa Brazil - PR BG 19 Passiflora edulis Madeira Island IA 59 P. edulis f. flavicarpa Brazil - PR BG 21 Passiflora edulis Brazil - PR IA 58a P. edulis f. flavicarpa Brazil - ES BG 24 Passiflora foetida Brazil - RJ IA 12 P. edulis f. flavicarpa Brazil - MG BG 20 Passifloraedulis Morocco IA 60 P. edulis f. flavicarpa Brazil - MG BG 18 P. edulis x P. edulis f. flavicarpa Brazil - SP IA 45 P. edulis f. flavicarpa Brazil - PR BG 06 Passiflora alata Brazil IA 43 P. edulis f. flavicarpa Brazil - SP BG 02 Passiflora edulis Brazil - MG IA 91 P. edulis f. flavicarpa Brazil - MG BG 16 Passiflora edulis Australia IA 29 P. edulis f. flavicarpa Brazil - SC BG 25 Passiflora alata Brazil IA 20 P. edulis f. flavicarpa Brazil - PR BG 05 P. alata x P. macrocarpa Brazil - SP IA 49 P. edulis f. flavicarpa Brazil - ES BG 09 Passiflora edulis Brazil - SP IA 71 P. edulis f. flavicarpa Brazil - PR BG 23 Passiflora edulis Brazil - SP IA 54 P. edulis f. flavicarpa Brazil - PR BG 27 Passiflora alata Peru IA 37 P. edulis f. flavicarpa Brazil - PR BG 34 Passiflora sp. (1) --- IA 86 P. edulis f. flavicarpa Brazil - MG BG 14 Passiflora edulis Brazil - SP IA 11 P. edulis f. flavicarpa Brazil - ES BG 35 Passiflora sp. (2) --- IA 58b P. edulis f. flavicarpa Brazil - ES IA 87 P. edulis f. flavicarpa Brazil - MG IA 62 P. edulis f. flavicarpa Brazil - SC
MATERIALS AND METHODS
Plant Material
Seventy introductions of the IAPAR’s Passiflora
spp. Germplasm Collection, comprising 11 species and two not-classified introductions were used. Their origin and identification are shown in
Table 1. Seedlings propagated by budding or grafting were grown under greenhouse facilities.
DNA extraction
extraction was performed as described by Molinari and Crochemore (2001). DNA concentration was estimated in a fluorimeter as described by the manufacturer (Hoefer Scientific Instruments).
RAPD analysis
RAPD reactions were performed according to Williams et al. (1990) in a final volume of 25 µl containing 25 ng genomic DNA, 2.5 µl buffer 10X [200 mM Tris (pH 8.4), 500 mM KCl), gelatin 0.01%, 1.5 mM MgCl2, 0.25 mM of each dNTP,
0.2 µM primer and 1 U Taq polymerase. The
amplifications were performed in a thermocycler (MJ Research, Inc.) using the following program: 1 cycle of 4 min at 94ºC followed by 37 cycles of
1 min at 93ºC, 1 min at 45ºC and 1 min at 72ºC, with a final extension of 6 min at 72ºC.
Amplification products were analyzed by electrophoresis at 5V/cm in agarose gel (1.4%). The gel was stained in 0.5 µg/ml ethidium bromide solution and photographed with the KODAK EDAS 120 system.
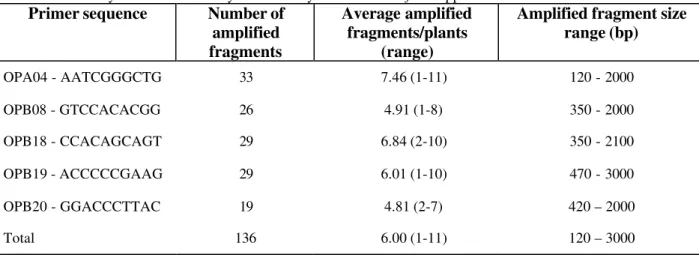
From a screening using 42 primers (Operon Technologies, Inc. Kits A, B, AE1 and C16 oligonucleotides), five primers were shown to be highly polymorphic and were used in this study (Table 2). Only amplified consistent DNA bands, in the approximate range of 0,1–3 kilobases (kb) were scored.
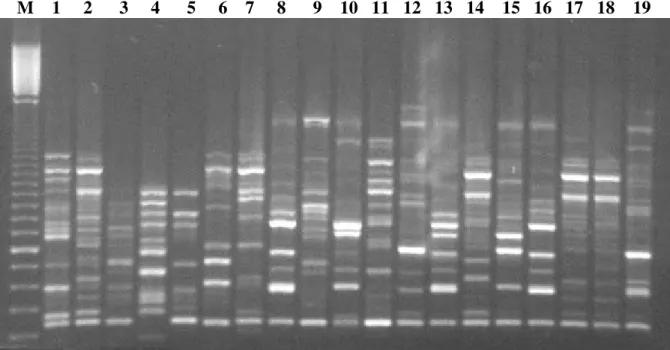
M 1 2 3 4 5 6 7 8 9 10 11 12 13 14 15 16 17 18 19
Figure 1 - Random amplified polymorphic DNA from 19 Passiflora spp. accessions using primer OPB-18. Lane M: 100bp molecular weigth. Lane (1) P. coccinea, (2) P. macrocarpa, (3) P. caerulea, (4) P. suberosa, (5) P. giberti, (6) P. serrato digitata, (7) P. edulis (Kenya), (8) P. edulis (Chile), (9) P. edulis (Madeira Island), (10) P. edulis (Brazil, Parana state), (11) P. foetida, (12) P. edulis (Morocco), (13) P. edulis x P. edulis f. flavicarpa, (14) P. alata, (15) P. edulis (Brazil, Sao Paulo state), (16) P. edulis (Australia), (17) P. alata, (18) P. alata x P. macrocarpa, (19) P. edulis (Brazil, Sao Paulo state).
Statistical analysis
Jaccard’s similarity indexes (Jaccard, 1901) were calculated with data provided by the observation of the presence (1) or absence (0) of bands between pairs of accessions using the formula D(ij)
= a/(a+b+c), where: a is the number of fragments
shared by accessions i and j; b is the number of
fragments present in i and absent in j; c is the
number of fragments present in j and absent in i. A
using the SAS Statistical Program (SAS Institute, 1998).
RESULTS AND DISCUSSION
Table 2 summarizes the number, average and size range of amplified fragments obtained with the five primers used to compare the Passiflora
collection. A total of 136 amplified fragments were selected. Depending on the introduction-primer combination, between 1 and 11 distinct RAPD products were amplified, ranging in size from approximately 120 to 3000 bp. Each RAPD amplification was prepared at least three times to determine reproducibility of the patterns.
Genetic diversity
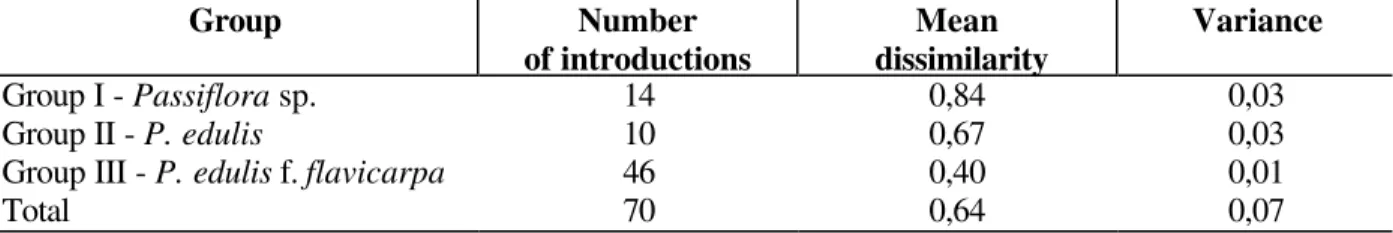
High dissimilarity was observed among the introductions. The hierarchical classification obtained by the clustered method showed three large groups (Fig. 2). The values of mean dissimilarity, range and variances of all possible pairwise comparisons within these groups are shown on Table 3. As expected, the highest dissimilarity was observed among the species of Group I. This group is composed by 14 accessions, comprising the species: P. cocinea, P. alata, P. macrocarpa, P. edulis, P. alata x P. macrocarpa P. caerulea, P. serrato-digitata, P. giberti and P. suberosa, two accessions of P. edulis (Kenya and
Madeira Island) and the accession Passiflora sp.
(2). The lowest dissimilarity in Group I was found between accession BG25 (P. alata) and BG05
(P. alata x P. macrocarpa). On the other hand, the
highest dissimilarity (0.97) was found between accession BG11 (P. suberosa) and BG23 (P. edulis) from Group II.
Group II was exclusively formed by eight introductions of P. edulis, a cross between P. edulis and the introduction Passiflora sp. (1). This
group showed a mean dissimilarity of 0.67 (Table 3). This high variation observed within
P. edulis was corroborated by Cassiano (1998)
but was not detected in the studies done by Fajardo et al. (1998) probably due to the small number of accessions studied by these authors. Two introductions, originally classified as P. edulis
-one from Kenya (BG04) and the other from Madeira Island (BG19) - were assigned to Group I. However, due to their close similarity to alata-macrocarpa and P. caerulea respectively, we
inferred that these introductions were misclassified in the original germoplasm collection. The introduction named Passiflora sp. (1), was
grouped very close to a wild Brazilian introduction (d=0.56) of P. edulis, and probably it was closed
related to this species.
Group III was formed by 46 introductions of P. edulis f. flavicarpa, native of several states of
Brazil (Table 1). The LM introductions had been selected according to their desirable agronomical characteristics. On the other hand, IA introductions were introduced genotypes, without any specific selected characteristic. Despite being formed only by P. edulis f. flavicarpa, this group
presented a mean dissimilarity of 0.40 (Table 3).
Table 2 - Summary of data obtained by RAPD analysis for 70 Passiflora spp. introductions
Primer sequence Number of
amplified fragments
Average amplified fragments/plants
(range)
Amplified fragment size range (bp)
OPA04 - AATCGGGCTG 33 7.46 (1-11) 120 - 2000
OPB08 - GTCCACACGG 26 4.91 (1-8) 350 - 2000
OPB18 - CCACAGCAGT 29 6.84 (2-10) 350 - 2100
OPB19 - ACCCCCGAAG 29 6.01 (1-10) 470 - 3000
OPB20 - GGACCCTTAC 19 4.81 (2-7) 420 – 2000
The grouping method (UPGMA) allowed a perfect distinction between the introductions LM and IA showing that the RAPD markers were useful even to discriminate closely related genotypes.
P. edulis f. flavicarpa was likely to be a population
selected from P. edulis based on agronomical
characteristics, like fruit color. The classification obtained evidences the genetic ascendancy of P. edulis over P. edulis f flavicarpa, supporting the
origin of P. edulis f. flavicarpa as a mutation of P. edulis (Pope and Degener, cited by Martin and
Nakasone, 1970) and not from a cross of P. edulis
with any of the species herein studied. Our results have shown that could be possible to distinguish several Passiflora species as well as separate
accessions of P. edulis and P. edulis f. flavicarpa
with only five primers. Molecular markers are very useful in an early breeding program for allowing germoplasm screening at any developmental stage of the plants or when a large number of individuals need to be evaluated.
Similarity
0.08 0.31 0.54 0.77 1.00
LM1 LM7 LM9 LM4 LM5 LM8 LM3 LM6 LM2 LM10 IA87 IA37 IA83 IA65 IA27 IA46 IA45 IA54 IA59 IA60 IA91 IA86 IA42 IA33 IA31 IA10 IA71 IA62 IA47 IA28 IA81 IA80 IA48 IA30 IA14 IA58a IA58b IA29 IA20 IA49 IA24 IA52 IA25 IA12 IA11 IA43 P.edulis-Chile P.edulis-Austra P.edulisxflavic P.edulis-PR P.edulis-Morocc P.edulis-SP P.edulis-MG P.edulis-SP P.edulis-SP Passiflorasp.1 Passiflorasp.2 P.coccinea P.alata-Peru P.foetida P.macrocarpa P.edulis-Kenya P.alata-Brazil P.alata-Brazil P.alataxP.macro P.caerulea P.edulis-Madeir P.serrato-digit P.giberti P.suberosa
Figure 2 - Dendrogram showing the genetic relationships among 70 accessions representing 11 species of Passiflora clustered by UPGMA method based on bands generated using five primers. Scale value of 1 indicates 100% genetic similarity.
Table 3 - Mean dissimilarities and variances within the three groups formed by 70 accessions of Passiflora spp. based on RAPD markers.
Group Number
of introductions
Mean dissimilarity
Variance
Group I - Passiflora sp. 14 0,84 0,03
Group II - P. edulis 10 0,67 0,03
Group III - P. edulis f. flavicarpa 46 0,40 0,01
Total 70 0,64 0,07
Fingerprinting
The analysis of the RAPD products profile showed highly discriminative amplified fragments among the 70 introductions studied. An example of banding patterns given by DNA amplification products after agarose gel electrophoresis is presented in Fig. 1.
The primer OPA-04 showed the highest discriminative power and could be used to clearly discriminate the group flavicarpa from all other accessions. This primer revealed a specific band (700 bp) for all accessions of P. alata and P. macrocarpa and it also identified P. foetida by a
640 bp fragment. The primer OPB-08 separated P. edulis from P. edulis f. flavicarpa and also
revealed one specific amplified fragment for
Passiflora sp. (2) and one for P. coccinea. The
lack of a OPB-18-440bp fragment, present in all introductions of the collection was characteristic for the P. suberosa. Moreover, three specific
amplified fragments revealed with only primer OPB-18 were found in Passiflora sp. (2). The
primer OPB-19 presented a specific amplified fragment (550bp) for P. giberti and the primer
OPB-20 revealed four fragments that specifically discriminated Passiflora sp. (2) and P. giberti.
Specific RAPD products were not found in P. caerulea, P. serrato-digitata and, therefore, it was
not possible to discriminate these introductions from all others of the germoplasm collection.
ACKNOWLEDGEMENTS
We thank Neusa C. Stenzel from IAPAR for providing the germoplasm collection.
RESUMO
A diversidade genética de Passiflora spp. tem sido
estudada basicamente através de características morfológicas e agronômicas, levando à uma
classificação até espécie. A caracterização intraespecífica por meio destes descritores necessita de um ciclo integral de cultivo, e é pouco discriminante. O objetivo deste estudo foi caracterizar a variação genética de uma coleção de
Passiflora através da técnica RAPD. Análises
moleculares foram realizadas em 70 acessos, envolvendo 11 espécies do gênero Passiflora. A
utlização de apenas cinco primers permitiu a
obtenção de 136 fragmentos polimórficos. A classificação hierárquica obtida mostrou alto nível de dissimilaridade entre e dentro das espécies. Nítida separação foi obtida entre acessos de P. edulis e da forma flavicarpa, de alto interesse
comercial, fracamente diferenciados pelas características morfológicas e agronômicas. A utilização desses marcadores na avaliação dos recursos genéticos de Passiflora, é atrativa para o
melhorista e poderá muito auxiliar na identificação dos acessos, pela facilidade, rapidez e pelo baixo custo na condução das avaliações.
REFERENCES
Cassiano, A. P. A. A. (1998), Variações genéticas entre espécies de Passiflora (Passifloraceae) usando marcadores RAPD, Jaboticabal. Dissertação (Mestrado em Genética e Melhoramento de Plantas). 47 pp.
Fajardo, D.; Angel, F.; Grum, M.; Tohme, J.; Lobo, M.; Roca, W. M. and Sanchez, I. (1998), Genetic variation analysis of the genus Passiflora L. using RAPD markers. Euphytica, 101, 341-347.
Jaccard, P. (1991), Étude comparative de la distribution florale dans une portion des Alpes et des Jura. Bull. Soc. Vaudoise Sci. Nat., 37, 547-579.
Jondle, R. (1992), Legal aspects of varietal protection using molecular markers. In: Applications of RAPD technology to plant breeding. Joint plant breeding symposia series, Minnesota, USA. pp. 50-52.
Molinari, H. B.; Crochemore, M. L. (2001), Extração de DNA genômico de Passiflora spp. para análises PCR-RAPD. Rev. Bras. Frutic., 23 : (2), 447-450.
Otoni , W. C.; Blackhall, N. W.; D´utra Vaz, F. B.; Casali, V. W.; Power, J. B. and Davey, M. R. (1995), Somatic hybridization of the Passiflora species, P. edulis f. flavicarpa Degener and P. incarnata.L. J. Exp. Bot., 46 : (288), 777-785.
SAS Institute (1998), SAS/STAT User´s Guide. Release 6. 12. ed. Cary : SAS Institute Inc.
Sousa, J. S. I; Meletti, L. M. M. (1997), Maracujá: Espécies, variedades, cultivo. Piracicaba : FEALq. 179 pp.
Williams, J. G. K.; Kubelick, A. R.; Livak, K. J.; Rafalski, J. A. and Tingey, S. V. (1990), DNA polymorphisms amplified by arbitrary primers are useful as genetic markers. Nucleic Acids Res., 18,
6531-6535.