U
sing a GIS to reconstruct the
nineteenth century Lisbon parishes
Daniel R. Alves
Introduction
The changes that took place in the internal organisa-tion of the territory in the last two centuries make the knowledge of the national administrative division and the understanding of its evolution essential in Portu-guese Contemporary History, especially for comparing historical data over time.
This perspective is still clearer regarding the history of Lisbon. The demographic evolution of the last two centuries and the resulting growth of the city were par-tially responsible for the profound changes in the ad-ministrative structure of the city. The most signifi cant involved a drastic reduction of Lisbon’s municipal lim-it in mid XIXth century and a deeper transformation in
the city parishes a century later. These changes caused serious methodological problems, not only because of the unawareness of the exact number of parishes at each historical moment, but essentially because of the ignorance of its limits.
The primary goal of the work I will present was to rebuild the administrative division of Lisbon for the entire XIXth century. This task was carried out using a
GIS, with its CAD tools, and combining digital sourc-es, in vectorial format, representing current parish lim-its and city streets [1], with historical cartography, for 1826, 1864 and 1909, where old parishes were mapped [2]. Other historical maps, old city guides, contempo-rary descriptions and fi scal sources were also used.
This work is part of a larger project called SIGMA, fi nanced by the Portuguese Science and Technology Fundation, under the scientifi c supervision of Luís Espinha da Silveira and was carry out in the Depart-ment of History of the Faculty of Social Sciences and Humanities, New University of Lisbon [3]. Part of the methodology and some map drawing was prepared with a precious help from Sofi a Lucas Martins, for who I’d like to express my thanks.
Administrative reforms in Lisbon
In the fi rst half of the XIXth century, Lisbon had 70
par-ishes in a municipality that was extended for about 532 km2. In mid century, by the 11th of September of 1852
edict, the municipality was substantially changed, re-ducing it practically to the urban area of the city and loosing a great number of its parishes to new mu-nicipalities: Belém and Olivais. It remained with 34 parishes in a 13 km2 area. This new circumscription
maintain itself until 1885, time when Lisbon expanded its territory up to the actual limits of the municipality. By the edict of the 18th of July, Lisbon encircled 43
par-ishes and an 85 km2 area approximately. In the
follow-ing year, with the edict of the 22nd of July, the capital
incorporated two more parishes, which made part of the municipality until 1895, when they were separated again and incorporated in the municipality of Loures by the edict of the 26th of September. With light
chang-es, the municipality of Lisbon that we know today is the result of this last edict.
As we can see, the XIXth century was full of changes
in Lisbon’s administrative circumscription but, essen-tially, at the municipality level. Regarding the parishes, we know that their limits were stable during the cen-tury [4]. On the urban parishes specifi c case, they were established in 1780 by the edict of the 19th of April,
consequence of the urbanistic modifi cations caused by the earthquake of 1755. However, in mid XXth
cen-tury this stable panorama was radically modifi ed. The edict of the 7th of February of 1959 created new
a retrospective reconstruction of Lisbon’s parishes through the assimilation of the geographical units, methodology that was used in SIGMA for almost all the national territory [6].
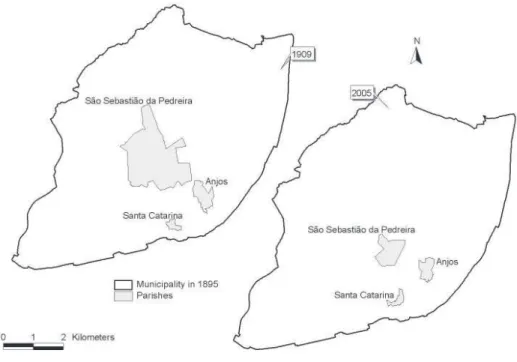
Here we present only three examples of parishes changed in 1959, which illustrated very well the diffi cul-ties pointed out: the cases of S. Sebastião da Pedreira, S. Catarina and Anjos [Figure 1].
The Lisbon parishes in the XIX
Thcentury
Knowing all these changes and their consequences, becomes obvious that for the capital could not be used the same methodology because of the risk of creating a high error level. It was necessary to start from de be-ginning and draw the parishes based on cartographic sources of that time. In the last years these reconstruc-tion was tried several times [7].
1. Sources and methodology
The methodology used in the SIGMA’s project has some similarities with the one used by Maria Alex-andre Lousada, but we worked with technologies of CAD, GIS and relational databases. Beyond that, we did not one but three maps, that represent the evolu-tion of the parishes in Lisbon between 1780 and 1910. Another signifi cant difference relies on the fact that
Figure 1. Parishes of Anjos, S. Catarina and S. Sebastião, in 1909 and 2005.
we reconstructed all the ancient parishes, urban and rural, which area was within the actual limits of the municipality.
First, it was necessary to research in different Lisbon archives looking for the required sources to do these reconstructions [8]. The objective was to fi nd charts that had the parishes’ limits represented. Of all charts found we selected fi ve: three with the parishes’ limits that we already referred [9] and other two that served as helpful material for the resolution of doubts and better identifi cation of the city streets [10].
With the software ArcView 3.2 we used, as our work base, two digital charts, one of the roads and streets of Lisbon and another of Portugal’s mainland parishes, both in vectorial format. However, they had different scales and projection systems, which compatibility was achieved by using the extensions ‘Projecções de Portugal’ and ‘ShapeWarp’, adjusting the limits be-tween the two.
After that, all the polygons corresponding to the ac-tual Lisbon parishes were erased, trying to obtain a work area only with the city streets, adjusted to the external limits of the municipality.
that served as limit between parishes. Nevertheless, the city growth of the last two centuries, changed the physiognomy of some streets and made other disap-pear, creating in some cases the need for approximat-ed drawings. In the end, we accomplishapproximat-ed an amount of lines, selected or draw that were transformed in pol-ygons with the ‘Xtools’ extension. Each polygon cre-ated represented an ancient parish, being this method adopted in all three historical charts.
However, the charts used in the fi rst two moments, 1826 and 1864 did not represented the all municipal-ity (which only happens in the 1909’s chart); it only shows the parishes considered, at the time, as urban parishes. This fact made us face the problem of the unawareness for the ‘rural’ parishes’ limits for the most part of the XIXth century. Nevertheless,
consid-ering the analysis of the several charts elaborated we came to the conclusion that the differences between them were minimal. This made us wandering if the same hypothesis was valid to the rest of the parishes that we already had in the 1909’s drawing.
In this sense and looking forward to confi rm this hy-pothesis, we had to try on doing a retrospective analy-sis of the limits in 1909. The solution was to explore fi scal sources of the city, the so called Livros das Déci-mas, which has for each parish the names of the
tax-payers, their properties and it’s taxes value for the fi rst decades of the XIXth century, organised by streets. It
was possible to compare these with the ones selected for the drawing of the parishes indicated in 1909 and conclude that, in most of them, the limits in this chart were coincident with the ones referred in the Livros das Décimas or their variation was very small [12].
In spite of the punctual errors in the defi nition of the limits, we concluded that, being aware of the lacking of other cartographic sources, the most correct was to assume the ‘rural’ parishes of 1909 to all the XIXth
cen-tury. In such case, we associated them to the ‘urban’ parishes, acknowledge by specifi c sources, for each former period.
2. Lisbon before the Liberalism
To represent Lisbon in the fi rst half of the XIXth
cen-tury [Figure 2] it was used a version of the well-known Duarte José Fava’s map of 1807, produced, probably, around 1820 and stored in the Military Archive [13].
the limits coincidence was almost perfect. Beyond that, the use of this chart revelled itself as the most correct choice by the quality that is unanimously rec-ognised in the original survey [14].
With the Carta Topográfi ca da Cidade de Lisboa, e Bairro de Belém... it was possible to draw 39 parishes representing the end of the XVIIITH century and all the
fi rst half of the XIXTH century, since the parochial
or-ganisation of Lisbon that took place in 1780 remained until 1852, with the exception of the Belém parish crea-tion in 28th of December of 1833 and three annexations
occurred in 1835 and 1836 [15].
3. Lisbon in mid XIX
thcentury
The city of Lisbon in mid XIXth century [Figure 3] it’s
the result of the work made over the Planta da cidade de Lisboa..., published in 1864 by Frederico Gavazzo Perry Vidal. There are some copies of this chart in the National Library, in the City Museum and in the Lis-bon Geographic Society, all of them printed and with the parishes and quarter limits in several colour pencil lines.
The use of this chart considered not only its quality but also the information given once more by Vieira da Silva about his author, a civil engineer that had ‘done some fi eld work to accomplish his goals’ [16].
There were made 34 parishes’ drawings that
corre-Figure 3. Lisbon in mid XIXth century. Municipality and parishes in 1864
sponded to the all municipality, meanwhile reduced. The limits established for the parishes are very similar to the 1826’s. Concerning the parishes that became the municipality boundary, there are obvious differ-ences, caused by the creation of a circumvallation road, which divided some parishes intra and extra the city walls. These parishes drawing can be used be-tween 1852 and 1885, since during these 33 years only very little changes happened caused by two parishes’ annexation.
4. Lisbon in the end of the XIX
thcentury and in
the beginning of the XX
thcentury
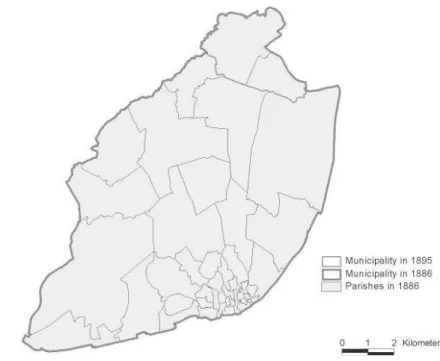
In 1885, Lisbon suffered a new administrative organi-sation, in this case, made by a new circumvallation road and the annexation of some parishes lost in mid century. The parishes’ limits draw for 1885 are valid until the end of the Monarchy in 1910, except for the period between 1886 and 1895, in which the municipal-ity still included two more parishes [Figure 4].
Library and it’s the only example that we have knowl-edge of.
There were 43 parishes in 1885, 45 in 1886 and again 43 in the chart of 1909. Considering that in these years the modifi cations occurred at the municipality limits, with the inclusion of new parishes, and not on the par-ishes limits itself, we can use the same draw for the end of the XIXth and the beginning of the XXth century.
Conclusions
The methodology applied in this study could include other options, probably equally valid. One of them would be to do a digitalisation of the original historical charts and elaborate the polygons of the parishes over them. However, this would turn to be a more com-plex task for further compatibility between the differ-ent charts produced because they have very differdiffer-ent scales and projections.
Nevertheless, our option, and in particular the use of the geographical information system, permitted the reconstitution of the parishes limits in Lisbon for all the XIXth century with a reduced level of error. More
important, it made available a helpful tool for spatial analysis, in a vectorial format that will turn possible in the future the comparative study of multiple historic variants in the last two centuries. At the same time,
Figure 4. Lisbon in the end of the XIXth century. Municipality and parishes in 1886
it’s a signifi cant contribute for the development of the SIGMA’s project since it permits to correct the lack of the system on the cartography of the main city of the country.
References
1. Carta Administrativa Ofi cial de Portugal (1991), Original projection Hayford-Gauss Datum Lisbon, INE, 2005 and Eixos das Via de Lisboa, Original projection Hayford-Gauss Datum 73, Câmara Municipal de Lisboa, 1991.
2. For 1826, Carta Topográfi ca da Cidade de Lisboa, e Bairro de Belém..., scale – 1:5000, s.l., s.n., s.d., Military Archive (Engineering Corp); for 1864, Vidal, Frederico Gavazzo Perry, Planta da cidade de Lisboa..., scale – 1:5000, Lisboa, Lith. de Vasques & [?], 1864, National Library; for 1909, Pires, Caldeira, Planta completa da cidade até ao limite da sua circunvalação, no scale, Lisbon, Anuário Comercial, 1909, National Library.
3. The fi rst results of this project can be consulted in http://www.fcsh.unl.pt/atlas.
Sécu-los XVII a XX, (exposition catalogue), Lisbon, 1997, p. 33; Silveira, Luís Nuno Espinha da, Território e Poder, Cascais, Patrimonia, 1997, p. 140.
5. Câmara Municipal de Lisboa, Divisão administra-tiva de Lisboa, Lisboa, C.M.L., 1960, pp. 5 to 8. 6. One detailed presentation of this methodology
can be found in Silveira, Luís Nuno Espinha da, Território e Poder, pp. 137-140.
7. Rodrigues, Teresa, Lisboa no Século XIX. Dinâmica populacional e crises de mortalidade, Lisbon, 1993, pp. 40 to 51; Lousada, Maria Alexandre, Espaços de Sociabilidade..., Vol. I, pp. 26 to 28 and 104 to 106; Almeida, Pedro Tavares de, ‘Comportamentos eleitorais em Lisboa, 1878-1910’, in Análise Social, Lisbon, no.85, 1985, pp. 149 and followings. 8. The loot of charts representing the capital is, in
most part, known thanks to the studies of Au-gusto Vieira da Silva and some recent expositions about historical cartography. According to those works indications we have consulted the follow-ing archives and institutions: the Military Archive (Engineering Corp), the Lisbon Municipal Archive (Arco do Cego), the National Library, the Olis-siponense Cabinet Studies, the National Archive Institute – Torre do Tombo, the Portuguese Geographic Institute, the City Museum and the Lisbon Geographic Society. Silva, Augusto Vieira da, Notícia Histórica sobre o levantamento da plan-ta topográfi ca de Lisboa, Lisbon, 1914; Os bairros de Lisboa, Lisbon, Imp. Lucas, 1930; Os Limites de Lisboa, Lisboa, Câmara Municipal, 1941; Plantas topográfi cas de Lisboa, Lisbon, Câmara Municipal, 1950 and Dispersos, Lisbon, Câmara Municipal,
1968;Fundação Calouste Gulbenkian, Cartografi a
Portuguesa do Marquês de Pombal a Filipe Folque (1750-1900), Lisbon, 1982 e CNCDP, Cartografi a de Lisboa....
9. See reference no. 2.
10. Planta da Cidade de Lisboa. Nova denominação dos bairros pelo Alvará de 17 de Fevereiro de 1826, no scale, s.l., s.n., s.d., Military Archive (Engineering Corp), and Folque, Fillipe e Silva, F. M. Pereira da, Carta Topographica da Cidade de ..., scale – 1:5000, Lisbon, Direcção Geral dos Trabalhos Geodésicos, 1878, National Library.
11. Vellozo, Eduardo O. Pereira Queiroz, Roteiro das ruas de Lisboa e immediações, Lisbon, 1864, 1869, 1881 and 1888.
12. We just need to consult information regarding the non-urban parishes of the city because, for the others, we had cartography that identifi ed their limits in different moments. It was possi-ble to verify the limits of the parishes of Lumiar, Carnide, Benfi ca, Olivais, Ajuda, Alcântara and São Sebastião da Pedreira. Except for the little differences the books of ‘décimas’ confi rmed the drawing of 1909. Archive of Tribunal de Contas, Décima de Lisboa, DC, 244, AR; DC, 165, AR; DC, 883, AR; DC, 40, AR; DC, 1156, AR.
13. See reference no.2. In association and as read-ing auxiliary to this chart it was used another one existent in the same archive from 1826. See refer-ence no.10.
14. Silva, Augusto Vieira da, As freguesias de Lisboa, p. 27.
15. Silva, Augusto Vieira da, Notícia Histórica..., p. 28; Lousada, Maria Alexandre, Espaços de Socia-bilidade..., Vol. I, p. 27 e CNCDP, Cartografi a de Lisboa..., pp. 19, 33 and 34.