OPEN ACCESS
Research Journal of Information Technology ISSN 1815-7432 DOI: 10.3923/rjit.2017.64.73Research Article
Determinants of Geographic Information Technologies Intention
and Adoption and Mozambique Institutions’ Perspectives
1,2
Nelson Amade,
2Marco Painho and
2Tiago Oliveira
1Universidade Católica de Moçambique (UCM), Beira, Moçambique, 1070 312 Lisboa, Portugal 2NOVA Information Management School (NOVAIMS), 1070 312 Lisboa, Portugal
Abstract
Background and Objective: Many determinant factors are behind the adoption of geographic information technologies (GIT). In that sense institutions must evaluate and analyze these factors before deciding to operate with these technologies. The study seeks to investigate the drivers behind the adoption of GIT at two stages (intention and adoption) applied to a Mozambique context.
Materials and Methods: Data were collected from 110 institutions belonging to Mozambique institutions. The data were analyzed by employing partial least square (PLS) and relevant hypotheses were derived and tested. The research model was estimated using Smart PLS 2.0 M3 software. Results: The results suggested that technology competence, security, competitive pressure are important drivers to explain the intention to adopt GIT. Financial concerns, government policies, donor pressure and intention to adopt are important drivers to explain adoption of GIT. The donor pressure is the only driver that is statistically significant in both intention and adoption of GIT. Conclusion: The findings offer valuable insights to managerial and decision makers in institutions. The combination of three theories, diffusion of innovation theory, technology organization and environment framework and the policy context add value to the research in a holistic approach.
Key words: Geographic information technology, adoption, technology organization, holistic approach, diffusion of innovation
Citation: Nelson Amade, Marco Painho and Tiago Oliveira, 2017. Determinants of geographic information technologies intention and adoption and mozambique institutions perspectives. Res. J. Inform. Technol., 9: 64-73.
Corresponding Author: Nelson Amade, Universidade Católica de Moçambique (UCM), Beira, Moçambique, PhD candidate in NOVA Information Management School, 1070 312 Lisboa, Portugal Tel: (+258) 848042749
Copyright: © 2017 Nelson Amade et al. This is an open access article distributed under the terms of the creative commons attribution License, which permits unrestricted use, distribution and reproduction in any medium, provided the original author and source are credited.
Competing Interest: The authors have declared that no competing interest exists.
INTRODUCTION
In recent decades institutions have become more open to opportunities that technologies are proposing and for that, many institutions around the world are adopting different types of technologies to improve efficiency, flexibility and offer security. Among the most exciting technologies developed, geographic information technologies (GIT) have gained attention based on their ability to support decision makers and provide the right tools for institutions to
accomplish their goals1.
The introduction of new technology approaches in Mozambique such as GIT started recently and the government policies behind their implementation are still to be refined and
disseminated2-6. Currently, the use of these technologies in
institutions claims to be more targeting to competitiveness, donor imposition, need to find new opportunities to maximize efforts and increase the possibilities to reach the goals. For these reasons, it is important to understand the drivers behind the adoption of GIT. Some studies analyze GIT from the
institutions perspective7-15 and some of these are of a
qualitative nature and rely on technology use rather than
adoption16-18. The reasons prompting institutions to adopt
GIT differ from context to context and include factors such as the ability to have a disaster risk management system, improvements in education methods, competitive pressure, donor pressure, innovation, security, improvements in health system approaches, customer satisfaction and natural
resources management7,13-15,19-26. To the best of the authors
knowledge, no published study has conducted a holistic evaluation of the stages that lead Mozambican institutions to adopt GIT (from intention to adopt GIT and GIT adoption).
Therefore, the literature suggests that an understanding
of the African continent and the concept of GIT1 may be a
useful starting point for studying the drivers behind the adoption of these technologies in one of the African countries (Mozambique).
The African continent can be described by its size, natural resources and rapid population growth. Issues related to spatial planning and resources management become vital to the prosperity of the continent. Studies and initiatives (improvement of drought mitigation, planning rural water supply systems, tracing the spatial variation of diseases, determining and predicting electrical conductivity in soils, examining map conservation areas and water resources
and creating a geodatabase, among others)7,27-32 involving
government, private sector, non-governmental organizations
(NGOs) and donor pressure have been undertaken in various African countries involving the adoption and use of GIT as decision support tools.
The GIT can be described as all types of computer platforms and computer systems used in processing georeferenced information. These technologies include geographic information systems (GIS), desktop mapping systems, remote sensing systems (RSS), global positioning systems (GPS), as well as a vast range of hybrid platforms and
sub-systems related to geographic information processing1.
Overtime, these technologies began to be introduced in Mozambique through institutions supported by the public policy approved in 2000 that encourages and proactively promotes the use of information and communication
technology (ICT)3-6 and through donor pressure.
The present research combines features of two models
(diffusion of innovation (DOI) theory33-36 and technology
organization and environment (TOE) framework37,38) and the
policy context, resulting in an integrated framework to explaining the drivers behind the GIT adoption. The DOI theory seeks to explain how new ideas spread through a social
system39 (institutions in the process of adopting a new
technology face complex problems based on their organizational structure, which accommodates and aggregates a group of individuals with a set of procedures and norms). TOE framework explain show innovation processes occur in institutions. Therefore, this study presents an analysis of the drivers behind the adoption of GIT for a specific Mozambique institutions context.
MATERIALS AND METHODS
Pilot interviews were conducted with 30 institutions in Mozambique in 2015, in order to test the questionnaire (accessibility of the questions, structure). The sample was assembled through a random drawing of institutions from public, private and non-government-organizations. The final sample included 110 institutions and the data were collected from people in those institutions operating with these technologies.
Res. J. Inform. Technol., 9 (2): 64-73, 2017
Technology competence (TC) Technology context
Security (Sec)
Financial concerns (FC) Organization
Environment Competitive pressure
(CP)
Intention to adopt GIT The first two statges of assimilation (DOI
theory)
GIT adoption H1a
H1b H2a H2b
H3a H3b
H4a H4b
H5a H5b
Policy context Policy context
Government policies (GP)
Donor pressure (DP) H6a
H6b
Organization size (OS) Controls H7
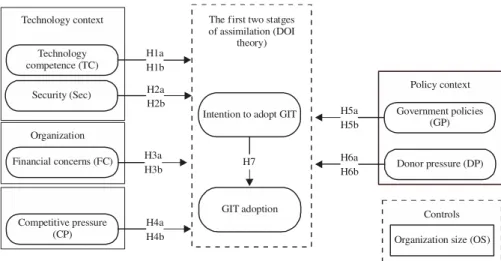
Fig. 1: A proposed research model of GIT
Hypotheses on technology: The technology context refers to the technological environment available in an institution including the assets. It includes the specialized human resources, infrastructure and all of the working procedures. Specialized human resources of an institution are all of the people that have the skills, knowledge and expertise to
operate with the equipment (GIT)38,40,41. Hence, the technology
competence strongly influences the intention and the adoption of GIT.
H1: Technology competence will positively influence GIT intention (H1a) and adoption (H1b).
In the technology context, security is considered the priority to the institution s well-being. A security leak is an incident in which the institution loses its information,
personel records and/or sensitive data42. The lack of
appropriate tools to deal with data in a secure and efficient way will discourage an institution to adopt GIT. Adopting these technologies will bring new initiatives toward data security to deal with the new data in a secure way. Hence, security is a significant driver.
H2: Security fears will negatively influence intention to adopt GIT (H2a) and GIT adoption (H2b).
Hypotheses on organization: The organization context refers to the resources available to support the adoption of an innovation43-47. It refers to the ability of the institution to
accept or refuse the adoption and implementation of an innovation. Good financial balance in an institution can contribute to the decision about implementing GIT.
Hence, financial concerns will determine the way that GIT will or will not be adopted.
H3: Financial concerns will positively influence GIT intention (H3a) and adoption (H3b).
Hypotheses on environment: Competitive pressure is recognized as an adoption motivator and driver in the
innovation adoption literature48. Adopting new technologies
is a wise decision that institutions can consider when dealing with market pressure. Adopting GIT, institutions can obtain greater advantages, new procedures, flexibility, improving production and response time to market needs. Hence, competitive pressure will help institutions to improve their standards.
H4: Competitive pressure will positively influence GIT intention (H4a) and adoption (H4b).
Hypotheses on policy: Government policies in general refer to a group of policies that drive the procedures related to technology adoption. The authority and the vision of the government encourage institutions to implement a technology and continue innovating. When government supports and motivates a specific approach to GIT, institutions will be more willing to adopt GIT3,5,6. Hence,
government policies will motivate institutions to introduce new technologies approaches.
H5: Government policies will positively influence GIT intention (H5a) and adoption (H5b).
As in many African countries, Mozambique s economic activities are financially supported by international
organizations and developed countries aid programs49,50.
Many of these programs have technology requirements for implementation, including in some cases of GIT. It is thus reasonable to expect donor pressure to have an impact on the use of GIT in organizations.
H6: Donor pressure will positively influence intention to adopt GIT (H6a) and GIT adoption (H6b).
Hypotheses on DOI: The technology acceptance model addresses the way new technologies are faced according to users perceptions within a working environment and hypothesizes that beliefs influence attitudes leading to intentions51. Institutions having the intention to adopt
GIT will multiply the possibilities for technology adoption, hence,
H7: Intention to adopt will positively influence GIT adoption.
Data collection: To evaluate the theoretical constructs in a questionnaire and apply that evaluation to the target group of Mozambican institutions, the research followed several steps. First, the questionnaire was created in English and revised by a group of university staff. As the questionnaire was administered in Mozambique, where the formal language is Portuguese, it was then translated from English to Portuguese with support of university staff. To ensure the accuracy of the translations, a professional translator was asked to translate from English to Portuguese and vice-versa. The questionnaire items were created based on published studies (Appendix A) and the authors motivation. All constructs were measured using a seven-point scale ranging from strongly disagree to strongly agree . To test the instrument, a pilot study involving 30 organizations was conducted in Mozambique and the results showed that the scales, the approach and the translation were effective.
Appendix A
Constructs Measurement items Source
Technology competence TC1: The technology infrastructure of my company is available to support GIT* Chan and Chong35
TC2: My company is dedicated to ensuring employees are familiar with GIT TC3: My company has good knowledge of GIT
TC4: My company has a GIT training program
Security (Sec) How do you perceive the risk that … Benlian and Hess52
Sec1: The confidentiality and security of your business data are not guaranteed when adopting GIT solutions?
Sec2: In case of damage, present liability law is still unclear about who will bear the damage? Sec3: The GIT provider will exploit contractual loopholes (i.e., incomplete contracting) to the detriment of your company?
Financial concerns FC1: The organization has a certain amount of money to invest in GIT. (1-Strongly disagree, Zhu et al.33
(FC) 7-Strongly agree,…)
FC2: GIT operating budget as percent of total budget (#)
FC3: Percentage of GIT operating budget supported by other institutions (i.e. donor) (#)*
Competitive pressure (CP) CP1-Our organization thinks that GIT has an influence on competition in their field of activity Oliveira et al.45
CP2-Our organization is under pressure from competitors to adopt GIT CP3: Some of our competitors have already started using GIT
Government policies (GP) GP1: The government has a policy on technology adoption IST-Africa Consortium6
GP2: The government policies are implemented and followed GP3: My organization is under the government policies GP4: Technology adoption is one of the government pillars
Donor pressure (DP) DP1: Donors encourage implementation of GIT IST-Africa Consortium6
(i.e., World bank, USAID) DP2: Donors recommend implementation of GIT and Stubbs et.al.49
DP3: Donors require implementation of GIT DP4: Donors keep the organization innovating
Intention to adopt GIT GITi1: My company intends to use GIT if possible Chan and Chong35
GITi2: My company collects information about GIT with the possible intention of using it GITi3: My company has conducted a pilot test to evaluate GIT
GIT adoption GITa1: My company invests resources to adopt GIT Chan and Chong35
Res. J. Inform. Technol., 9 (2): 64-73, 2017
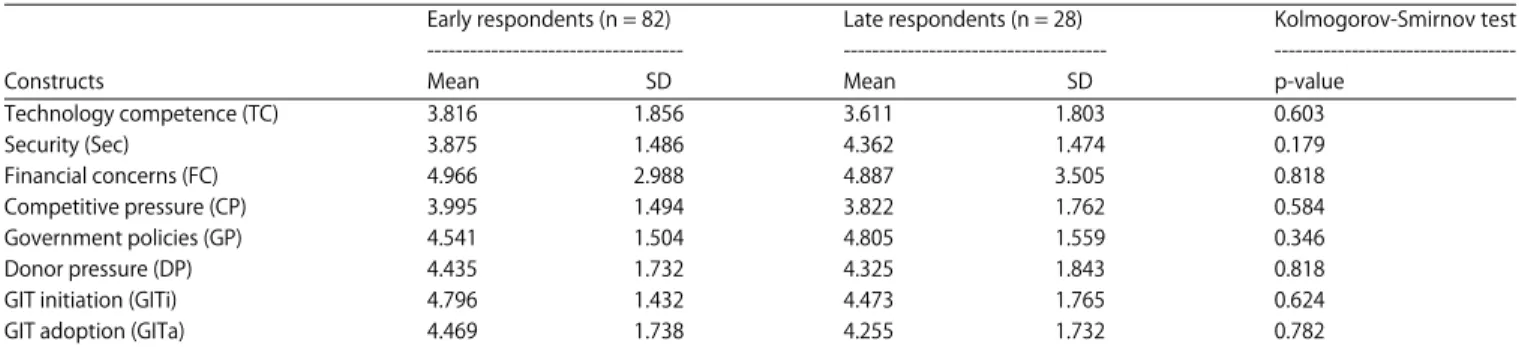
Table 1: Mozambique institutions questionnaire results (early and late respondents and testing possible biases)
Early respondents (n = 82) Late respondents (n = 28) Kolmogorov-Smirnov test --- ---
---Constructs Mean SD Mean SD p-value
Technology competence (TC) 3.816 1.856 3.611 1.803 0.603
Security (Sec) 3.875 1.486 4.362 1.474 0.179
Financial concerns (FC) 4.966 2.988 4.887 3.505 0.818
Competitive pressure (CP) 3.995 1.494 3.822 1.762 0.584
Government policies (GP) 4.541 1.504 4.805 1.559 0.346
Donor pressure (DP) 4.435 1.732 4.325 1.843 0.818
GIT initiation (GITi) 4.796 1.432 4.473 1.765 0.624
GIT adoption (GITa) 4.469 1.738 4.255 1.732 0.782
Table 2: Sample characteristics (n = 110) of industry and organization size
Industry n (sample size) Percentage
Agriculture 13 12
Environment 10 9
Trade 1 1
Construction 4 4
Education 28 25
ICT 7 6
Industrial production 1 1
Economic development 8 7
Natural resources 8 7
Services 4 4
Health 9 8
Transport and communications 4 4
Other 13 12
Organization size (number of employees)
Micro (1-9) 11 10
Small (10-49) 35 32
Medium (50-249) 42 38
Large (> 250) 22 20
The questionnaire was implemented online. An email containing a complete explanation of the research purpose and relevance was then sent to Mozambican public, private and NGO organizations. The institutions details including the contact persons were obtained from the yellow pages of Mozambique, official government websites and persons working in this area. To increase content validity, an explanation of GIT was included in the questionnaire to enable individuals who were not familiar with the topic to answer the questionnaire. To increase response rate, all respondents were invited to provide their email addresses to have the opportunity to receive the findings of the study. The data were analyzed by employing partial least square (PLS)and relevant hypotheses were derived and tested.
Data were collected during the second semester of 2015. A total of 110 valid responses (82 early respondents and 28 late respondents) were obtained by the end of the period from a universe of approximately 2000 organizations. Non-response was attributed to diverse issues, including invalid email addresses, inbox full, lack of updated emails and lack of appropriate persons to respond to the questionnaire, among others.
Statistical analysis: The Kolmogorov-Smirnov (K-S) test was used to compare the sample distributions of the two groups
(early and late respondents)53. The information reported in
Table 1, indicates that the sample distribution of the two groups did not differ significantly, pointing to an absence of non-response bias. The common method bias was examined using Harman s one-factor test. It reveals that the first factor explains 32.8% of the variance, i.e., none of the factors had variance more than the 50% threshold value. Consequently the common method bias was not a serious concern. The results of the study were obtained through the variance-based technique, using partial least square (PLS) because: (i) Some of the items in our data are not distributed normally (p<0.01 based on Kolmogorov-Smirnov test), (ii) The research model has not been tested before and (iii) PLS estimation requires 10 times the largest number of structural paths directed at a
particular construct in the structural model50. The sample
meets the requirements for using PLS. The research model
was estimated using Smart PLS 2.0 M3 software51.
The profiles of the sample and size of responding organization are shown in Table 2.
RESULTS AND DISCUSSION
The measurement model was analyzed first in order to assess reliability and validity, followed by the structural model.
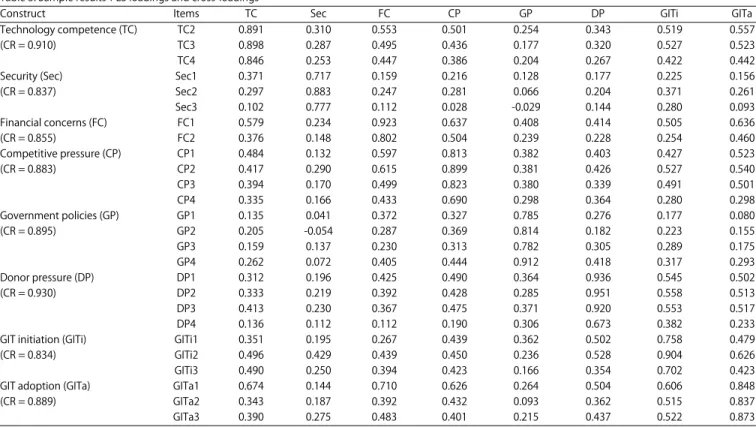
Measurement model: The results of the measurement model are shown in Table 3 and 4, including the construct reliability, convergent validity, indicator reliability and discriminant validity. The construct reliability was tested using the
composite reliability coefficient, which is greater than 0.750.
Furthermore, the indicator reliability was evaluated taking into
consideration that the loadings should be greater than 0.751,53.
As seen in Table 3, the loadings are greater than 0.7, indicating good indicator reliability. To test the convergent validity, the
average variance extracted (AVE) should be greater than 0.554.
The discriminant validity of the constructs was assessed using
Table 3: Sample results-PLS loadings and cross-loadings
Construct Items TC Sec FC CP GP DP GITi GITa
Technology competence (TC) TC2 0.891 0.310 0.553 0.501 0.254 0.343 0.519 0.557
(CR = 0.910) TC3 0.898 0.287 0.495 0.436 0.177 0.320 0.527 0.523
TC4 0.846 0.253 0.447 0.386 0.204 0.267 0.422 0.442
Security (Sec) Sec1 0.371 0.717 0.159 0.216 0.128 0.177 0.225 0.156
(CR = 0.837) Sec2 0.297 0.883 0.247 0.281 0.066 0.204 0.371 0.261
Sec3 0.102 0.777 0.112 0.028 -0.029 0.144 0.280 0.093
Financial concerns (FC) FC1 0.579 0.234 0.923 0.637 0.408 0.414 0.505 0.636
(CR = 0.855) FC2 0.376 0.148 0.802 0.504 0.239 0.228 0.254 0.460
Competitive pressure (CP) CP1 0.484 0.132 0.597 0.813 0.382 0.403 0.427 0.523
(CR = 0.883) CP2 0.417 0.290 0.615 0.899 0.381 0.426 0.527 0.540
CP3 0.394 0.170 0.499 0.823 0.380 0.339 0.491 0.501
CP4 0.335 0.166 0.433 0.690 0.298 0.364 0.280 0.298
Government policies (GP) GP1 0.135 0.041 0.372 0.327 0.785 0.276 0.177 0.080
(CR = 0.895) GP2 0.205 -0.054 0.287 0.369 0.814 0.182 0.223 0.155
GP3 0.159 0.137 0.230 0.313 0.782 0.305 0.289 0.175
GP4 0.262 0.072 0.405 0.444 0.912 0.418 0.317 0.293
Donor pressure (DP) DP1 0.312 0.196 0.425 0.490 0.364 0.936 0.545 0.502
(CR = 0.930) DP2 0.333 0.219 0.392 0.428 0.285 0.951 0.558 0.513
DP3 0.413 0.230 0.367 0.475 0.371 0.920 0.553 0.517
DP4 0.136 0.112 0.112 0.190 0.306 0.673 0.382 0.233
GIT initiation (GITi) GITi1 0.351 0.195 0.267 0.439 0.362 0.502 0.758 0.479
(CR = 0.834) GITi2 0.496 0.429 0.439 0.450 0.236 0.528 0.904 0.626
GITi3 0.490 0.250 0.394 0.423 0.166 0.354 0.702 0.423
GIT adoption (GITa) GITa1 0.674 0.144 0.710 0.626 0.264 0.504 0.606 0.848
(CR = 0.889) GITa2 0.343 0.187 0.392 0.432 0.093 0.362 0.515 0.837
GITa3 0.390 0.275 0.483 0.401 0.215 0.437 0.522 0.873
Table 4: Descriptive statistics, correlations and AVE of the sample
Construct Mean S.D. TC Sec FC CP GP DP GITi GITa
Technology competence (TC) 3.763 1.836 0.878*
Security (Sec) 3.999 1.492 0.324 0.795*
Financial concerns (FC) 4.946 3.111 0.571 0.229 0.864*
Competitive pressure (CP) 3.951 1.560 0.505 0.237 0.668 0.810*
Government policies (GP) 4.608 1.515 0.241 0.069 0.390 0.447 0.825*
Donor pressure (DP) 4.407 1.753 0.355 0.222 0.390 0.470 0.375 0.878*
GIT initiation (GITi) 4.714 1.521 0.561 0.379 0.465 0.549 0.320 0.587 0.793*
GIT adoption (GITa) 4.414 1.731 0.581 0.229 0.648 0.591 0.236 0.521 0.651 0.853*
*: The square root of the average variance extracted (AVE)
two criteria: Cross-loadings and the Fornell-Larcker criterion. For the cross-loading criterion the loadings of each construct should be higher than all cross-loadings50,53. To meet this
criterion we eliminated 2 items (TC1 and FC3). Table 4 reports that the diagonal values (square root of AVE) are greater than off-diagonal values (correlation between constructs). Both criteria were therefore met, providing evidence of discriminant validity of the scales.
Table 3 and 4 report that construct reliability, convergent validity, indicator reliability and discriminant validity are satisfactory, recommending that the constructs are reliable and that it is feasible to test the research model.
Structural model: Assessing the results of the model, the path significance levels were estimated using bootstrap with 5000 resamples. The R2 criterion50 is used to assess the
predictive capacity of the structural model and is the essential criterion for assessing the quality of the model. Examination of
R2 (Fig. 2) shows that the model explains 54.4% of the variation
in intention to adopt GIT and explains 62.3% of the variation in GIT adoption. This reveals that the conceptual model can be considered as substantial.
The analysis results can be summarized as follows.
Technology competence (TC) ( = 0.270, p<0.01), securityβˆ
(Sec) ( = 0.147, p<0.10) and competitive pressureβˆ ( = 0.203, p<0.10) are statistically significant in explainingβˆ intention to adopt GIT, thus confirming hypotheses H1a, H2a and, H4a. Financial concerns (FC) ( = 0.347, p<0.01),βˆ
government policies (GP) ( = -0.145, p<0.1) and intentionβˆ
Res. J. Inform. Technol., 9 (2): 64-73, 2017
Technology competence (TC)
Security (Sec)
Financial concerns (FC)
Competitive pressure (CP) Organization
Environment Technology context
0.270***(H1a) 0.138(H1b)
0.147*(H2a) 0.081(H2b)
-0.021(H3a) 0.347***(H3b)
0.203*(H4a) 0.115(H4b)
0.023(H5a) -0.145*(H5b) Intention to adopt GIT
R = 54.4%2
GIT adoption R = 62.3%2
0.320*** (H7) The first two statges of assimilation (DOI
theory)
Donor pressure (DP) Government policies
(GP) Policy context
0.367***(H6a) -0.170*(H6b)
Organization size (OS) Controls
Fig. 2: Structural model results of research model for GIT in Mozambique context *p<0.1, **p<0.05, ***p<0.01
H6b = 0.170, p<0.1) is statistically significant and is the only construct that explains both intention to adopt GIT and GIT adoption, thereby confirming hypotheses H6a and H6b. The model explains 54.4% of the variation in intention to adopt GIT and 62.3% of the variation in the GIT adoption.
The purpose of this paper was to understand the determinants that explain GIT in two stages of adoption (intention and adoption) in a Mozambique context. The empirical results generally support the model. The subsequent discussion into theoretical and managerial implications.
Theoretical implications: The study brings a threefold contribution: A new context, a new model and new findings. While there are many theoretical studies of GIT, few of these have focuses on understanding the determinants behind GIT adoption in Mozambique.
With regard to a new model, the study builds upon the
DOI theory39 with a focus on decision stages. The study
combined the DOI with the TOE38,40,41,48,54 and added a new
feature to the TOE framework, the policy context, which includes government policies and donor pressure. The model proposes that technology competence, security, financial concerns, competitive pressure, government policies, donor pressure and intention are determinants in explaining intention to adopt GIT in institutions. To the best of the authors knowledge, this study is the first that seeks to understand the drivers behind the adoption of GIT in the Mozambique context using a research model that combines DOI theory, TOE framework and policy context as new input for the study.
Regarding new findings, the results show that technology competence, security, competitive pressure and donor pressure are important drivers to explain the intention to adopt GIT and that financial concerns, government policies,
donor pressure and intention are important drivers to explain actual adoption of GIT. The results reveal that to better understand GIT adoption it is convenient to estimate a model for a specific domain. This is one of the first efforts to provide concrete empirical support for the theories of GIT adoption in a specific context.
Managerial implications: Recognizing and understanding the determinants that lead institutions to adopt GIT will allow managers to make wise strategic decisions to expand their business and gain perceived benefits of adopting GIT, while at the same time identifying further training needs that may overcome barriers to strategic development. Based on the results of the study, managers will be able to set priorities regarding implementation of GIT in institutions. It should be emphasized that in the particular case of Mozambique the funding, restrictions and rules imposed by donor organizations will to a great extent determine the intention to adopt GIT and GIT adoption itself55. This creates a very
special business environment in which the relationship between institution and client is greatly affected by a third party, the donor.
Government policies could encourage the adoption of these technologies, reducing the barriers to these initiatives and promoting feasible technology infrastructure and technical support for institutions.
CONCLUSION
Understanding the determinants that leading Mozambique institutions to adopt GIT is crucial in a way that these technologies are spreading all over the country. Financial concerns, government policies and donor pressure mostly explain adoption of GIT. The donor pressure proved to
be the only construct that explains both intention to adopt GIT and the adoption of GIT. It would be interesting to have a future study that analyzes in depth the role of these variables as drivers of the adoption of these technologies.
SIGNIFICANCE STATEMENTS
This study examines the drivers behind the adoption of GIT through a combination of three theories that can be beneficial for a specific Mozambique context. This study discovers that the donor pressure is the only construct that explains both intention to adopt GIT and the adoption of GIT. The study reveals that the most important constructs in explaining intention to adopt GIT are technology competence, security, competitive pressure and donor pressure. Thus, new theories can be combining to explain the drivers that leading institutions to keep using GIT at post adoption stage.
ACKNOWLEDGMENT
This research was partially funded by NUFFIC, the Dutch organization for internationalization in education, through a doctoral grant (grant no NICHE-MOZ--136).
REFERENCES
1. Harrison, T.M., T. Pardo, J.R. Gil-Garcia, F. Thompson and D. Juraga, 2007. Geographic information technologies, structuration theory and the world trade center crisis. J. Assoc. Inform. Sci. Technol., 58: 2240-2254.
2. FAO., 2015. Mozambique. FAO Representation in Mozambique, Maputo, Mozambique. http://www.fao.org /mozambique/fao-in-mozambique/en/
3. De Renzio, P. and J. Hanlon, 2007. Contested sovereignty in Mozambique: The dilemmas of aid dependence. Managing Aid Dependency Project, GEG Working Paper 2007/25, The Global Economic Governance Programme, University College, Oxford, UK., January 2007.
4. Dominguez-Torres, C. and C. Briceno-Garmendia, 2011. Mozambique's infrastructure: A continental perspective. Policy Research Working Paper 5885, The World Bank, Africa Region, Sustainable Development Unit, September 2011. 5. World Bank, 2011. Africa's future and the World Bank's
support to it. The World Bank, Africa Region, March 2011. http://siteresources.worldbank.org/INTAFRICA/Resources/ AFR_Regional_Strategy_3-2-11.pdf
6. IST-Africa Consortium, 2012. Guide to ICT policy in IST-Africa partner countries. Version 2.2, April 20, 2012, IST-Africa Consortium, pp: 1-143. http://ist-africa.org/home/files/IST-Africa_ICTPolicy_200412.pdf
7. Berisso, Z.A. and W.T. de Vries, 2010. Exploring characteristics of GIS adoption decisions and type of induced changes in developing countries: The case of Ethiopia. Electron. J. Inform. Syst. Dev. Ctries., 40: 1-16.
8. Mellino, S., E. Buonocore and S. Ulgiati, 2015. The worth of land use: A GIS-emergy evaluation of natural and human-made capital. Sci. Total Environ., 506: 137-148. 9. Bergher, I.S., M.E. Nappo, A.G. da Silva, A.R. dos Santos,
J.E. Simon and A.P.G. de Faria, 2015. GIS tools use to identify routes for ecological corridors formation between Atlantic forest (Mata Atlantica) fragments in the South region OFESPIRITO Santo, Brazil. Aust. J. Basic Applied Sci., 9: 273-281.
10. Hasmadi, I.M. and S.S. Imas, 2010. Empowering GIS education program: Is GIS as a science, art or tool? J. GIS Trends, 1: 1-7. 11. Ramadhan, A., D.I. Sensuse and A.M. Arymurthy, 2011. Assessment of GIS implementation in Indonesian e-Government system. Proceedings of the International Conference on Electrical Engineering and Informatics, July 17-19, 2011, Bandung, Indonesia, pp: 1-6.
12. Rose, R.A., D. Byler, J.R. Eastman, E. Fleishman and G. Geller et al., 2015. Ten ways remote sensing can contribute to conservation. Conserv. Biol., 29: 350-359.
13. Al-Kodmany, K., 2012. Utilizing GIS in nonprofit organizations for urban planning applications: Experiences from the field. J. Geogr. Inform. Syst., 4: 279-297.
14. Gotz, C., J. Frates and S. Weschler, 2009. Geographic Information Systems (GIS) in health organizations: Emerging trends for professional education. California Geogr., 49: 87-106.
15. Duval-Diop, D., A. Curtis and A. Clark, 2010. Enhancing equity with public participatory GIS in hurricane rebuilding: Faith based organizations, community mapping and policy advocacy. Community Dev., 41: 32-49.
16. Walravens, N., 2015. Mobile city applications for Brussels citizens: Smart City trends, challenges and a reality check. Telematics Inform., 32: 282-299.
17. Feng, G.C., 2015. Factors affecting internet diffusion in china: A multivariate time series analysis. Telematics Inform., 32: 681-693.
18. Zhu, D.H., Y.P. Chang and J.J. Luo, 2016. Understanding the influence of C2C communication on purchase decision in online communities from a perspective of information adoption model. Telematics Inform., 33: 8-16.
19. Bertazzon, S., 2014. GIS and public health. ISPRS Int. J. Geo-Inform., 3: 868-870.
20. Chainey, S. and J. Ratcliffe, 2013. GIS and Crime Mapping. John Wiley and Sons, New York, USA., ISBN-13: 9781118685198, Pages: 448.
Res. J. Inform. Technol., 9 (2): 64-73, 2017
22. Elwood, S., 2006. Beyond cooptation or resistance: Urban spatial politics, community organizations and GIS-based spatial narratives. Ann. Assoc. Am. Geogr., 96: 323-341. 23. Peduzzi, P., H. Dao, C. Herold and F. Mouton, 2009. Assessing
global exposure and vulnerability towards natural hazards: The disaster risk index. Nat. Hazards Earth Syst. Sci., 9: 1149-1159.
24. Van Westen, C.J., 2013. Remote Sensing and GIS for Natural Hazards Assessment and Disaster Risk Management. In: Treatise on Geomorphology, Volume 3: Remote Sensing and GIScience in Geomorphology, Bishop, M.P. (Ed.). Chapter 10, Elsevier, New York, USA., ISBN: 978-0-08-088522-3, pp: 259-298.
25. Armenakis, C. and N. Nirupama, 2013. Prioritization of disaster risk in a community using GIS. Nat. Hazards, 66: 15-29. 26. UNOOSA., 2010. Geoinformation for Disaster and Risk
Management: Examples and Best Practices. Joint Board of Geospatial Information Societies, United Nations Office for Outer Space Affairs (UNOOSA), Copenhagen, Denmark, ISBN 978-87-90907-88-4, Pages: 142.
27. Chirowodza, A., H. van Rooyen, P. Joseph, S. Sikotoyi, L. Richter and T. Coates, 2009. Using participatory methods and Geographic Information Systems (GIS) to prepare for an HIV community-based trial in Vulindlela, South Africa (Project accept-HPTN 043). J. Community Psychol., 37: 41-57. 28. Rabley, P., 2009. Ghana project leverages GIS-based title
registration and microfi nance to alleviate poverty. In: GIS Best Practices: GIS in Africa, Environmental Systems Research Institute (ESRI), Redlands, CA., USA., March 2009, pp: 39-46. 29. Swetnam, R.D. and B. Reyers, 2011. Meeting the challenge of
conserving Africa's biodiversity: The role of GIS, now and in the future. Landsc. Urban Plann., 100: 411-414.
30. Mentis, D., S. Hermann, M. Howells, M. Welsch and S.H. Siyal, 2015. Assessing the technical wind energy potential in Africa a GIS-based approach. Renew. Energy, 83: 110-125. 31. Munch, Z. and J. Conrad, 2007. Remote sensing and GIS based
determination of groundwater dependent ecosystems in the Western Cape, South Africa. Hydrogeol. J., 15: 19-28. 32. Cilliers, D.P., T.C. de Klerk and L.A. Sandham, 2013. Reflecting
on GIS-related research in South Africa: 1980-2012. S. Afr. Geogr. J., 95: 70-90.
33. Zhu, K., S. Dong, S.X. Xu and K.L. Kraemer, 2006. Innovation diffusion in global contexts: Determinants of post-adoption digital transformation of European companies. Eur. J. Inform. Syst., 15: 601-616.
34. Zhu, K., K.L. Kraemer and S. Xu, 2006. The process of innovation assimilation by firms in different countries: A technology diffusion perspective on e-business. Manage. Sci., 52: 1557-1576.
35. Chan, F.T.S. and A.Y.L. Chong, 2013. Determinants of mobile supply chain management system diffusion: A structural equation analysis of manufacturing firms. Int. J. Prod. Res., 51: 1196-1213.
36. Hameed, M.A., S. Counsell and S. Swift, 2012. A conceptual model for the process of IT innovation adoption in organizations. J. Eng. Technol. Manage., 29: 358-390. 37. Nkhoma, M. and D. Dang, 2013. Contributing
factors of cloud computing adoption: A technology-organisation-environment framework approach. Int. J. Inform., 1: 38-49.
38. Oliveira, T. and M.F. Martins, 2011. Literature review of information technology adoption models at firm level. Electron. J. Inform. Syst. Eval., 14: 110-121.
39. Foxon, T. and P. Pearson, 2008. Overcoming barriers to innovation and diffusion of cleaner technologies: Some features of a sustainable innovation policy regime. J. Cleaner Prod., 16: S148-S161.
40. Aboelmaged, M.G., 2014. Predicting E-readiness at firm-level: An analysis of Technological, Organizational and Environmental (TOE) effects on E-maintenance readiness in manufacturing firms. Int. J. Inform. Manage., 34: 639-651. 41. Wang, Y.W., Y.S. Wang and Y.F. Yang, 2010. Understanding
the determinants of RFID adoption in the manufacturing industry. Technol. Forecast. Social Change, 77: 803-815. 42. Flores, W.R., E. Antonsen and M. Ekstedt, 2014. Information
security knowledge sharing in organizations: Investigating the effect of behavioral information security governance and national culture. Comput. Secur., 43: 90-110.
43. Lee, S. and K.J. Kim, 2007. Factors affecting the implementation success of internet-based information systems. Comput. Hum. Behav., 23: 1853-1880.
44. Lippert, S.K. and C. Govindarajulu, 2006. Technological, organizational and environmental antecedents to web services adoption. Commun. IIMA, 6: 147-160.
45. Oliveira, T., M. Thomas and M. Espadanal, 2014. Assessing the determinants of cloud computing adoption: An analysis of the manufacturing and services sectors. Inform. Manage., 51: 497-510.
46. Park, S.C. and S.Y. Ryoo, 2013. An empirical investigation of end-user's switching toward cloud computing: A two factor theory perspective. Comput. Hum. Behav., 29: 160-170. 47. Chan, E.Y. and N.U. Saqib, 2015. Online social networking
increases financial risk-taking. Comput. Hum. Behav., 51: 224-231.
48. Ruivo, P., T. Oliveira and M. Neto, 2014. Examine ERP post-implementation stages of use and value: Empirical evidence from Portuguese SMEs. Int. J. Account. Inform. Syst., 15: 166-184.
49. Stubbs, T.H., A.E. Kentikelenis and L.P. King, 2016. Catalyzing aid? The IMF and donor behavior in aid allocation. World Dev., 78: 511-528.
50. Ward, H. and H. Dorussen, 2015. Public information and performance: The role of spatial dependence in the worldwide governance indicators among african countries. World Dev., 74: 253-263.
51. Wentzel, J.P., J.M. Wentzel, D.K. Sundar and V.S. SarmaYadavalli, 2010. Drivers of e-Commerce/e-Business success: Constructs, antecedents and moderators in adoption of technology enabled products and services. Proceedings of the 41st International Conference on Computers and Industrial Engineering, October 23-25, 2011, Los Angeles, CA., USA., pp: 924-929.
52. Benlian, A. and T. Hess, 2011. Opportunities and risks of software-as-a-service: Findings from a survey of IT executives. Decis. Support Syst., 52: 232-246.
53. Lopes, R.H.C., 2011. Kolmogorov-Smirnov Test. In: International Encyclopedia of Statistical Science, Lovric, M. (Ed.). Springer, Berlin, Germany, ISBN: 978-3-642-04897-5, pp: 718-720.
54. Gareeb, P.P. and V. Naicker, 2015. Determinants for South African SMEs to adopt broadband Internet technologies. Electron. J. Inform. Syst. Dev. Ctries., 68: 1-24.