International Food and Agribusiness Management Review
Volume 20 Issue 5, 2017; DOI: 10.22434/IFAMR2016.0093
Received: 1 May 2016 / Accepted: 14 April 2017
Understanding the determinants of adoption of enterprise
resource planning (ERP) technology within the
agri-food context: the case of the Midwest of Brazil
RESEARCH ARTICLE
Caetano Haberli Jr a, Tiago Oliveirab, and Mitsuru Yanazec
aProfessor, Superior School of Advertising and Marketing (ESPM), Universidade de São Paulo
(USP), Butantã, São Paulo 03178-200, Brazil; PhD Candidate at IMS, Universidade Nova de Lisboa, Campus de Campolide, 1070-312 Lisbon, Portugal and School of Communication and Arts, Universidade de São Paulo (USP), São Paulo, Brazil; Owner, Agroipes, Institute of Research
and Sectorial Studies, Rod. Sc 405 4850, Florianopolis, Santa Catarina 88065-000, Brazil
bAssistant Professor and Coordinator, NOVA Information Management School
(NOVA IMS)Universidade Nova de Lisboa, 1070-312 Lisbon, Portugal
cProfessor of Marketing & Communication and Coordinator, School of Communications and
Arts, Universidade de São Paulo (ECA/USP), Butantã, São Paulo 03178-200, Brazil
Abstract
The object of this study is to investigate the determinants of adoption of Enterprise Resource Planning (ERP) technology in agricultural farms located in the Central-West region of Brazil. The data was collected from 200 in-depth interviews with soy, corn and cotton farmers from the State of Mato Grosso, Brazil. Structural Equations methodology was used to analyze the data and hypothesis. The conceptual model was proposed by combining Diffusion of Innovations and Technology-Organization-Environment theories. The results provide information to agribusiness owners, managers and administrators to promote and incentivize the use of ERP. Politicians and farmers can evaluate each scenario and support their political and administrative decisions through the evaluation of socioeconomic and environmental performances of agricultural exploration as a result of technological innovation. This leads to a need for an analytical tool for the farmers, with the objective of supporting the adoption of optimized ERP for agri-food activities.
Keywords: enterprise resources planning, ERP technology, management models, agribusiness JEL code: Q0
Corresponding author: [email protected]
1. Introduction
Although the Brazilian agricultural production represents a significant share of total world food production, Brazilian farms do not have a well-organized business structure, neither do they have adequate control of their production process to reach a new level of efficiency and effectiveness. This is due to a lack of Enterprise Resource Planning (ERP) in the farms. As a result, it can cause considerable production loss (Orsi et al., 2017).
The decision makers in the agricultural sector deal with volatile and risk variables such as management of physical storage, controlling transportation costs, exposure to climate issues, vulnerability to weeds, pests and diseases. The ERP system can minimize the risks on decisions taken on this environment.
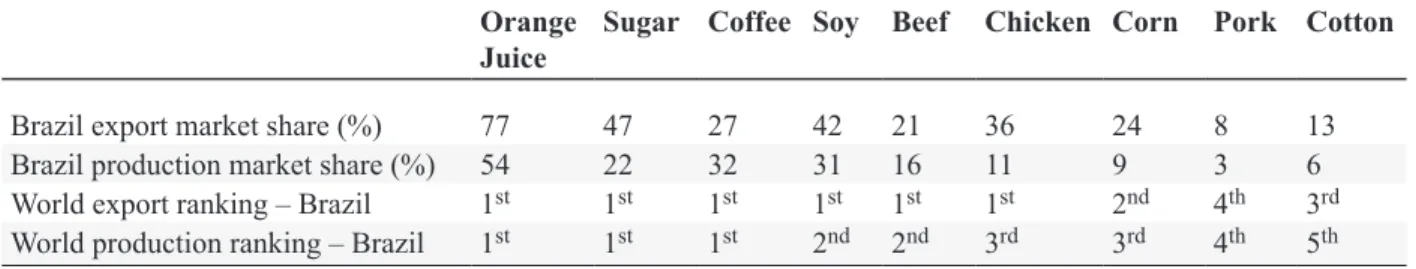
The purpose of this study is to understand the determinants of the adoption of ERP as a management model compatible with the farm’s needs, and also to evaluate the benefits of this model to provide improvement in the competitiveness among farms. The only few research found on the topic explores daily operational routines focusing essentially on production and productivity. It is difficult to find studies regarding the applicability of ERP through an organizational and processual point of view, specifically regarding the direct effects of the use of this technology and some aspects of this business. Brazil is a major world food producer (Table 1). This scientific study evaluates the best practices for ERP in Brazilian farms to uphold the country’s position among the main world producers of protein, fiber and energy.
Studies about the conceptual model of future farm management information system debates how farmer’s paradigms are changing the management tasks in order to achieve economic sustainability and interaction to the environment (Sørensen et al., 2010). In 2011, Sørensen et al. developed a study to support and guide the functional requirements for a future management information system.
The paper concerning ERP in agriculture, ‘Lessons learned from the Dutch horticulture’, evaluates and explores the experiences of the applicability of ERP in agri-food companies (Verdouw et al., 2015). In a paper about farm management information system called, ‘Current situation and future perspectives’, the authors acknowledge that information systems in the farms evolved from only keeping records to more complex systems supporting production management (Fountas et al., 2015).
In order to fulfill the increased demands from partners, consumers, government organizations and food processing companies, farms need to develop a knowledge-based economy which shares information and organized data (Wolfert et al., 2010).
These needs inspired us to establish an integrated research model by gathering the determinants of adoption of an adequate ERP and combining the Technology Organization Environment (TOE) (Tornatzky and Fleischer, 1991) and Diffusion of Innovation Theory (DOI) framework (Rogers, 1993). The purpose of this model is to provide information to decision-makers (i.e. politicians and farmers) and to encourage the evaluation of the farm’s results based on its resource planning choices. This motivation is the result that can be seen on
Table 1. Brazil position in the world ranking of food producing (adapted from USDA and Agri-Business Sector Value, 2015, 2016; https://www.fas.usda.gov/data).
Orange Juice
Sugar Coffee Soy Beef Chicken Corn Pork Cotton
Brazil export market share (%) 77 47 27 42 21 36 24 8 13
Brazil production market share (%) 54 22 32 31 16 11 9 3 6
World export ranking – Brazil 1st 1st 1st 1st 1st 1st 2nd 4th 3rd World production ranking – Brazil 1st 1st 1st 2nd 2nd 3rd 3rd 4th 5th
the performances from innovations on the socioeconomical, environmental and agricultural exploration. (Janssen and Van Ittersum, 2007).
To evaluate the research model and investigate the determinants, we collected the data of 200 soy, corn and cotton producers in the Mato Grosso state. Therefore, this study presents a holistic evaluation of the determinants to make a theoretical contribution to the adoption of ERP for agricultural farms.
2. Agri-business in Brazil and background about Enterprise Resource Planning
Brazilian agri-business has been improving in the last decade. Brazilian farmers excelled in production techniques and overcame technological issues to reach high productivity levels comparable to the larger world food producers. This progress can be certified by looking at Brazil’s position on the world ranking of food production and food exports in 2013/2014 (Table 1).
ERP Systems require simultaneous changes in the business process, information sharing and the use of complex data (Amoako-Gyampah and Salam, 2004). They process information from different functional areas and integrate them to identify and incorporate the best business practices (Kumar and Van Hillegersberg, 2000). An understanding of the processed and integrated information from different functional areas (Madapusi and D’Souza, 2012) can support ERP development for agribusiness companies. Finding the critical elements of the simultaneous changes that are going on and identifying the success drivers can define a different approach to implement ERP (Zhang et al., 2005).
According to Ruivo et al. (2012), the implementation of ERP allows companies to increase its value, achieve trade efficiency, enhance internal collaboration and improve business analysis which are important determinants in this process. Therefore, we will analyze how the ERP systems can contribute to agricultural production organizations.
Agribusiness is part of a globalized economic environment. Universal operations are indispensable to the integration of providers, partners and customers (Yusuf et al., 2004). The increasing necessity for food production has led to new research in order to optimize its productivity. This has been achieved by the increased use of technology which incorporates the ideal combination of specific software and hardware (Orlovski et al., 2012).
Efforts to adopt information technology (IT) and systems such as ERP support business integration and decision-making (Yusuf et al., 2004).
Management principles and techniques, sustainability and evaluation of the farm project, management support, process reengineering, consulting and budget services are crucial elements for ERP’s implementation (Ehie and Madsen, 2005). Considering the innovation process has two main stages of adoption and implementation (Damanpour and Schneider, 2009), the overall results can be significantly increased by a combination of organizational factors as well as the use of technology and innovation (Karimi et al., 2007). Benefits obtained from the automation of business processes and the use of the ERP system improve decison-making in all organizational levels (Velcu, 2010) which applies to agribusiness companies. However, it is necessary to face and accept the issue that managers still do not have the knowledge and technical skills to handle the system and processes which can produce inaccurate data gathering and some mistrust regarding the use of this technology (Hakim and Hakim, 2010). ERP implementation is a slow process and demands resources (Tsai et al., 2011). An understanding of the process and information packages among functional areas is necessary. Although ERP implementation represents a significant investment (Madapusi and D’Souza, 2012; Zeng and Skibniewski, 2013), it can have an important impact in the organization’s operational and process performances (Madapusi and D’Souza, 2012). Besides the high investment level, implementation risks are also high. Countless complex elements in the organization can interfere in the implementation such as
user’s low-level of acceptance of the technology, changes in the information environment, instability in the management environment and the complexity of the ERP system (Hung et al., 2012).
On the other hand, after a successful ERP implementation, it is possible to observe relevant effects in the social capital which is the (1) learning opportunity; (2) desire to learn; and (3) increase in abilities. Those results can be attributed to the complexity of the ERP system which compels users to solve challenges, acquire knowledge and develop new abilities to run tasks and make decisions (Ruivo et al., 2012).
It is important for the managers to set the priorities and goals to be reached in each ERP implementation phase which will contribute to the maximization of the whole process (Ram et al., 2013). The improvements in process efficiency achieved by the ERP system can deliver the competitive advantage needed by organizations in a global market context where their strategies are affected by many different elements especially the competing companies (Rouyendegh et al., 2014).
The ERP implementation process and the achievements reached by it are distinct for each organization (Rouyendegh et al., 2014). According to studies of Small and Medium Enterprises (SMEs), improvements in strategic planning for Information Systems (IS) helps the companies to understand the benefits that the ERP system can offer (Zach et al., 2014).
It is also important to state that ERP experts are not easy to find in the market which can deliver an extra challenge to SMEs as they need to train and capacitate their employees on the use of this tool (Esteves, 2014). A particular study of SMEs in Portugal shows that ERP implementation was a determinant for the company’s performance in management, finance and tax accounting as well as the company’s management control (Ruivo et al., 2014). Although it is possible to find good results in the field, a considerable number of companies do not reach the expected goals after implementing the ERP system, These failures can be accounted for by the improper use of the system and its full resources (Chou et al., 2014; Ruivo et al., 2012).
In many cases, the use of ERP does not achieve business process control, costs reductions, increase in profits and an influence on the companies key’s performance indicators (Gajic et al., 2014). Therefore, organizations must find ways to simplify the use of the system because once the system reaches its efficiency, it will provide the direct learning ability and desire to the users (Chou et al., 2014). It is important to understand that any progress on the use of the strategic assets will also contribute directly to business development (Wood et al., 2014).
3. Methodology
The study is focused on the innovation adoption phase. Two theories are usually used to explore similar cases in organizations of distinct nature; DOI (Rogers, 1993) and TOE Framework (Tornatzky and Fleischer, 1991).
TOE Framework identifies the process used by a company to adopt and implement innovations by considering the technological, organizational and environmental context (Tornatzky and Fleischer, 1991). The technological context embraces relevant internal and external technology as tools and processes while the organizational context is related to the company’s features and its assets such as company size, hierarchy, process procedures, administrative structure, human resources, extra resources and employee connections. The environmental context is influenced by market elements such as the size and structure of the industry, company’s competitors, macroeconomics and the regulatory environment. All three contexts can present opportunities and threats which influence how a company sees, searches and adopts new technologies.
On the other hand, DOI Theory studies the spread of innovations and how it is communicated through channels over time and inside a particular social environment (Rogers, 1993). Each individual is deemed to hold different levels of innovation acceptance. This paradigm of diffusion was spread during the fifties and sixties among sociology researchers of rural areas (Valente and Rogers, 1995).
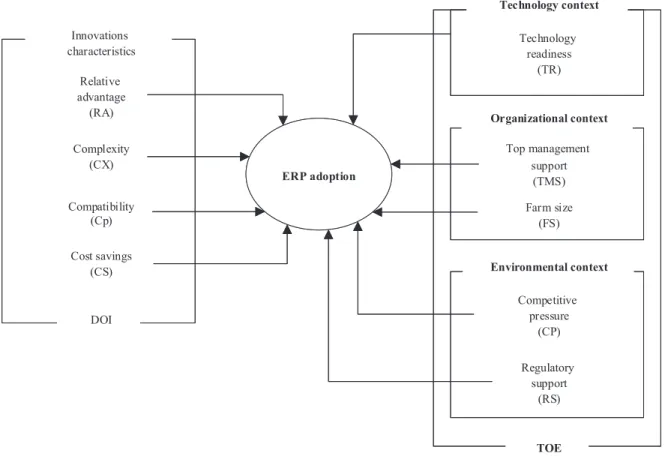
DOI and TOE Theories have been widely used in studies concerning the adoption of innovative technology and they have consistent empiric support (Oliveira et al., 2014). The benefits of merging TOE concepts to reinforce the DOI theory are already well recognized (Hsu et al., 2006). Using DOI and TOE together helps to provide a more comprehensive perspective about technology adoption including the technological context aspects, organizations and external environment (Zhu et al., 2006a). DOI and TOE Theories (Figure 1) complement each other successfully (Park et al., 2012).
This paper presents a conceptual model combining DOI and TOE and also includes nine constructs. Based on the DOI theory, the constructs’ Relative Advantage (RA), Complexity (Cx), Compatibility (Cp) and Cost Savings (CS) were selected. The first three (RA, Cx and Cp) are attributes of innovation. Technology Readiness (TR), Top Management Support (TMS), Farm Size (FS), Competitive Pressure (CP) and Regulatory Support (RS) are constructs used from the TOE theory. The TR construct is related to the technological context, TMS and FS are related to the organizational context and CP and RS are related to the environmental context.
Rogers (1993) addresses 5 adoption factors, i.e. relative advantage, compatibility, complexity, trialability and observability. The trialability and observability are not widely used in IT innovation studies (Chong
et al., 2009). Following the general orientation of the research IS, we disconsidered these two attributes because they are not relevant to the ERP technology (Oliveira et al., 2014). In many IT innovation studies, trialability and observability are excluded because they are not consistently related to the diffusion process of innovation (Martins et al., 2016).
Rogers (1993) defines Innovation Relative Advantage as the degree in which innovation is understood as a better option than the idea it is replacing at that moment. Studies confirmed that Relative Advantage
Figure 1. Research Model combining Technology, Organization and Environment (TOE) Framework and Diffusion of Innovation Theory (DOI). ERP = Enterprise Resource Planning.
ERP adoption
Cost savings (CS) Relative advantage
(RA)
Complexity (CX)
Compatibility (Cp)
Technology readiness
(TR)
Top management support
(TMS)
Farm size (FS)
pressure
Regulatory support Innovations
characteristics
DOI
Organizational context
Environmental context Technology context
TOE (CP) Competitive
(RS)
is a significant variable and is positively related to innovation adoption (Premkumar and Roberts, 1999). Innovations that present clear benefits on creating strategic efficiency (i.e. the increase in the number of prizes received for harvest or credit; the anticipation of business) and operational efficiency (i.e. the reduction on expenses funding) have greater chances of adoption. If the benefits of ERP technology exceed the benefits of current practices and procedures, the adoption of ERP technology would be positively influenced. H1(+):Relative Advantage has a positive influence on ERP adoption.
Complexity is the degree that an innovation is considered to be relatively hard to understand and use (Rogers, 1995). There is a better chance of approval if new technology is integrated and assimilated in business operations during the implementation phase. ERP can also gather real-time information to support main decisions in complex operations. However, its Complexity creates some doubts about its implementation and for this reason, it decreases the chances of approval. Therefore, Complexity is negatively associated to adoption: H2(-): Complexity has a negative influence on ERP adoption.
Compatibility is the perception and degree of alignment with previously established values (Valente and Rogers, 1995). This is an important determinant of innovation adoption (Tornatzky and Klein, 1982). ERP adoption can support high risk decisions by anticipating the purchase of an input material such as seeds and fertilizers, the optimum timing to acquire defense products for crops considering historical weather data and forecasts which have an impact on pests and crop diseases, as well as the sale and production of crops considering macroeconomical forecast. ‘The main motivation for bringing this hypothesis is because the industry trend on operating in a volatile and high risk environment (Xouridas, 2015). H3(+):Compatibility has a positive influence on ERP adoption.
Innovation adoption which leads to Cost Savings are considered good for the company. If the cost can be controlled and accounted for, there is a higher likelihood of companies adopting the technology (Tornatzky and Klein, 1982). Cost Savings is verified as a relevant variable for innovation adoption. H4(+): Cost Savings has a positive influence on ERP adoption.
Expertise is an important factor which is positively related to new technology adoption (Nordin et al., 2014). Companies which are not familiar with IT are probably not aware of innovations, or are more resistant to adopting new technologies. Organization features including structural elements and specialized human resources affect the technological context concerning innovation adoption. H5(+): Technology Readiness has a positive influence on ERP adoption.
Many studies show that the top management is creating a supportive environment with adequate resources for new technology adoption (Premkumar and Roberts, 1999). The support from the top management plays a relevant role in innovation adoption because it guides budget relocation, integration of services and reengineering of processes (Chou et al., 2014). The top management is one of the determinants of the organization’s culture. The adjustment of the organization’s culture because of information systems is indispensable for ERP implementation success. Therefore, the success of ERP implementation increases as the top management promotes and supports it within the organization culture (Ke and Wei, 2008). H6(+): Top Management Support has a positive influence on ERP adoption.
Studies indicate that the organization size is related to the impact of new technologies adoption (Zhu et al., 2006a). Large farms should have larger budgets for improvements, and they are capable of experiencing innovations faster them small properties. Moreover, large farms are more capable of raising funds from banks and investors. Going against the odds, some small farms are capable of taking risks in new technology (Martins et al., 2014). H7(+): Farm Size has a positive influence on ERP adoption.
Competitive Pressure is the force a company experiences from similar competitors in the same industry (Gatignon and Robertson, 1989). One characteristic of the agribusiness is a commoditized market, which strives towards a perfect competition environment. This scenario makes the adoption of new technologies like
ERP a non-essential tool for the competitive strategy in the market, because it only delivers process innovation instead of product innovation. Otherwise, considering the global competition, this external pressure from producer countries can become relevant and can be strategic for the company. H8(+): Competitive Pressure has a positive influence on ERP adoption.
In Brazil, the government regulation to support the adoption of new technologies is not clearly defined yet. This hypothesis is concerned about the legal protection of farm activities. H9(-): Regulatory Support has a negative influence on ERP adoption.
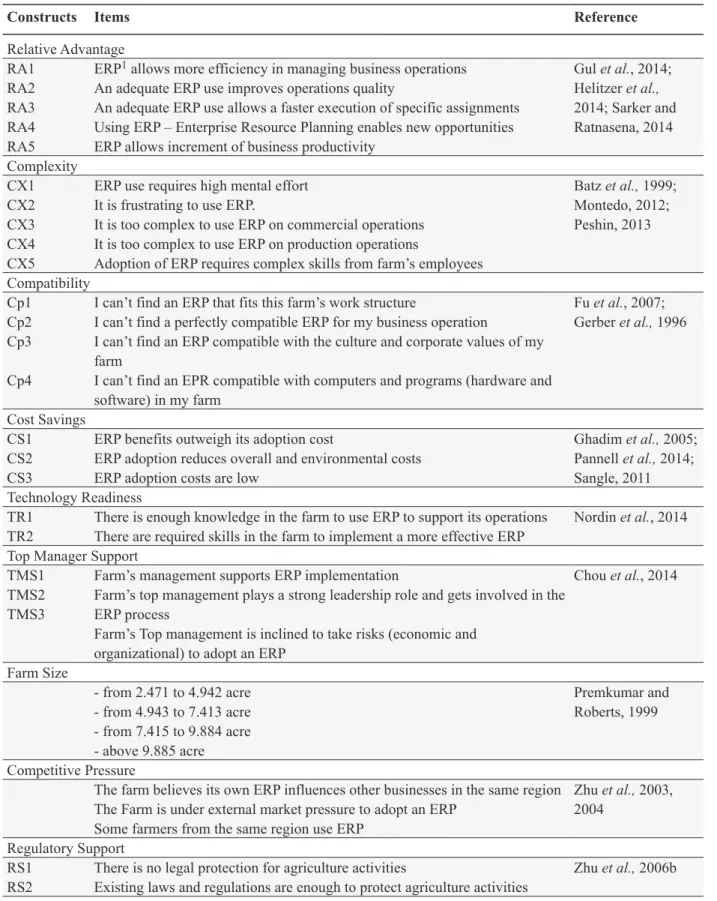
A proper tool was developed and adapted to collect data from the companies in this study. To evaluate others studies concerned about the same constructs in the Table 2, we examined papers found related to researches in the agribusiness. Some of the constructs were not found in the same study field and to fulfill the gap, we extended the research to other commoditized markets.
Interviews were realized between August 1st and 21st of 2014 in Mato Grosso (Central-West region of Brazil). The tool applied to collect data was a structured survey focused on measuring the variables/determinants of ERP adoption described in the Table 2. The questions proposed were based on the DOI and TOE theories and were validated by applying in-depth interviews (Boyce and Neale, 2006) with ten agribusiness consultants.
A quantitative method was used in this study and personal interviews with owners or farms managers were conducted on site (farms).
Experts and researchers in the agriculture sector collected data through personal interviews. Consistency was maintained by using a 5 point ranking system varying from ‘strongly disagree’ to ‘strongly agree’ for the evaluation of DOI variables such as Rrelative Advantage, Complexity, Compatibility and Cost Savings as well as TOE variables like Technology Readiness, Top Management Performance, Farm Size, Competitive Pressure and Regulatory Support.
We have found some qualitative evidences during the interviews: (1) how can an ERP help me to solve my management problems? (Lambim, 2000); (2) does the ERP can solve my long term problems? (Bloch and Richins, 1983). Therefore, we have noticed that the perception of the ERP process and ERP image can have a strong influence on the farm management and also on the individual’s behavior. (De Toni and Schuler, 2007). The interviews were conducted with the necessary care considering these aspects.
We used ‘simple random sampling’ as the criteria to select the sample for this study. In addition to the inquiries on Table 2, farmers were asked about their job position in the farm, level of education, how they managed the farm, whether there were other professionals working in the farm administration, precision agriculture. These questions gave us qualitative information about the interviewees. The sample is composed of 200 valid interviews with soy, corn and cotton producers with medium (2,471 to 9,884 acre) and large farm sizes (above 9,885 acre). This can be seen in Table 3. Small producers were not included in this study because the ERP system can be easily found in medium and large farms.
The survey sample is composed of interviewees with the following profiles. Interviewees with college degrees made up 19%, 14.5% had incomplete college degrees while 38.5% had high school certificates. The interviewees’ average age was 38 years. 56.5% responded that there were other specialized professionals in management positions in their farms while 30.5% were the only ones in charge. 75.5% of the interviewees performed at least one precision agriculture operation in the crops waiting to achieve: (1) 86.1% reduced costs of planting, caring for and harvesting crops; (2) 76.2% reduced losses related to pests; (3) 28.5% prevented weather conditions; and (4) 12,6% obtained sustainability participation credits (low carbon rates agriculture).
Table 2. Data collection tool: quantitative variables.
Constructs Items Reference
Relative Advantage RA1 RA2 RA3 RA4 RA5
ERP1 allows more efficiency in managing business operations An adequate ERP use improves operations quality
An adequate ERP use allows a faster execution of specific assignments Using ERP – Enterprise Resource Planning enables new opportunities ERP allows increment of business productivity
Gul et al., 2014; Helitzer et al.,
2014; Sarker and Ratnasena, 2014 Complexity CX1 CX2 CX3 CX4 CX5
ERP use requires high mental effort It is frustrating to use ERP.
It is too complex to use ERP on commercial operations It is too complex to use ERP on production operations
Adoption of ERP requires complex skills from farm’s employees
Batz et al., 1999; Montedo, 2012; Peshin, 2013 Compatibility Cp1 Cp2 Cp3 Cp4
I can’t find an ERP that fits this farm’s work structure
I can’t find a perfectly compatible ERP for my business operation
I can’t find an ERP compatible with the culture and corporate values of my farm
I can’t find an EPR compatible with computers and programs (hardware and software) in my farm
Fu et al., 2007; Gerber et al., 1996
Cost Savings CS1
CS2 CS3
ERP benefits outweigh its adoption cost
ERP adoption reduces overall and environmental costs ERP adoption costs are low
Ghadim et al., 2005; Pannell et al., 2014; Sangle, 2011 Technology Readiness
TR1 TR2
There is enough knowledge in the farm to use ERP to support its operations There are required skills in the farm to implement a more effective ERP
Nordin et al., 2014
Top Manager Support TMS1
TMS2 TMS3
Farm’s management supports ERP implementation
Farm’s top management plays a strong leadership role and gets involved in the ERP process
Farm’s Top management is inclined to take risks (economic and organizational) to adopt an ERP
Chou et al., 2014
Farm Size
- from 2.471 to 4.942 acre - from 4.943 to 7.413 acre - from 7.415 to 9.884 acre - above 9.885 acre
Premkumar and Roberts, 1999
Competitive Pressure
The farm believes its own ERP influences other businesses in the same region The Farm is under external market pressure to adopt an ERP
Some farmers from the same region use ERP
Zhu et al., 2003, 2004
Regulatory Support RS1
RS2
There is no legal protection for agriculture activities
Existing laws and regulations are enough to protect agriculture activities
Zhu et al., 2006b
4. Results
Structural Equation Modeling (SEM), was applied in this study. SEM combines statistical data and qualitative causal assumption for testing and estimating causal relations. Researchers recognized the possibility of distinguishing between measuring models and structures and have started to consider the measurement error (Henseler et al., 2009). It is possible to find two different divisions of SEM techniques. They are the covariance technique and the technique based on variance. Based on the variance technique, it is possible to use the Partial Least Squares (PLS) in cases where not all items in the data are normally distributed (P<0.01, based on Kolmogorov-Smirnov test) or the research model was not tested in the concerning literature or if the research model is considered complex. In this case, we used de SMART PLS 2.0 M3 software (SmartPLS GmbH, Hamburg, Germany) (Ringle et al., 2005) to analyze relations defined by the theoretical model.
The model was evaluated in two steps; first, the variables were analyzed to determine their capability to measure each one of the constructs. Second, the structural relations were analyzed among the constructs (Table 4).
Measurement model validation was evaluated based on three criteria: construct reliability, convergent validity and discriminant validity. The reliability of each construct is a measurement of internal consistency of its indicators and presents the adequacy of measurement scale. To evaluate its reliability, we adopted a composite reliability indicator which is considered better compared to Cronbach’s Alphawhich can underestimate results (Hock and Ringle, 2010). Following the reliability indicator, values for reliability composite above 0.700 are adequate. Based on Table 5, it is possible to observe values above 0.700 for reliability composite which indicates an adequate model.
Constructs Items Reference
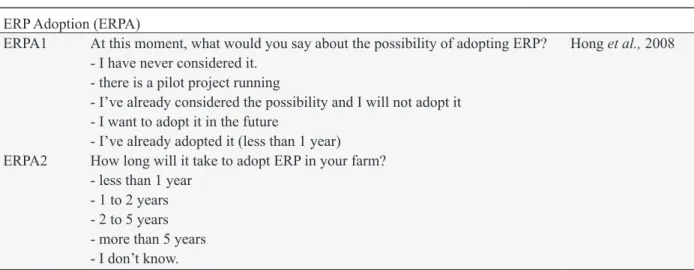
ERP Adoption (ERPA) ERPA1
ERPA2
At this moment, what would you say about the possibility of adopting ERP? - I have never considered it.
- there is a pilot project running
- I’ve already considered the possibility and I will not adopt it - I want to adopt it in the future
- I’ve already adopted it (less than 1 year) How long will it take to adopt ERP in your farm? - less than 1 year
- 1 to 2 years - 2 to 5 years - more than 5 years - I don’t know.
Hong et al., 2008
1 ERP = Enterprise Resource Planning.
Table 2. Continued.
Table 3. Sample distribution.
Culture Total (%) Base
Soy 43.5 87
Corn 41.0 82
Cotton 15.5 31
Total 100.0 200
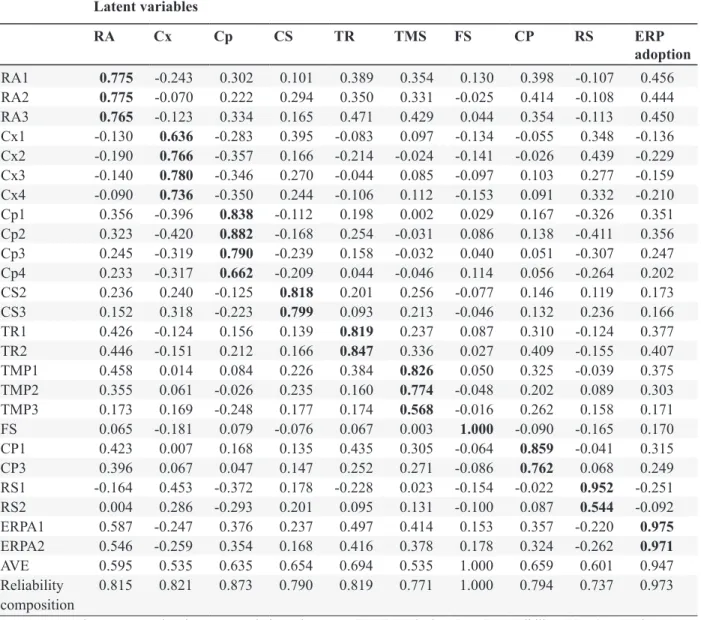
Convergent validity evaluates the extension in which the indicator is capable of measuring a latent variable (construct). It can be verified by observing patterns of factorial loading and average variance extracted (AVE). Factorial loading above 0.700 (Im et al., 1998) and variances above 0.5 (Hair et al., 1995) were accepted as high and significant. At Table 5, it is possible to find only 4 variables (Cx1, Cp4, TMP3 and RS2) which have factorial loading below 0.700. Since items with factorial loading below 0.400 should be removed from the analysis, we kept all the constructs in the study because all of them presented variances above 0.500. These results are an assurance that the indicators are legitimate representatives of the analyzed constructs.
The construct’s discriminant validity was evaluated using two criteria: Fornell-Larcker and Cross-loadings.
Fornell-Larcker advocates that the square root of AVE needs to be greater than the correlation of the construct (Fornell and Larcker, 1981). Cross-loadingsrequires loading of each indicator to be greater than the
cross-Table 4. Measurement model combining Technology Organization Environment and Diffusion of Innovation Theory.1
Latent variables
RA Cx Cp CS TR TMS FS CP RS ERP
adoption
RA1 0.775 -0.243 0.302 0.101 0.389 0.354 0.130 0.398 -0.107 0.456
RA2 0.775 -0.070 0.222 0.294 0.350 0.331 -0.025 0.414 -0.108 0.444
RA3 0.765 -0.123 0.334 0.165 0.471 0.429 0.044 0.354 -0.113 0.450
Cx1 -0.130 0.636 -0.283 0.395 -0.083 0.097 -0.134 -0.055 0.348 -0.136 Cx2 -0.190 0.766 -0.357 0.166 -0.214 -0.024 -0.141 -0.026 0.439 -0.229 Cx3 -0.140 0.780 -0.346 0.270 -0.044 0.085 -0.097 0.103 0.277 -0.159 Cx4 -0.090 0.736 -0.350 0.244 -0.106 0.112 -0.153 0.091 0.332 -0.210 Cp1 0.356 -0.396 0.838 -0.112 0.198 0.002 0.029 0.167 -0.326 0.351 Cp2 0.323 -0.420 0.882 -0.168 0.254 -0.031 0.086 0.138 -0.411 0.356 Cp3 0.245 -0.319 0.790 -0.239 0.158 -0.032 0.040 0.051 -0.307 0.247 Cp4 0.233 -0.317 0.662 -0.209 0.044 -0.046 0.114 0.056 -0.264 0.202 CS2 0.236 0.240 -0.125 0.818 0.201 0.256 -0.077 0.146 0.119 0.173 CS3 0.152 0.318 -0.223 0.799 0.093 0.213 -0.046 0.132 0.236 0.166 TR1 0.426 -0.124 0.156 0.139 0.819 0.237 0.087 0.310 -0.124 0.377 TR2 0.446 -0.151 0.212 0.166 0.847 0.336 0.027 0.409 -0.155 0.407 TMP1 0.458 0.014 0.084 0.226 0.384 0.826 0.050 0.325 -0.039 0.375 TMP2 0.355 0.061 -0.026 0.235 0.160 0.774 -0.048 0.202 0.089 0.303 TMP3 0.173 0.169 -0.248 0.177 0.174 0.568 -0.016 0.262 0.158 0.171 FS 0.065 -0.181 0.079 -0.076 0.067 0.003 1.000 -0.090 -0.165 0.170 CP1 0.423 0.007 0.168 0.135 0.435 0.305 -0.064 0.859 -0.041 0.315 CP3 0.396 0.067 0.047 0.147 0.252 0.271 -0.086 0.762 0.068 0.249 RS1 -0.164 0.453 -0.372 0.178 -0.228 0.023 -0.154 -0.022 0.952 -0.251 RS2 0.004 0.286 -0.293 0.201 0.095 0.131 -0.100 0.087 0.544 -0.092 ERPA1 0.587 -0.247 0.376 0.237 0.497 0.414 0.153 0.357 -0.220 0.975
ERPA2 0.546 -0.259 0.354 0.168 0.416 0.378 0.178 0.324 -0.262 0.971
AVE 0.595 0.535 0.635 0.654 0.694 0.535 1.000 0.659 0.601 0.947
Reliability composition
0.815 0.821 0.873 0.790 0.819 0.771 1.000 0.794 0.737 0.973
1 ERP = Enterprise Resource Planning; RA = Relative Advantage; Cx = Complexity; Cp = Compatibility; CS = Cost Savings; TR = Technologic Readiness; TMS = Top Management Support; FS = Farm Size; CP = Competitive Pressure; RS = Regulatory Support; ERPA = Enterprise Resource Planning Adoption; AVE = average variance extracted.
loadings (Chin, 1998; Götz et al., 2010; Grégoire and Fisher, 2006). As presented in Table 5, the square roots of AVE (diagonal elements) are greater than the correlation between each structure’s pairs (elements outside of diagonal). Table 5 also presents loading patterns higher than cross-loadings. In conclusion, both criteria were satisfied.
According to the results, we can conclude that the measuring model presents construct reliability, convergent validity and discriminant validity. For this reason, it is adequate to test the structural model.
To perform the analysis of the structural relations model, the statistical significance of the independent variables was evaluated to explain the ERP adoption. In addition, the R2 related was also evaluated. The results showed that the proposed model could explain 48.1% of variation in ERP adoption (Figure 2). The construct indicators are represented by rectangles and constructs are represented by circles.
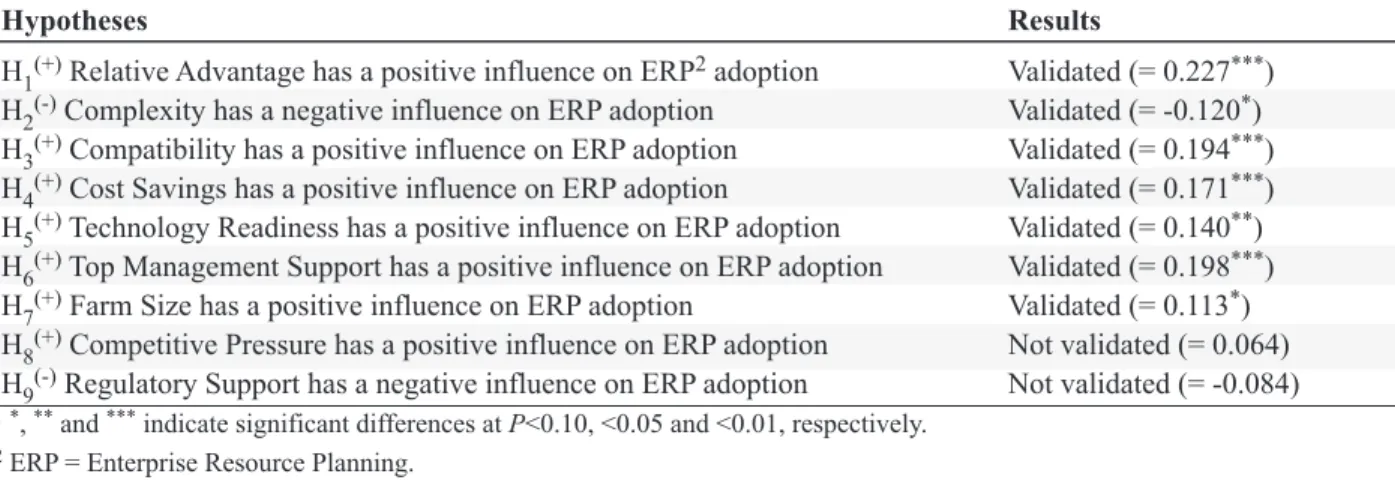
On Table 6, it is possible to confirm the hypothesis presented in this work. To reach those results, the signal and significance of the structural model coefficients were evaluated. This was the signal between the explanatory variables (independents) and ERP adoption (dependent variable). The significance levels of factorial loads were estimated using a bootstrap of 5,000 samples.
The following results have indicated statistical significance: Relative Advantage (=0.227; P<0.01), Top Management Performance (=0.198; P<0.01), Compatibility (=0.194; P<0.01), Cost Savings (=0.171; P<0.01), Technology Readiness (=0.140; P<0.05), Complexity (=-0.120; P<0.10) and Farm Size (=0.113; P<0.10). To sum up, hypotheses H1, H2, H3, H4, H5, H6 and H7 were validated. On the other hand hypotheses H8 and H9 could not be validated in this study.
5. Discussions and conclusions
Relative Advantage is the most important variable to explain ERP adoption. When the Relative Advantage increases a standard unit, ERP adoption increases 0.227 standard units subsequently. On the other hand, Regulatory Support and Competitive Pressure were not significant to ERP adoption. ERP is a process innovation and not a product innovation. However, agribusiness is about the production of agricultural commodities and competitive pressure does not apply among producers in this business. Soy, corn and cotton producers compete with producers worldwide but they do not necessarily compete with local producers. Agribusiness is an industry with perfect competition which is characterized by the lack of product differentiation and the similarities regarding the structure of cost among the farm. Future studies can explore in-depth the
Table 5. Correlation between constructs and median variance extracted from square root (diagonal).1
RA CX Cp CS TR TMS FS CP RS ERPA
RA 0.771
CX -0.190 0.732
Cp 0.371 -0.460 0.797
CS 0.241 0.344 -0.214 0.808
TR 0.523 -0.166 0.222 0.183 0.833
TMS 0.481 0.082 -0.029 0.290 0.346 0.731
FS 0.065 -0.181 0.079 -0.076 0.067 0.003 1.000
CP 0.504 0.041 0.140 0.172 0.433 0.355 -0.090 0.812
RS -0.141 0.484 -0.416 0.218 -0.168 0.061 -0.165 0.009 0.775
Adoption 0.583 -0.259 0.376 0.210 0.471 0.408 0.170 0.350 -0.247 0.973
1 RA = Relative Advantage; Cx = Complexity; Cp = Compatibility; CS = Cost Savings; TR = Technologic Readiness; TMS = Top Management Support; FS = Farm Size; CP = Competitive Pressure; RS = Regulatory Support; ERPA = Enterprise Resource Planning Adoption.
competitive pressure among farmers. Relative Advantage allows an anticipation of the harvest during the harvest period which gives farmers a negotiation advantage with the buyers. Since regulatory support for the sector is relatively recent, farmers need more time to understand in-depth and adapt to its rules. Besides this, the more the tools fit, the greater the possibility of ERP adoption. On the other hand, when it is less complex, the possibility of adoption is higher. To increase the chances of ERP system adoption, the providers will have to have a better understanding of its tools and technological processes, which is the hardware and software, used in the farms. However, without Top Management Support ERP adoption cannot succeed. The gateway to ERP adoption is in the farm owner’s hands.
We believe this study can contribute to the development of processes and tools with indicators related to this market. This paper can also help consultants who want to develop ERP systems for farms, by bringing features which are related to ERP adoption in the rural segment. Nonetheless, this paper can also motivate new Figure 2. Measurement model combining Technology Organization Environment (TOE) and Diffusion of Innovation Theory (DOI). ERP = Enterprise Resource Planning; RA = Relative Advantage; Cx = Complexity; Cp = Compatibility; CS = Cost Savings; TR = Technologic Readiness; TMS = Top Management Support; FS = Farm Size; CP = Competitive Pressure; RS = Regulatory Support; ERPA = Enterprise Resource Planning Adoption.
ERP ADOPTION
R2 = 48,1% RA CX Cp CS TR CP TMS HA RS RA1 RA2 RA3 CX1 CX2 CX3 CX4 Cp1 Cp2 Cp3 Cp4 CS2 CS3 0,775 0,775 0,765 0,636 0,766 0,780 0,736 0,836 0,881 0,790 0,662 0,818 0,799 ERPA1 ERPA2 -0,120* 0,194*** 0,171*** 0,227*** 0,975 0,971 TR1 TR2 TMS1 0,847 0,819 TMS2 TMS3 HA 0,826 0,774 0,568 1.000 CP1 CP2 RS1 0,859 0,762 RS2 0,952 0,544 DOI TOE -0,084 0,064 0,113* 0,198*** 0,140** ERP ADOPTION
R2 = 48,1% RA CX Cp CS TR CP TMS FS RS RA1 RA2 RA3 CX1 CX2 CX3 CX4 Cp1 Cp2 Cp3 Cp4 CS2 CS3 0.775 0.775 0.765 0.636 0.766 0.780 0.736 0.836 0.881 0.790 0.662 0.818 0.799 ERPA1 ERPA2 -0.120* 0.194*** 0.171*** 0.227*** 0.975 0.971 TR1 TR2 TMS1 0.847 0.819 TMS2 TMS3 HA 0.826 0.774 0.568 1,000 CP1 CP2 RS1 0.859 0.762 RS2 0.952 0.544 DOI TOE -0.084 0.064 0.113* 0.198*** 0.140**
research about the adoption of technology related to the farm organizations’ resource planning particularly for universities connected to the rural sector.
The study’s contribution is directly related to the determinants of ERP adoption for farmers. This paper did not discuss the ERP’s specificities for the rural sector. This sector presents some particularities as there are high levels of uncertainty in production due to weather or there is a high number of small or medium companies. These characteristics interfere negatively to ERP adoption compared to others sectors such as industrial sector. The following studies can contribute to the determination of the sector’s specific features. We have also considered relevant studies about diffusion states (i.e. intention, adoption and use) and explored if the determinants of intention, adoption and use are the same.
The next step is to consider the study of innovation adoption including the theory of individual behavior on farmers and the value that this adoption can deliver to the sales process, production process, procurement process and contracts. Because what we have so far is limited to research about Innovation Diffusion which explores innovation adoption from the individual decision maker’s point of view, as farmers, doctors and consumers (Fliegel and Kivlin, 1966a, 1966b). The only innovation factors measured are the ones observed by an individual adopter (Damanpour and Schneider, 2009). In addition, this paper does not discuss ERP development or the impact of Cloud Computing, the Internet of Things or analytic insight platform on the future of the ERP system. For next studies, we are considering to research the trends of ERP with the same target audience, including Platform of Analytical Insights, Internet of Things and Cloud Computing.
Share knowledge and experiences can provide a healthy competitive environment in the agricultural sector for all countries. Usually, farmers are scattered, disorganized, deficient in resources and also exposed to natural disasters, market uncertainties and pricing failures (Ahmad et al., 2016). Future researches can be based on gathering ‘the wealth of scientific knowledge and agricultural domains in a cloud-based ERP to develop an e-agriculture platform of resources planning. It can contribute to strength the agriculture activity of a region or a country. The major questions will be: (1) can we feed 8.5 billion people in 2030? (www. unric.org); (2) can we get more of our land to control losses?; (3) can we better protect the environment while sharing more sustainable decisions? The answers for these questions must come from result of new production process applied in the field and in the crops, also from the controls of the production processes and from the management sharing.
Table 6. Hypotheses analysis.1
Hypotheses Results
H1(+) Relative Advantage has a positive influence on ERP2 adoption Validated (= 0.227***) H2(-) Complexity has a negative influence on ERP adoption Validated (= -0.120*) H3(+) Compatibility has a positive influence on ERP adoption Validated (= 0.194***) H4(+) Cost Savings has a positive influence on ERP adoption Validated (= 0.171***) H5(+) Technology Readiness has a positive influence on ERP adoption Validated (= 0.140**) H6(+) Top Management Support has a positive influence on ERP adoption Validated (= 0.198***) H7(+) Farm Size has a positive influence on ERP adoption Validated (= 0.113*) H8(+) Competitive Pressure has a positive influence on ERP adoption Not validated (= 0.064) H9(-) Regulatory Support has a negative influence on ERP adoption Not validated (= -0.084) 1*, ** and *** indicate significant differences at P<0.10, <0.05 and <0.01, respectively.
2 ERP = Enterprise Resource Planning.
References
Ahmad, T., S. Ahmad, and M. Jamshed. 2016. A knowledge based Indian agriculture: with cloud ERP arrangement. In: Proceedings of the 2015 International Conference on Green Computing and Internet of Things, ICGCIoT 2015 pp. 333-340. Available at:http://tinyurl.com/ya6e7o9p.
Amoako-Gyampah, K. and A.F Salam. 2004. An extension of the technology acceptance model in an ERP implementation environment. Information and Management 41: 731-745.
Batz, F.J., K.J. Peters and W. Janssen. 1999. The influence of technology characteristics on the rate and speed of adoption. Agricultural Economics 21: 121-130.
Bloch, P.H. and M.L. Richins. 1983. A Theoretical model for the study product of importance perceptions.
The Journal of Marketing 47(3):69-81.
Boyce, C. and P. Neale. 2006. Conducting depth interviews: a guide for designing and conducting in-depth interviews. Evaluation 2: 1-16.
Chin, W.W. 1998. The partial least squares approach for structural equation modeling. Modern methods for business research. In: Modern methods for business research: methodology for business and management. Lawrence Erlbaum Associates, Mahwah, NJ, USA, pp. 295-336.
Chong, A.Y.-L., K-B. Ooi, B. Lin and M. Raman. 2009. Factors affecting the adoption level of c-commerce: an empirical study. The Journal of Computer Information Systems 50(2): 13-22.
Chou, H.W., Y.H. Lin, H.S. Lu, H.H. Chang and S.B. Chou. 2014. Knowledge sharing and ERP system usage in post-implementation stage. Computers in Human Behavior 33: 16-22.
Damanpour, F. and M. Schneider. 2009. Characteristics of Innovation and innovation adoption in public organizations: assessing the role of managers. Journal of Public Administration Research and Theory
19: 495-522.
De Toni, D. and M. Schuler. 2007. Gestão da imagem: desenvolvendo um instrumento para a configuração da imagem de produto. Revista de Administração Contemporânea 11(4): 1-16.
Ehie, I.C. and M. Madsen. 2005. Identifying critical issues in enterprise resource planning (ERP) implementation. Computers in Industry 56: 545-557.
Esteves, J.M. 2014. An empirical identification and categorisation of training best practices for ERP implementation projects. Enterprise Information Systems 8: 665-683.
Fliegel, F.C. and J.E. Kivlin. 1966a. ATtributes of innovations as factors in diffusion. American Journal of Sociology 72: 235-248.
Fliegel, F.C., J.E. Kivlin. 1966b. Farmers perceptions of farm practice attributes. Rural Sociology 31: 197-206. Fornell, C. and D.F. Larcker. 1981. Evaluating structural equation models with unobservable variables and
measurement error. Journal of Marketing Research 18(1): 39-50.
Fountas, S., G. Carli, C.G. Sørensen, Z. Tsiropoulos, C. Cavalaris, Vatsanidou, B. Liakos, M. Canavari, J. Wiebensohn and B. Tisserye. 2015. Farm management information systems: current situation and future perspectives. Computers and Electronics in Agriculture 115: 40-50.
Fu, Z., J. Yue, D. Li, X. Zhang, L. Zhang and Y. Gao. 2007. Evaluation of learner adoption intention of e-learning in China: a methodology based on perceived innovative attributes. New Zealand Journal of Agricultural Research 50: 609-615.
Gajic, G., S. Stankovski, G. Ostojic, Z. Tesic and L. Miladinovic. 2014. Method of evaluating the impact of ERP implementation critical success factors a case study in oil and gas industries. Enterprise Information Systems 8: 84-106.
Gatignon, H. and T.S. Robertson. 1989. Technology diffusion – an empirical-test of competitive effects.
Journal of Marketing 53: 35-49.
Gerber, A., V. Hoffmann and M. Kugler. 1996. The diffusion of eco-farming in Germany and the concomitant development of the knowledge system supporting it. Berichte Uber Landwirtschaft 74: 591-627. Ghadim, A.K.A., D.J. Pannell and M.P. Burton. 2005. Risk, uncertainty, and learning in adoption of a crop
innovation. Agricultural Economics 33: 1-9.
Götz, O., K. Liehr-Gobbers and M. Krafft. 2010. Evaluation of structural equation models using the partial least squares (PLS) approach. In: Handbook of Partial Least Squares, Springer, Heidelberg, Germany, pp. 691-711.
Grégoire, Y. and R.J. Fisher. 2006. The effects of relationship quality on customer retaliation. Marketing Letters 17(1): 31-46.
Gul, M., G. Akpinar, V. Demircan, H. Yilmaz, T. Bal, S.E. Arici and S.G. Yilmaz. 2014. Economic analysis of early-warning system in apple cultivation: a Turkish case study. Custos E Agronegocio on Line
10: 165-179.
Hair, J.F., R.E. Anderson, R.L. Tatham and W.C. Black. 1995. Multivariate data analysis, 4th edition. Prentice-Hall, Upper Saddle River, NJ, USA.
Hakim, A. and H. Hakim. 2010. A practical model on controlling the ERP implementation risks. Information Systems 35: 204-214.
Helitzer, D.L., G. Hathorn, J. Benally and C. Ortega. 2014. Culturally relevant model program to prevent and reduce agricultural injuries. Journal of Agricultural Safety and Health 20: 175-198.
Henseler, J., C.M. Ringleand and R.R. Sinkovics. 2009. The use of partial least squares path modelling in international marketing. New challenges to international marketing. In: New challenges to international marketing (advances in international marketing, volume 20), edited by R.R. Sinkovics and P.N. Ghauri. Emerald Group Publishing Limited, Bingley, UK, pp. 277-319.
Hock, M. and C.M. Ringle. 2010. Local strategic networks in the software industry: an empirical analysis of the value continuum. International Journal of Knowledge Management Studies 4(2): 132. Hong, H.Y, J.H. Moon, C.W. Yoo and Y. Choe. 2008. An analysis of social-psychological factors that influence
the intention to use the agricultural information system ‘LFcenter System’. Journal of Agricultural Extension and Community Development 15: 659-681.
Hsu, P.-F., K.L. Kraemer and D. Dunkle. 2006. Determinants of e-business use in US firms. International Journal of Electronic Commerce 10: 9-45.
Hung, W.H., C.F. Ho, J.J. Jou and K.H. Kung. 2012. Relationship bonding for a better knowledge transfer climate: an ERP implementation research. Decision Support Systems 52: 406-414.
Im, S.K., V. Grover and S. Sharma. 1998. The use of structural equation modelling in research. University of South Carolina, Columbia, SC, USA.
Janssen, S. and M.K. van Ittersum. 2007. Assessing farm innovations and responses to policies: a review of bio-economic farm models. Agricultural Systems 94: 622-636.
Karimi, J., T.M. Somers and A. Bhattacherjee. 2007. The impact of ERP implementation on business process outcomes: a factor-based study. Journal of Management Information Systems 24: 101-134.
Ke, W. and K.K. Wei. 2008. Organizational culture and leadership in ERP implementation. Decision Support Systems 45: 208-218.
Kumar, K. and J. Van Hillegersberg. 2000. ERP – Experiences and evolution. Communications of the Acm
43: 22-26.
Lambin, J.J. 2000. Marketing estratégico. 4a. ed. Portugal. McGraw-Hill, Tradução Domingos Silva, Portugal. Madapusi, A. and D. D’Souza. 2012. The influence of ERP system implementation on the operational
performance of an organization. International Journal of Information Management 32: 24-34. Martins, C., T. Oliveira and A. Popovic. 2014. Understanding the Internet banking adoption: a unified
theory of acceptance and use of technology and perceived risk application. International Journal of Information Management 34: 1-13.
Martins, R., T. Oliveira and M.A. Thomas. 2016. An empirical analysis to assess the determinants of SaaS diffusion in firms. Computers in Human Behavior 62: 19-33.
Montedo, U.B. 2012. The process of constructing new competencies in the family agricultural production unit. Work-a Journal of Prevention Assessment and Rehabilitation 41: 76-80.
Nordin, S.M., S.M. Noor, M.S. Saad and M. Bin. 2014. Innovation Diffusion of new technologies in the malaysian paddy fertilizer industry. 2nd World Conference on Business, Economics and Management
109: 768-778.
Oliveira, T., M. Thomas and M. Espadanal. 2014. Assessing the determinants of cloud computing adoption: an analysis of the manufacturing and services sectors. Information and Management 51: 497-510. Orlovski, R., L.A. Kisielewicz and S.R.A. Ribeiro 2012. Segurança de informação em sistemas agrícolas:
estudo de caso fundação abc. Revista de Engenharia e Tecnologia 4(3).
Orsi, L., I. De Noni, S. Corsi and L.V. Marchisio. 2017. The role of collective action in leveraging farmers’ performances: lessons from sesame seed farmers’ collaboration in eastern Chad. Journal of Rural Studies 51: 93-104.
Pannell, D.J., R.S. Llewellyn and M. Corbeels. 2014. The farm-level economics of conservation agriculture for resource-poor farmers. Agriculture Ecosystems and Environment 187: 52-64.
Park, S.-H., J. Eo and J.I. Lee. 2012. Assessing and managing an organization’s green IT maturity. Mis Quarterly Executive 11: 127-140.
Peshin, R. 2013. Farmers’ adoptability of integrated pest management of cotton revealed by a new methodology.
Agronomy for Sustainable Development 33: 563-572.
Premkumar, G. and M. Roberts. 1999. Adoption of new information technologies in rural small businesses.
Omega-International Journal of Management Science 27: 467-484.
Ram, J., D. Corkindale and M.L. Wu. 2013. Implementation critical success factors (CSFs) for ERP: do they contribute to implementation success and post-implementation performance? International Journal of Production Economics 144: 157-174.
Ringle, C.M., S. Wende and A. Will. 2005. SmartPLS 2.0 M3. Available at: http://www.smartpls.de. Rogers, E.M. 1993. The diffusion of innovations model. Diffusion and Use of Geographic Information
Technologies 70: 9-24.
Rogers, E.M. 1995. Lessons for guidelines from the diffusion of innovations. Joint Commission Journal on Quality Improvement 21: 324-328.
Rouyendegh, B.D., U. Bac and T.E. Erkan. 2014. Sector selection for erp implementation to achieve most impact on supply chain performance by using ahp-topsis hybrid methoD. Tehnicki Vjesnik-Technical Gazette 21: 933-937.
Ruivo, P., T. Oliveira and M. Neto. 2012. ERP post-adoption: value impact on firm performance. In: 7th Iberian Conference on Information Systems and Technologies (CISTI),edited by I. Tecnologias and L.P. Isegi Unl. ISEGI UNL, Lisbon, Portugal.
Ruivo, P., T. Oliveira and M. Neto. 2014. Examine ERP post-implementation stages of use and value: empirical evidence from Portuguese SMEs. International Journal of Accounting Information Systems
15:166-184.
Sangle, S. 2011. Adoption of cleaner technology for climate proactivity: a technology-firm-stakeholder framework. Business Strategy and the Environment 20: 365-378.
Sarker, R. and S. Ratnasena. 2014. Revealed comparative advantage and half-a-century competitiveness of Canadian agriculture: a case study of wheat, beef, and pork sectors. Canadian Journal of Agricultural Economics-Revue Canadienne D Agroeconomie 62: 519-544.
Sørensen, C.G., S. Fountas, E. Nash, L. Pesonen, D. Bochtis, S.M. Pedersen, B. Basso and S.B. Blackmore. 2010. Conceptual model of a future farm management information system. Computers and Electronics in Agriculture 72(1): 37-47.
Sørensen, C.G., L. Pesonen, D.D. Bochtis, S.G. Vougioukas and P. Suomi. 2011. Functional requirements for a future farm management information system. Computers and Electronics in Agriculture
76(2): 266-276.
Tornatzky, L.G. and M. Fleischer. 1991. The processes of technological innovation. The Journal of Technology Transfer 16: 45-46.
Tornatzky, L.G. and J.K. Klein. 1982. Innovation characteristics and innovation adoption-implementation – a meta-analysis of findings. Ieee Transactions on Engineering Management 29: 28-45.
Tsai, M.T., E.Y. Li, K.W. Lee and W.H. Tung. 2011. Beyond ERP implementation: the moderating effect of knowledge management on business performance. Total Quality Management and Business Excellence 22: 131-144.
Valente, T.W. and E.M Rogers. 1995. The origins and development of the diffusion of innovations paradigm as an example of scientific growth. Science Communication 16: 242-273.
Velcu, O. 2010. Strategic alignment of ERP implementation stages: an empirical investigation. Information and Management 47: 158-166.
Verdouw, C.N. R.M. Robbemond and J. Wolfert. 2015. ERP in agriculture: lessons learned from the Dutch horticulture. Computers and Electronics in Agriculture 114: 125-133.
Wolfert, J., C.N. Verdouw, C.M. Verloop and A.J.M. Beulens. M. 2010. Organizing information integration in agri-food – A method based on a service-oriented architecture and living lab approach. Computers and Electronics in Agriculture 70(2): 389-405.
Wood, B.A., H.T. Blair, D.I. Gray, P.D. Kemp, P.R. Kenyon, S.T. Morris and A.M. Sewell. 2014. Agricultural science in the wild: a social network analysis of farmer knowledge exchange. Plos One 9.
Xouridas, S. 2015. Agricultural financial risks resulting from extreme events. Journal of Agricultural Economics 66(1): 192-220.
Yusuf, Y., A. Gunasekaran and M. Abthorpe. 2004. Enterprise information systems project implementation: a case study of ERP in Rolls-Royce. International Journal of Production 87: 251-166.
Zach, O., B.E. Munkvold and D.H. Olsen. 2014. ERP system implementation in SMEs: exploring the influences of the SME context. Enterprise Information Systems 8: 309-335.
Zeng, Y.J. and M.J. Skibniewski. 2013. Risk assessment for enterprise resource planning (ERP) system implementations: a fault tree analysis approach. Enterprise Information Systems 7: 332-353. Zhang, Z., M.K.O. Lee, P. Huang, L. Zhang and X.Y. Huang. 2005. A framework of ERP systems implementation
success in China: an empirical study. International Journal of Production Economics 98: 56-80. Zhu, K., S. Dong, S.X. Xu and K.L. Kraemer. 2006b. Innovation diffusion in global contexts: determinants
of post-adoption digital transformation of European companies. European Journal of Information Systems 15: 601-616.
Zhu, K., K.L. Kraemer and S. Xu. 2006a. The process of innovation assimilation by firms in different countries: a technology diffusion perspective on e-business. Management Science 52: 1557-1576. Zhu, K., K. Kraemer and S. Xu. 2003. Electronic business adoption by European firms: a cross-country
assessment of the facilitators and inhibitors. European Journal of Information Systems 12: 251-268. Zhu, K., K.L. Kraemer, S. Xu and J. Dedrick. 2004. Information technology payoff in e-business environments:
an international perspective on value creation of e-business in the financial services industry. Journal of Management Information Systems 21: 17-54.
International Food and
Agribusiness Management Review
746
Haberli
et al.
V