www.cbpv.org.br/rbpv ISSN 0103-846X (Print) / ISSN 1984-2961 (Electronic)
Doi: http://dx.doi.org/10.1590/S1984-29612016013
Evaluation of clinical signs, parasitemia, hematologic and
biochemical changes in cattle experimentally infected with
Trypanosoma vivax
Avaliação dos sinais clínicos, parasitemia e alterações hematológicas e bioquímicas de bovinos
experimentalmente infectados pelo
Trypanosoma vivax
Otavio Luiz Fidelis Junior1*; Paulo Henrique Sampaio1; Rosangela Zacarias Machado1;
Marcos Rogério André1; Luiz Carlos Marques1; Fabiano Antonio Cadioli2
1 Departamento de Patologia Veterinária, Faculdade de Ciências Agrárias e Veterinária – FCAV, Universidade Estadual Paulista –
UNESP, Jaboticabal, SP, Brasil
2 Departamento de Clínica, Cirurgia e Reprodução Animal, Faculdade de Medicina Veterinária – FMVA, Universidade Estadual
Paulista – UNESP, Araçatuba, SP, Brasil
Received November 18, 2015 Accepted February 3, 2016
Abstract
Infections by Trypanosoma vivax cause great losses to livestock in Africa and Central and South Americas. Outbreaks due this parasite have been occurred with increasing frequency in Brazil. Knowledge of changes caused by T. vivax during the course of this disease can be of great diagnostic value. Thus, clinical signs, parasitemia, hematologic and biochemical changes of cattle experimentally infected by this hemoparasite were evaluated. Two distinct phases were verified during the infection – an acute phase where circulating parasites were seen and then a chronic phase where fluctuations in parasitemia were detected including aparasitemic periods. A constant reduction in erythrocytes, hemoglobin and packed cell volume (PVC) were observed. White blood cells (WBC) showed pronounced changes such as severe neutropenia and lymphopenia during the acute phase of the illness. Decreases in cholesterol, albumin, aspartate aminotransferase (AST), lactate dehydrogenase (LDH), and increases in glucose, globulin, protein, and alkaline phosphatase (ALP) were observed. The “Lins” isolate of T. vivax showed pathogenicity for cattle, and intense parasitemia was detected in the early stages of infection. Circulating parasites were detected for about two months. The most evident laboratory abnormalities were found in WBC parameters, including thrombocytopenia.
Keywords: Trypanosomiasis, bovine, host-parasite relationship, complete blood count.
Resumo
Infecções pelo Trypanosoma vivax causam grandes prejuízos à pecuária na África e Américas Central e do Sul. Surtos devido a este protozoário têm ocorrido com frequência cada vez maior no Brasil. O conhecimento das alterações provocadas pelo T. vivax durante a evolução desta enfermidade podem ser de grande valia para o auxílio no diagnóstico. Para tanto foram estudados os sinais clínicos, parasitemia, alterações hematológicas e bioquímicas em bovinos experimentalmente infectados por este hemoparasito. Foram verificadas duas fases distintas durante a infecção, uma aguda onde parasitos circulantes foram vistos durante todo o período, e posteriormente uma crônica, onde foram detectadas flutuações na parasitemia, com períodos aparasitêmicos. Foi verificada constante diminuição da contagem global de eritrócitos, teor de hemoglobina e volume globular (VG). O leucograma revelou leucopenia por neutropenia e linfopenia durante a fase aguda da enfermidade. Foram observados diminuição do colesterol, albumina, aspartato aminotransferase (AST), lactato desidrogenase (LDH) e aumento da glicose, globulinas, proteínas e fosfatase alcalina (FA). O isolado “Lins” de
T. vivax apresentou patogenicidade para bovinos, verificando-se parasitemia intensa nos estágios iniciais da infecção, sendo detectados parasitas circulantes por aproximadamente dois meses. As alterações laboratoriais mais evidentes foram encontradas nos parâmetros do leucograma, ainda destacando-se um quadro de trombocitopenia.
Palavras-chave: Tripanossomíase, bovino, relação parasita-hospedeiro, hemograma.
Introduction
Trypanosomiasis are cosmopolitan diseases that affect humans and animals. Trypanosoma brucei, T. congolense, T. vivax and T. evansi
cause significant losses in livestock, and T. vivax is responsible for large economic losses of cattle in Africa, Asia and Central and South Americas (HOARE, 1972). In South America, the most important species of trypanosomes are T. cruzi, etiologic agent of Chagas disease in humans and dogs, T. evansi, causing neurological disorders in horses and other mammals and T. vivax that causes deaths and infertility in ruminants (DÁVILA & SILVA, 2000).
In Brazil, infections by pathogenic trypanosomes in livestock have been occurring with increasing frequency. Currently, outbreaks of T. vivax were detected in the states of Maranhão (FEITOSA et al., 2004), Tocantins (LINHARES et al., 2006), Paraíba (BATISTA et al., 2007), Minas Gerais (CARVALHO et al., 2008; CUGLOVICI et al., 2010), Rio Grande do Sul (SILVA et al., 2009), São Paulo (CADIOLI et al., 2012) and Pernambuco (PIMENTEL et al., 2012).
In cattle, T. vivax unleashes unspecific signs such as fever, anorexia, weight loss, reduced milk yield, enlarged lymph nodes, abortion and diarrhea (BATISTA et al., 2008; CADIOLI et al., 2012) as well as anemia (SCHENK et al., 2001), leukopenia (SILVA et al., 1999) and eventual leukocytosis (CADIOLI et al., 2012). The biochemical profile of animals infected by T. vivax are usually normal (SCHENK et al., 2001; ALMEIDA et al., 2010). The association of nonspecific changes with the fluctuation of parasitemia observed during the infection hinders the diagnosis and contributes to its spread. Thus, the present study aimed to elucidate some aspects of host-parasite relationship by evaluating clinical signs, parasitemia and hematological and biochemical alterations of cattle experimentally infected with T. vivax over the course of the infection.
Materials and Methods
Experimental group and experimental infection
Three Girolanda cows age four to six years and with an average weight of 500 kg were used. The animals were kept in screened and individual stalls and were submitted to daily physical examination; laboratory tests were performed for twenty days prior to experimental infection to verify their health to trypanosomiasis through direct parasitological tests (BRENER, 1961; WOO, 1970), serological tests (IFAT and ELISA) as described by Aquino et al. (1999) and molecular test (PCR) as described by Cortez et al. (2009). Cows were treated with ivermectin 1% (Ivomec – 0.2 mg/kg SC),
fluazuron 2.5% (Acatak Pour On – 2.5 mg/kg) and imidocarb
dipropionate 12% (Imizol – 3 mg/kg SC) to prevent coinfection
by ecto and endoparasites. Infected blood with T. vivax, “Lins” isolate (CADIOLI et al., 2012; GARCIA et al., 2014), was obtained from a previously infected goat and, one aliquot of blood containing 2.0 × 10⁷ trypomastigotes, was inoculated intravenously
into each bovine (E1 to E3).
Clinical and laboratory tests
Fifteen milliliters of blood from each bovine were collected, of which 3 mL were placed in 10% EDTA solution for performing a complete blood count (CBC) and verifying parasitemia, 2 mL in EDTA-fluoride solution was used for glucose dosage and 10 mL without anticoagulant was used for biochemical tests. Blood was obtained by venipuncture of the jugular vein daily for 14 days after infection (DAI) and thereafter every three days until completion of the experimental period of 120 DAI using the Vacutainer system (BD Industry - Juiz de Fora - MG). The serum samples were identified and divided into quintuplicates frozen at –20 °C until use. The animals were clinically examined when venipuncture and were weighed once a week.
Parasitological exam
On days of collection, whole blood aliquots in 10% EDTA solution were used to verify the presence of parasites by microhematocrit concentration test (MCHT) (WOO, 1970) and parasitemia count as described by Brener (1961).
Blood tests
Total erythrocytes and leukocytes, hemoglobin, mean corpuscular volume (MCV), mean corpuscular hemoglobin (MCH), mean corpuscular hemoglobin concentration (MCHC) and platelet counts were determined in a specific automatic device (PocH-100iV Diff Sysmex – São José dos Pinhais – PR). Packed
cell volume (PCV) was obtained by microhematocrit method, through capillary centrifugation at 10,000 RPM for five minutes and then held in proper reading ruler. Leukocyte differential counting was performed on blood smears stained with Giemsa in which 100 leukocytes were counted by light microscopy followed by calculation of absolute values.
Biochemical tests
All biochemical tests were analyzed in serum except glucose that was determined in plasma obtained from EDTA-fluoride tubes. Serum samples remained frozen at –20 °C and protected from light for approximately 30 days. The dosage of glucose was performed immediately after blood collection.
Measurements of glucose, total protein, albumin, cholesterol, triglycerides, total bilirubin, direct bilirubin and creatinine were performed with a colorimetric method using commercial kits (Diagnostic Labtest, Belo Horizonte - MG) and read in a
spectrophotometer (Diagnostic LabQuest, Belo Horizonte - MG).
Globulin was calculated by the difference between total protein and albumin and indirect bilirubin was calculated by the difference between total bilirubin and direct bilirubin.
Urea and serum enzyme activity of gamma glutamyltransferase (GGT), aspartate aminotransferase (AST), lactate dehydrogenase (LDH), alkaline phosphatase (ALP) and creatine kinase (CK) were measured by the kinetic method using commercial kits (Diagnostic Labtest, Belo Horizonte - MG) and read in a spectrophotometer
PCR reaction
The DNA extraction was performed with the QIAamp DNAeasy Kit (Qiagen), according to the manufacturer’s recommendations.
The extracted DNA was stored at –20 °C until the moment of the use.
PCR was performed using a set of primers from the DNA sequence of the gene encoding for the cathepsin L-like enzyme (CatL) of T. vivax that had been described previously (CORTEZ et al., 2009). PCR was performed on a volume of 50 µL, containing 20-100 ng of genomic DNA (except the negative control) and a final concentration of 100 pmol of each primer, 200 mM of each dNTP, 10 mM of Tris-HCl (pH 8.3), 1.5 mM of MgCl2, 7.5% (v/v) dimethyl sulfoxide (DMSO), 0.1 mg/ml of bovine serum albumin (BSA) and 2.5 units of Taq DNA polymerase (Invitrogen, USA). The reactions were conducted in a thermocycler (T100TM Thermal Cycler; Bio Rad, USA) under the following conditions: initial denaturation at 94 °C for 3 minutes followed by 35 cycles of denaturation at 94 °C for 1 minute, annealing at 65 °C for 1 minute and extension at 72 °C for 1 minute, with final extension at 72 °C for 10 minutes. The PCR products were separated on 2% agarose gel containing ethidium bromide and the images were revealed in the ChemiDocTM MP imaging system device (Bio Rad, USA).
Statistical analysis
In order to perform the statistical analysis, the values obtained in the pre-infection moment (0 DAI) were used as control. The data were evaluated by analysis of variance (ANOVA) with paired comparisons made on day zero (pre-infection) using Dunnett’s test at the 5% probability via GraphPadPrism 4.0 software.
Results
The inoculum (2.0 × 10⁷ trypomastigotes/animal) was able to
infected cattle, with parasites being detected both by parasitological (Brener and MHCT) and molecular methods (PCR). Blood samples were collected appropriately with no fibrin formation, which could compromise hematological values.
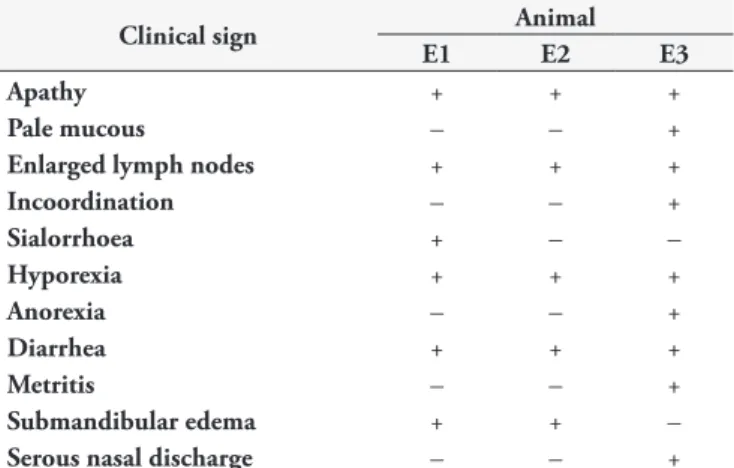
Clinical signs are compiled in Table 1. Apathy, pale mucous, enlarged lymph nodes (submandibular, pre-scapular and pre-crural), diarrhea, submandibular edema, serous nasal discharge, sialorrhoea, hyporexia, anorexia and incoordination were observed. In addition, animal E3 presented metritis at 90 DAI. Although the animal’s appetite remained normal throughout most of the trial period, weight reduction was observed in the initial period (Figure 1).
Parasites were detected both by the Brener (1961) and Woo (1970) techniques at 2 DAI for animal E1 and E2 and 3 DAI for E3. The trypomastigotes count was performed by the Brener technique (BRENER, 1961) with the parasitemia peak occurring at 12 DAI for animal E1 and E3 with 2.49 × 10⁶ and
3.66 × 10⁶ parasites/mL blood, respectively, and at 13 DAI for
animal E2 with 3.11 x 10⁶ parasites/mL of blood. Fluctuations
in parasitamia were observed during the trial period, highlighting an acute phase of the disease. However, circulating parasites were
seen throughout the entire period followed by a chronic phase where fluctuations in parasitemia were detected followed by a aparasitemics periods that occurred from 30 DAI (Figure 2).
RBC analysis only showed statistically significant differences (p <0.05) versus baseline at a few time points. Erythrocytes,
Table 1. Clinical signs observed in cattle experimentally infected with T. vivax.
Clinical sign Animal
E1 E2 E3
Apathy + + +
Pale mucous – – +
Enlarged lymph nodes + + +
Incoordination – – +
Sialorrhoea + – –
Hyporexia + + +
Anorexia – – +
Diarrhea + + +
Metritis – – +
Submandibular edema + + –
Serous nasal discharge – – +
+ present. – absent.
Figure 1. Average weight variation relative to pre-infection moment (0 DAI) of cattle experimentally infected with T. vivax.
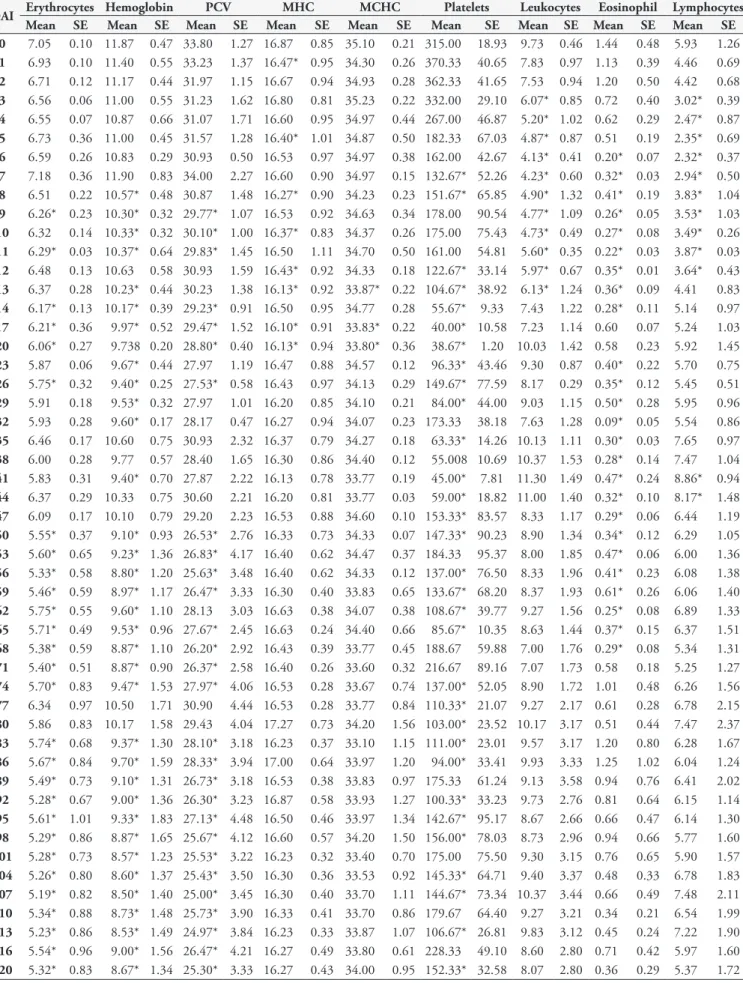
hemoglobin and PCV had a similar behavior and showed a decrease in the values throughout the experimental period. The erythrocyte count showed a significant statistical difference on 9, 11, 14 to 20, 26, 50 to 74 and 83 to 120 DAI; hemoglobin presented significant statistical difference on 8 to 11, 13 to 32, 41, 50 to 74 and 83 to 120 DAI; PCV showed significant statistical difference on 9 to 11, 14 to 20, 26, 50 to 59, 65 to 74 and 83 to 120 DAI. MCV showed no statistical difference. MHC showed a significant statistical difference on 1, 5, 8, 10, 12, 13,
17 and 20. The MCHC showed statistical differences only on 13, 17 and 20 DAI (Table 2, Figure 3).
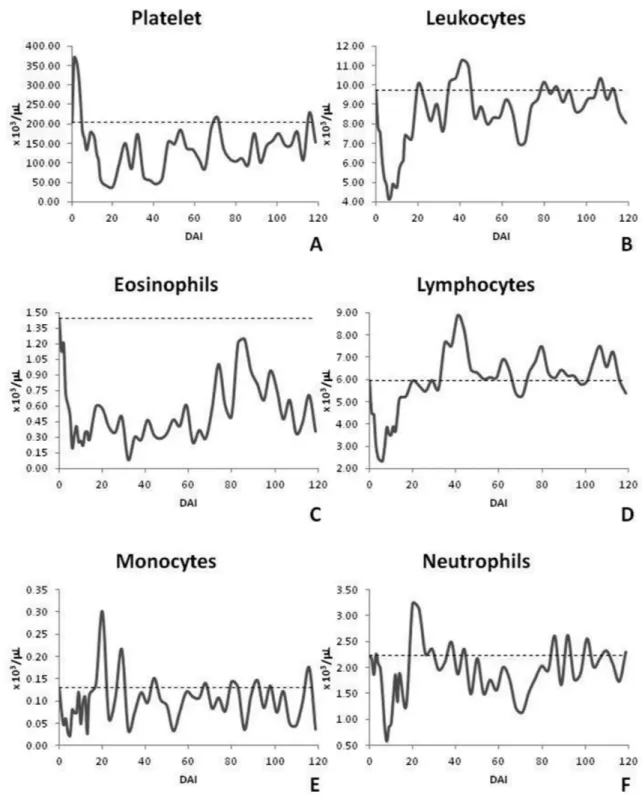
The platelet count was reduced in the acute phase of infection with values below the lower limit for bovine. Then there was an increase remaining floating near the lower limit with a significant statistical difference on 7, 8, 12 to 29, 35 to 50, 56 to 65, 74 to 86, 92 to 98, 104, 107, 113 and 120 DAI. Cattle presented thrombocytopenia on 14 to 23, 29, 35 to 44, 65 and 86 DAI, presenting a minimum value of 38,670 platelets. The WBC initially
Table 2. Mean values and standard error of hematological data of cattle experimentally infected with T. vivax.
DAI Erythrocytes Hemoglobin PCV MHC MCHC Platelets Leukocytes Eosinophil Lymphocytes
Mean SE Mean SE Mean SE Mean SE Mean SE Mean SE Mean SE Mean SE Mean SE
0 7.05 0.10 11.87 0.47 33.80 1.27 16.87 0.85 35.10 0.21 315.00 18.93 9.73 0.46 1.44 0.48 5.93 1.26
1 6.93 0.10 11.40 0.55 33.23 1.37 16.47* 0.95 34.30 0.26 370.33 40.65 7.83 0.97 1.13 0.39 4.46 0.69
2 6.71 0.12 11.17 0.44 31.97 1.15 16.67 0.94 34.93 0.28 362.33 41.65 7.53 0.94 1.20 0.50 4.42 0.68
3 6.56 0.06 11.00 0.55 31.23 1.62 16.80 0.81 35.23 0.22 332.00 29.10 6.07* 0.85 0.72 0.40 3.02* 0.39
4 6.55 0.07 10.87 0.66 31.07 1.71 16.60 0.95 34.97 0.44 267.00 46.87 5.20* 1.02 0.62 0.29 2.47* 0.87
5 6.73 0.36 11.00 0.45 31.57 1.28 16.40* 1.01 34.87 0.50 182.33 67.03 4.87* 0.87 0.51 0.19 2.35* 0.69
6 6.59 0.26 10.83 0.29 30.93 0.50 16.53 0.97 34.97 0.38 162.00 42.67 4.13* 0.41 0.20* 0.07 2.32* 0.37
7 7.18 0.36 11.90 0.83 34.00 2.27 16.60 0.90 34.97 0.15 132.67* 52.26 4.23* 0.60 0.32* 0.03 2.94* 0.50
8 6.51 0.22 10.57* 0.48 30.87 1.48 16.27* 0.90 34.23 0.23 151.67* 65.85 4.90* 1.32 0.41* 0.19 3.83* 1.04
9 6.26* 0.23 10.30* 0.32 29.77* 1.07 16.53 0.92 34.63 0.34 178.00 90.54 4.77* 1.09 0.26* 0.05 3.53* 1.03
10 6.32 0.14 10.33* 0.32 30.10* 1.00 16.37* 0.83 34.37 0.26 175.00 75.43 4.73* 0.49 0.27* 0.08 3.49* 0.26
11 6.29* 0.03 10.37* 0.64 29.83* 1.45 16.50 1.11 34.70 0.50 161.00 54.81 5.60* 0.35 0.22* 0.03 3.87* 0.03
12 6.48 0.13 10.63 0.58 30.93 1.59 16.43* 0.92 34.33 0.18 122.67* 33.14 5.97* 0.67 0.35* 0.01 3.64* 0.43
13 6.37 0.28 10.23* 0.44 30.23 1.38 16.13* 0.92 33.87* 0.22 104.67* 38.92 6.13* 1.24 0.36* 0.09 4.41 0.83
14 6.17* 0.13 10.17* 0.39 29.23* 0.91 16.50 0.95 34.77 0.28 55.67* 9.33 7.43 1.22 0.28* 0.11 5.14 0.97
17 6.21* 0.36 9.97* 0.52 29.47* 1.52 16.10* 0.91 33.83* 0.22 40.00* 10.58 7.23 1.14 0.60 0.07 5.24 1.03
20 6.06* 0.27 9.738 0.20 28.80* 0.40 16.13* 0.94 33.80* 0.36 38.67* 1.20 10.03 1.42 0.58 0.23 5.92 1.45
23 5.87 0.06 9.67* 0.44 27.97 1.19 16.47 0.88 34.57 0.12 96.33* 43.46 9.30 0.87 0.40* 0.22 5.70 0.75
26 5.75* 0.32 9.40* 0.25 27.53* 0.58 16.43 0.97 34.13 0.29 149.67* 77.59 8.17 0.29 0.35* 0.12 5.45 0.51
29 5.91 0.18 9.53* 0.32 27.97 1.01 16.20 0.85 34.10 0.21 84.00* 44.00 9.03 1.15 0.50* 0.28 5.95 0.96
32 5.93 0.28 9.60* 0.17 28.17 0.47 16.27 0.94 34.07 0.23 173.33 38.18 7.63 1.28 0.09* 0.05 5.54 0.86
35 6.46 0.17 10.60 0.75 30.93 2.32 16.37 0.79 34.27 0.18 63.33* 14.26 10.13 1.11 0.30* 0.03 7.65 0.97
38 6.00 0.28 9.77 0.57 28.40 1.65 16.30 0.86 34.40 0.12 55.008 10.69 10.37 1.53 0.28* 0.14 7.47 1.04
41 5.83 0.31 9.40* 0.70 27.87 2.22 16.13 0.78 33.77 0.19 45.00* 7.81 11.30 1.49 0.47* 0.24 8.86* 0.94
44 6.37 0.29 10.33 0.75 30.60 2.21 16.20 0.81 33.77 0.03 59.00* 18.82 11.00 1.40 0.32* 0.10 8.17* 1.48
47 6.09 0.17 10.10 0.79 29.20 2.23 16.53 0.88 34.60 0.10 153.33* 83.57 8.33 1.17 0.29* 0.06 6.44 1.19
50 5.55* 0.37 9.10* 0.93 26.53* 2.76 16.33 0.73 34.33 0.07 147.33* 90.23 8.90 1.34 0.34* 0.12 6.29 1.05
53 5.60* 0.65 9.23* 1.36 26.83* 4.17 16.40 0.62 34.47 0.37 184.33 95.37 8.00 1.85 0.47* 0.06 6.00 1.36
56 5.33* 0.58 8.80* 1.20 25.63* 3.48 16.40 0.62 34.33 0.12 137.00* 76.50 8.33 1.96 0.41* 0.23 6.08 1.38
59 5.46* 0.59 8.97* 1.17 26.47* 3.33 16.30 0.40 33.83 0.65 133.67* 68.20 8.37 1.93 0.61* 0.26 6.06 1.40
62 5.75* 0.55 9.60* 1.10 28.13 3.03 16.63 0.38 34.07 0.38 108.67* 39.77 9.27 1.56 0.25* 0.08 6.89 1.33
65 5.71* 0.49 9.53* 0.96 27.67* 2.45 16.63 0.24 34.40 0.66 85.67* 10.35 8.63 1.44 0.37* 0.15 6.37 1.51
68 5.38* 0.59 8.87* 1.10 26.20* 2.92 16.43 0.39 33.77 0.45 188.67 59.88 7.00 1.76 0.29* 0.08 5.34 1.31
71 5.40* 0.51 8.87* 0.90 26.37* 2.58 16.40 0.26 33.60 0.32 216.67 89.16 7.07 1.73 0.58 0.18 5.25 1.27
74 5.70* 0.83 9.47* 1.53 27.97* 4.06 16.53 0.28 33.67 0.74 137.00* 52.05 8.90 1.72 1.01 0.48 6.26 1.56
77 6.34 0.97 10.50 1.71 30.90 4.44 16.53 0.28 33.77 0.84 110.33* 21.07 9.27 2.17 0.61 0.28 6.78 2.15
80 5.86 0.83 10.17 1.58 29.43 4.04 17.27 0.73 34.20 1.56 103.00* 23.52 10.17 3.17 0.51 0.44 7.47 2.37
83 5.74* 0.68 9.37* 1.30 28.10* 3.18 16.23 0.37 33.10 1.15 111.00* 23.01 9.57 3.17 1.20 0.80 6.28 1.67
86 5.67* 0.84 9.70* 1.59 28.33* 3.94 17.00 0.64 33.97 1.20 94.00* 33.41 9.93 3.33 1.25 1.02 6.04 1.24
89 5.49* 0.73 9.10* 1.31 26.73* 3.18 16.53 0.38 33.83 0.97 175.33 61.24 9.13 3.58 0.94 0.76 6.41 2.02
92 5.28* 0.67 9.00* 1.36 26.30* 3.23 16.87 0.58 33.93 1.27 100.33* 33.23 9.73 2.76 0.81 0.64 6.15 1.14
95 5.61* 1.01 9.33* 1.83 27.13* 4.48 16.50 0.46 33.97 1.34 142.67* 95.17 8.67 2.66 0.66 0.47 6.14 1.30
98 5.29* 0.86 8.87* 1.65 25.67* 4.12 16.60 0.57 34.20 1.50 156.00* 78.03 8.73 2.96 0.94 0.66 5.77 1.60
101 5.28* 0.73 8.57* 1.23 25.53* 3.22 16.23 0.32 33.40 0.70 175.00 75.50 9.30 3.15 0.76 0.65 5.90 1.57
104 5.26* 0.80 8.60* 1.37 25.43* 3.50 16.30 0.36 33.53 0.92 145.33* 64.71 9.40 3.37 0.48 0.33 6.78 1.83
107 5.19* 0.82 8.50* 1.40 25.00* 3.45 16.30 0.40 33.70 1.11 144.67* 73.34 10.37 3.44 0.66 0.49 7.48 2.11
110 5.34* 0.88 8.73* 1.48 25.73* 3.90 16.33 0.41 33.70 0.86 179.67 64.40 9.27 3.21 0.34 0.21 6.54 1.99
113 5.23* 0.86 8.53* 1.49 24.97* 3.84 16.23 0.33 33.87 1.07 106.67* 26.81 9.83 3.12 0.45 0.24 7.22 1.90
116 5.54* 0.96 9.00* 1.56 26.47* 4.21 16.27 0.49 33.80 0.61 228.33 49.10 8.60 2.80 0.71 0.42 5.97 1.60
presented a reduction and reached values very close to the lower limit for cattle, with subsequent recovery and normalization to values similar to 0 DAI, being verified statistically significant differences on 3 to 13 DAI. The absolute eosinophil count was down for approximately 70 days after infection with a subsequent increase; there was a statistically significant difference on 6 to 14 and 23 to 68 DAI. Lymphocytes initially showed a reduction and reached values near the lower limit for cattle in the first few days
post-infection. They later showed a large increase and presented lymphocytosis at day 40. During the rest of the experimental period, the animals showed values within the normal range but near the upper limits for cattle. There were statistically significant differences at 3 to 12, 41 and 44 DAI. Monocytes did vary during the experimental period and were only statistically different at 20 DAI. Neutrophils showed a similar behavior to that of lymphocyte but without statistical differences (Table 2, Figure 4).
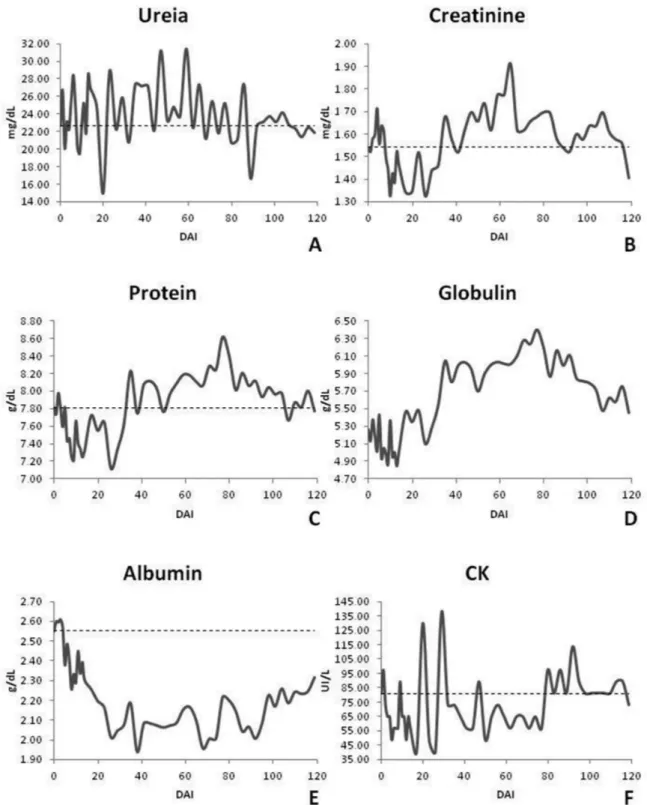
Just like the CBC, only some of the biochemical tests at certain times of the infection were statistically significant (p <0.05) versus baseline.
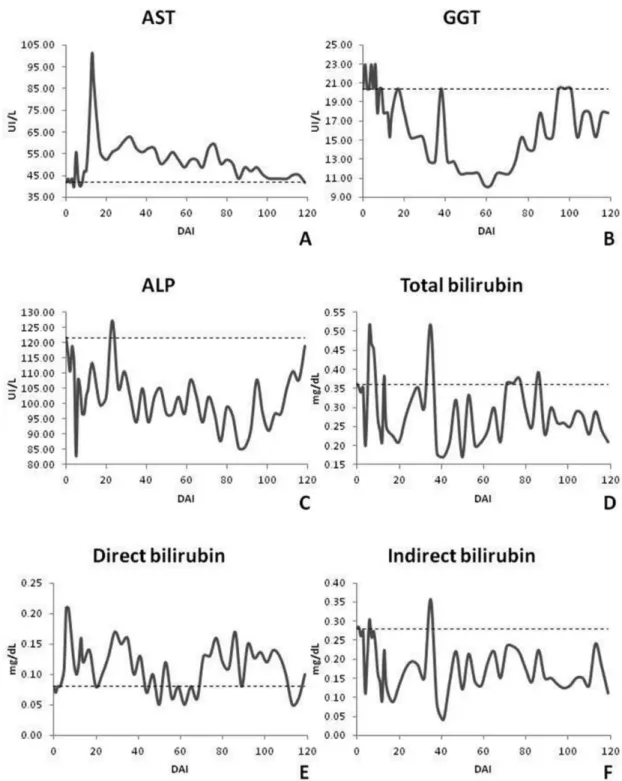
In assessing liver function, only AST and GGT enzymes showed specific statistical differences. The AST enzyme was seen in practically all of the experimental period values below the lower limit for cattle with statistical differences only on 12 to 14 DAI, when a peak occurred and 71 to 74 DAI. The GGT enzyme already started above the limit considered normal for bovine
with a subsequent reduction to normal values and fluctuation throughout the period with significant statistical difference at 47 to 68 DAI. ALP remained constant with no statistically significant difference versus baseline. The metabolites, total bilirubin and its fractions, did not show specific behavior during the experiment and remained within the limits considered normal for bovine except on two days for total bilirubin and a day to indirect bilirubin. These three metabolites showed no statistically significant difference (Figure 5).
We assessed renal function via urea and creatinine and there was no statistical significance versus baseline. Creatinine was within the normal range for bovine throughout the entire experimental period; urea fluctuated between normal values and above the limit. In assessing the total protein and its fractions (albumin and globulin), only albumin showed a significant statistical difference at 8, 17 and 20 DAI. Total protein initially
showed normal values with subsequent fluctuation between normal and increased values for bovine. Globulin showed a large increase during the chronic phase of infection, which was expected due to the production of antibodies. Albumin initially showed normal values with subsequent reduction and fluctuation between normal and reduced. The CK enzyme was always within the normal range (Figure 6).
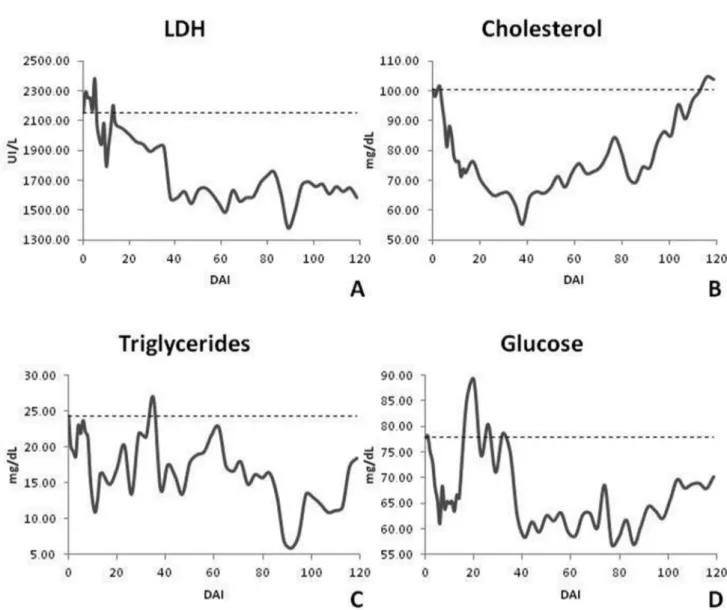
The LDH enzyme showed values above the normal range throughout the experiment. There were statistically significant differences for all of the chronic period starting at 38 DAI and going until the end of the experimental period (120 DAI). In the evaluation of cholesterol, triglycerides and glucose, there was no defined behavior. The cholesterol initially showed a decrease with subsequent normalization to levels near to the pre-infection with statistically significant differences on 6, 8 to 68 and 86 DAI. Triglycerides showed fluctuation throughout the experimental period with values above those considered normal for bovine with significant statistical differences on 9 to 17 and 89 to 95 DAI. Glucose showed an initial decrease in its concentration that was consistent with the period of increased parasitemia and a subsequent increase above the normal range for cattle. This was later reduced to normal values, but below that of pre-infection. It was statistically significant at 38 to 101 and 107 to 116 DAI (Figure 7).
Discussion
Clinical signs presented by the animals of this study were consistent with those reported by other authors (BATISTA et al., 2008; CADIOLI et al., 2012), consisting principally of apathy, enlarged lymph nodes, hyporexia, weight loss, diarrhea, submandibular edema and vaginal discharge, all mild to moderate degree. The animal’s susceptibility to infection is associated with several factors such as age, concurrent infections, pregnancy, lactation and nutritional conditions (KATUNGUKA-RWAKISHAYA et al., 1997). The cattle in this study were in excellent health and nutritional status and were kept in screened and isolated stalls, for 28 days prior to inoculation and thereafter for 120 days. They were not exposed to competition for food by other animals, weather conditions such as rain and intense sun, and had been dewormed and deticked, they were not subject to blood spoliation by ecto and endoparasites, presented an excellent response against the
parasite corroborating Paiva et al. (2000) who stated that cattle in good health and nutritional status have the ability to express satisfactory response to infection by T. vivax.
The pre-patent period (PPP) for the T. vivax was quite variable. The PPP was only two to three DAI, although parasites detected at this stage may be remnants of the inoculum. This finding corroborates those of Igbokwe et al. (1996) who used the Samaru (Nigeria) sample and Schenk et al. (2001) using the Poconé (MT) strain, both worked with cattle experimentally infected with T. vivax, found a PPP of two and three days, respectively. Moraes (2001) observed that cattle experimentally infected with Poconé (MT) strain had a PPP of two to 12 days.
The peak of parasitemia occurred at 12 DAI for the E1 and E3 animals, and on 13 DAI, for E2. Furthermore, in the first month post infection (acute phase) other smaller peaks of parasitemia occurred. Thereafter, circulating parasites were constantly detected until 53 DAI. Esievo & Saror (1983) detected the peak of parasitemia at 11 DAI followed by decreased parasitemia; parasites were detected up to 66 DAI. Moraes (2001) observed floating parasitemia and peaks in the first 30 days, but this dropped to zero after 60 DAI. On the other hand, Schenk et al. (2001) found parasitemia only for 30 DAI.
Croos (2003) reports that the persistence of parasitemia is possibly due to the protozoan evasion mechanism by antigenic variation of variants surface glycoproteins (VSG). These are very immunogenic and hide from the immune system low variables or invariant proteins (HORN, 2014). This variation is responsible for the recurrence of parasitemia. Paiva et al. (2000) believe that adaptation to the mechanical transmission has decreased antigenic variation of VSG, however Dagnachew et al. (2015) observed that T. vivax strains from areas without tsetse (only mechanical transmission occurs) are as pathogenic as those from areas with cyclical transmission. Another explanation for the persistence of the infection is refuge points with subsequent lapses in infection such as cerebrospinal fluid and aqueous humor (WHITELAW et al., 1988). The presence of T. vivax in the cerebrospinal fluid was
observed and correlated with central nervous system damage in chronically infected goats. Evidence included neurological disorders such as incoordination, falling, opisthotonos, nystagmus and paddling (BATISTA et al., 2011).
Cattle in this study showed weight loss in the early stages of infection. This was seen until 56 DAI. This coincided with the presence of large amounts of circulating T. vivax indicating that weight loss may be related to high energy consumption induced by an immune response (MENEZES et al., 2004), decreased energy availability to the host due to the intake of nutrients by trypanosomes (BOERO, 1974) or the release of cytokines such as tumor necrosis factor (TNF-α) that interfere in the availability of energy substrates in infected animals (LUCAS et al., 1993). Batista et al. (2006) noted no weight gain until 60 DAI highlighting the negative influence of T. vivax in weight gain. Thus, we believe that the association of these factors with high energy demand presented by dairy cattle during pregnancy and lactation can lead to death in the acute phase. Besides the direct influence on animal’s health, this weight loss has an obvious economic impact not only due deaths, reproductive disorders or spending on medication, but
reduced weight gain also delays first estrus and decreases weaning weight and milk production.
Erythrocyte changes were consistent with a mild infection. There was a steady decrease in the erythrocyte count, hemoglobin and PCV, although they remained within the reference values. Decreases in erythrocytes have been associated with erythrocytes desialylation in the acute phase of disease, stage of high parasitemia (GUEGAN et al., 2013). Our findings differ from those obtained by other authors in cattle (GARDINER et al., 1989; BATISTA et al., 2007, 2008; CUGLOVICI et al., 2010; CADIOLI et al., 2012) who noticed moderate to severe anemia. However, Schenk et al. (2001) observed a PCV decrease similar to our study, that reached a minimum value of 25% at 10 DAI and this variable did not return to pre-infection values.
Leukocytosis by lymphocytosis was observed by some authors in goats, sheep and cattle during the chronic phase of infection by
T. vivax (ANOSA et al., 1992; PAIVA et al., 2000), Paiva et al. (2000) also found eosinopenia. Leucopenia with lymphocytosis seems to be the major characteristic of WBC in the chronic phase of the disease (ESPINOZA & ASO, 1992; BATISTA et al. 2006; 2008), and leucopenia is an important event in T. vivax infections in cattle, sheep and goats (ESPINOZA & ASO, 1992).
Here, we observed WBC behavior similar to that shown by Esievo & Saror (1983) who showed a decrease in leukocytes between 4 to 9 DAI. This was seen until 19 DAI with a subsequent gradual increase until 159 DAI. Lymphocytes had a similar pattern. It has been suggested that early leukopenia during the trypanosomiasis may have been influenced by the bulk trypanosome antigen (MACKENZIE et al., 1978). Support for this comes from the fact that after the decline in parasitemia, the leukocyte values tend to return to the pre-infection phase and sometimes even exceed these values.
Another reason for the leukopenia found at the beginning of the infection may be due to leukocyte apoptosis a fact already demonstrated in the parasitemic stage of T. brucei infection in rats (HAPPI et al., 2012). The reduction of erythrocytes can be an additional cause for the neutrophilic decrease because previous studies demonstrated the ability of erythrocytes to protect neutrophils from apoptosis by glutathione and catalase metabolism (AOSHIBA et al., 1999). Eosinophils showed a decrease and corroborated with a previous study that demonstrated a reduction in cattle infected by T. vivax (DAGNACHEW et al., 2015).
The AST remained within the reference range. In other studies with cattle experimentally infected by T. vivax, this enzyme remained unchanged or presented an initial increase with subsequent decline (MORAES, 2001; SCHENK et al., 2001) as observed in our study. The peak observed at 12 to 14 DAI where there was a statistically significant difference. This was related to erythrophagocytosis caused by the parasite after peak parasitemia once this enzyme is present in erythrocytes (KANEKO et al., 2008). The decrease suggests the possibility of abnormal liver changes including fibrosis (KADIMA et al., 2000).
The GGT values were above the normal range for bovine at the beginning of the experimental period through day 12 and peaking again at day 92. Schenk et al. (2001) evaluated cattle experimentally infected with T. vivax, and observed significant changes in GGT values, but these remained within the normal range for bovine. Moura et al. (2009) noticed both increases and decreases. In ALP, values within normal limits were found throughout the trial period corroborating to the findings of Moura et al. (2009). Other authors found a decrease in this enzyme in infected animals (MORAES, 2001; ALMEIDA, 2007). Schenk et al. (2001) observed that the average values of ALP were occasionally higher than the reference range, although they suggest that this was due to the age of the animals in the study.
The total bilirubin and its fractions presented values within normal limits for bovine except at 6 and 35 DAI for total bilirubin, which was elevated. These values were likely not altered because there was not an intense hemolysis, once animals did not show severe anemia. Almeida (2007) evaluated sheep experimentally infected with T. vivax and obtained values within the normal range although infected animals presented higher values when compared to the testimonies. Kadima et al. (2000) assessed cattle experimentally infected and found bilirubin values to initially be within the normal range followed by an intermittent increase, this might indicate progressive liver damange.
Creatinine values remained within the normal range. Urea did as well with brief peaks above normal. Almeida (2007) studied infected sheep and showed values within the normal range with an increase in urea and a decrease in creatinine in the infected animals. Schenk et al. (2001) found significant changes between infected and uninfected animals for urea and creatinine, but values remained within the normal range for bovine. These changes were not detected and thus do not suggest renal dysfunction.
In assessing total protein and its fractions, albumin showed a decrease during the trial period starting with values within normal limits and decreasing until it reaches a hypoalbuminemia at day 26-56, it then increased to normalcy. Decreases in serum albumin can be related to liver injury once albumin is only produced in this organ (KANEKO et al., 2008). However, total protein and albumin can be found at normal levels even in the presence of liver damage unless hepatitis involves a large part of the liver and is severe enough to cause organ failure (PINCUS & SCHAFFNER, 1999).
Globulins increased from 35 DAI and peaked at 77 DAI. They remained there until the end of the experiment. The total protein showed values within the normal range at the beginning of the experiment with subsequent increases after 35 DAI. They alternated between normal and hyperproteinemia. Other
authors have seen similar behavior for total protein and its fractions including decreased albumin, increased globulin and total protein normal to increased (KATUNGUKA-RWAKISHAYA, 1996; SCHENK et al., 2001; SEKONI et al., 1990; VAN DAM et al., 1998). Schenk et al. (2001) observed a decrease in total protein and albumin values at 4 and 8 DAI, respectively, and a significant increase in gamma globulin values from 12 DAI. This was probably related to the antigenic stimulus triggered by the parasite. Increases in globulin were expected because infection by T. vivax generates a host immune response leading to antibody production as a way to control and eradicate the parasite. Katunguka-Rwakishaya (1996) correlated the hyperglobulinaemia with an increase in IgG and IgM.
CK remained normal, other authors observed decreased values for this enzyme in experimental infections (ALMEIDA, 2007; MOURA et al., 2009), Almeida (2007) suggests that this occurred due to the freezing time of samples. Schenk et al. (2001) observed significant changes in values between groups, but these remained within the normal range.
Cholesterol remained normal with values near the lower limit. Espinoza et al. (1998) and Schenk et al. (2001) observed hypocholesterolemia in goats and cattle inoculated with T. vivax, respectively. Similar findings were found by Katunguka-Rwakishaya et al. (1997) working with sheep experimentally infected with T. congolense. They noted that the decline in cholesterol levels starts with the appearance of trypanosomes in circulation as observed in our study. This is probably associated with the release of lysis products by the parasite. T. congolense, T. brucei and T. evansi
use glucose as well as triglycerides and cholesterol from the host as energy sources (COPPENS et al., 1995; KATUNGUKA-RWAKISHAYA et al., 1997). Low cholesterol levels are often found in many types of anemia due to greater use of plasmatic cholesterol determined by the replacement of erythrocyte lipids in cases of increased hemolysis (NAOUM, 2005).
Triglycerides remained above the normal range throughout the study. There was a specific reduction in the normal range. Rabbits experimentally infected with T. brucei (NAKAMURA, 1998) and dwarf goats infected with T. vivax (HAMMINGA et al., 1996) had hypertriglyceridemia due to the reduction of lipoprotein lipase activity. This was associated with liver damage. According to Nakamura (1998), the continuous release of TNF-α, in small amounts, suppressed the normal lipoprotein lipase synthesis in adipocytes leading to hypertriglyceridemia. We noted no increase in its production.
Glucose was within the normal range. Spikes seen in our study were due to feeding, once our animals were fed ad libitum. The decrease in glucose in the early stages of infection coincided with the parasitemia peak. This showed possible nutrient intake by trypanosomes (BOERO, 1974). Other authors had the same results (KATUNGUKA-RWAKISHAYA, 1996; VAN DAM et al., 1998; ALMEIDA, 2007). Kadima et al. (2000) and Batista et al. (2008) evaluated cattle and goats experimentally infected with
T. vivax, respectively, obtained glucose values below the reference
The “Lins” strain of T. vivax was pathogenic for cattle and resulted in disease in animals naturally infected (CADIOLI et al., 2012) and experimentally infected. Parasitemia was intense in the early stages of infection and persistent during the trial period, circulating parasites were detected for about three months. The most evident hematologic abnormalities were found in WBC, there was initially leukopenia by lymphopenia and neutropenia, yet standing out thrombocytopenia. Biochemical changes once subtle and punctual, are not useful to diagnosis trypanosomiasis by T. vivax.
Acknowledgements
We thank São Paulo Research Foundation (FAPESP) for financial support in the form of a grant given through procedural number 2011/15945-5 and research aid number 2012/02284-3. We thank Renata Lemos Nagib Jorge for her assistance in the CBC and biochemical analysis.
References
Almeida KS, Freitas FLC, Tebaldi JH, Alessi AC, Machado RZ, Nascimento AA. Alterações clínicas, histopatológicas e enzimáticas em ovinos infectados experimentalmente por Trypanosoma vivax. Cienc Anim Bras 2010; 11(3): 669-676.
Almeida KS. Alterações clínicas, hematológicas, bioquímicas e histopatológicas em ovinos infectados experimentalmente por Trypanosoma vivax (Ziemann, 1905) [Tese]. Jaboticabal: Universidade Estadual Paulista; 2007.
Anosa VO, Logan-Henfrey LL, Shaw MK. A light and electron microscopic study of changes in blood and bone marrow in acute hemorrhagic Trypanosoma vivax infection in calves. Vet Pathol 1992; 29(1): 33-45. http://dx.doi.org/10.1177/030098589202900105. PMid:1348380. Aoshiba K, Nakajima Y, Yasui S, Tamaoki J, Nagai A. Red blood cells inhibit apoptosis of human neutrophils. Blood 1999; 93(11): 4006-4010. PMid:10339510.
Aquino LPCT, Machado RZ, Alessi AC, Marques LC, Castro MB, Malheiros EB. Clinical, parasitological and immunological aspects of experimental infection with Trypanosoma evansi in dogs. Mem Inst Oswaldo Cruz 1999; 94(2): 255-260. http://dx.doi.org/10.1590/S0074-02761999000200025. PMid:10224539.
Assoku RKG, Gardiner PR. Detection of antibodies to platelets and erythrocytes during infection with hemorrhage-causing Trypanosoma vivax in Ayrshire cattle. Vet Parasitol 1989; 31(3-4): 199-216. http:// dx.doi.org/10.1016/0304-4017(89)90070-8. PMid:2503920. Batista JS, Bezerra FSB, Lira RA, Carvalho JRG, Rosado AM No, Petri AA, et al. Aspectos clínicos, epidemiológicos e patológicos da infecção natural em bovinos por Trypanosoma vivax na Paraíba. Pesqui Vet Bras 2008; 28(1): 63-69. http://dx.doi.org/10.1590/S0100-736X2008000100010.
Batista JS, Riet-Correa F, Barbosa RC, Guerra JL. Infecção experimental por Trypanosoma vivax em ovinos. Pesqui Vet Bras 2006; 26(1): 31-37. http://dx.doi.org/10.1590/S0100-736X2006000100007.
Batista JS, Riet-Correa F, Teixeira MMG, Madruga CR, Simões SDV, Maia TF. Trypanosomiasis by Trypanosoma vivax in cattle in the Brazilian semiarid: description of an outbreak and lesions in the nervous system. Vet Parasitol 2007; 143(2): 174-181. http://dx.doi.org/10.1016/j. vetpar.2006.08.017. PMid:16965857.
Batista JS, Rodrigues CMF, Garcia HA, Bezerra FSB, Olinda RG, Teixeira MMG, et al. Association of Trypanosoma vivax in extracellular sites with central nervous system lesions and changes in cerebrospinal fluid in experimentally infected goats. Vet Res 2011; 42(1): 63. http:// dx.doi.org/10.1186/1297-9716-42-63. PMid:21569364.
Boero JJ. Parasitosis animales: generalidades parasitológicas, micosis, protozoosis, helmintiasis, entomozoosis. 3th ed. Buenos Aires: Eudeba; 1974.
Brener Z. Contribuição ao estudo da terapêutica experimental da doença de Chagas [Tese]. Belo Horizonte: Universidade Federal de Minas Gerais; 1961. Cadioli FA, Barnabé PA, Machado RZ, Teixeira MCA, André MR, Sampaio PH, et al. First report of Trypanosoma vivax outbreak in dairy cattle in São Paulo state, Brazil. Rev Bras Parasitol Vet 2012; 21(2): 118-124. http:// dx.doi.org/10.1590/S1984-29612012000200009. PMid:22832751. Carvalho AU, Abrão DC, Facury EJ Fo, Paes PRO, Ribeiro MFB. Ocorrência de Trypanosoma vivax no estado de Minas Gerais. Arq Bras Med Vet Zootec 2008; 60(3): 769-771. http://dx.doi.org/10.1590/S0102-09352008000300037.
Coppens I, Levade T, Courtoy PJ. Host plasma low density lipoprotein particles as an essential source of lipids for the bloodstream forms of Trypanosoma brucei. J Biol Chem 1995; 270(11): 5736-5741. http:// dx.doi.org/10.1074/jbc.270.11.5736. PMid:7890701.
Cortez AP, Rodrigues AC, Garcia AH, Neves L, Batista JS, Bengaly Z, et al. Cathepsin L-like genes of Trypanosoma vivax from Africa and south America: characterization, relationships and diagnostic implications. Mol Cell Probes 2009; 23(1): 44-51. http://dx.doi.org/10.1016/j. mcp.2008.11.003. PMid:19063960.
Croos GAM. Antigenic variation in African Trypanosomes and malaria. In: Marr JJ, Nilsen TW, Komuniecky RW. Molecular medical parasitology. San Diego: Academic Press; 2003. p. 82-110.
Cuglovici DA, Bartholomeu DC, Reis-Cunha JL, Carvalho AU, Ribeiro MFB. Epidemiologic aspects of an outbreak of Trypanosoma vivax in a dairy cattle herd in Minas Gerais state, Brazil. Vet Parasitol 2010; 169(3-4): 320-326. http://dx.doi.org/10.1016/j.vetpar.2009.12.041. PMid:20138431.
Dagnachew S, Bezie M, Terefe G, Abebe G, Barry JD, Goddeeris BM. Comparative clinico-haematological analysis in young Zebu cattle experimentally infected with Trypanosoma vivax isolates from tsetse infested and non-tsetse infested areas of Northwest Ethiopia. Acta Vet Scand 2015; 57(1): 24. http://dx.doi.org/10.1186/s13028-015-0114-2. PMid:25986858.
Dávila AMR, Silva RAMS. Animal trypanosomiasis in South America: current status, partnership, and information technology. Ann N Y Acad Sci 2000; 916(1): 199-212. http://dx.doi.org/10.1111/j.1749-6632.2000. tb05291.x. PMid:11193622.
Esievo KAN, Saror DI. Leukocyte response in experimental Trypanosoma vivax infection in cattle. J Comp Pathol 1983; 93(2): 165-169. http:// dx.doi.org/10.1016/0021-9975(83)90002-6. PMid:6863606.
Espinoza E, Aso P. Valores hematológicos de bovinos infectados experimentalmente con un aislado venezolano de Trypanosoma vivax. Parte II. Leucócitos. Rev Salud Animal 1992; 14: 41-49.
Espinoza E, Primera G, González N, Hidalgo L. Niveles de colesterol serico total y lipoproteinas de alta densidad en cabras infectadas experimentalmente con Trypanosoma vivax. Vet Trop 1998; 23(2): 93-100.
Garcia HA, Rodrigues AC, Rodrigues CM, Bengaly Z, Minervino AH, Riet-Correa F, et al. Microsatellite analysis supports clonal propagation and reduced divergence of Trypanosoma vivax from asymptomatic to fatally infected livestock in South America compared to West Africa. Parasit Vectors 2014; 7(1): 210. http://dx.doi.org/10.1186/1756-3305-7-210. PMid:24885708.
Gardiner PR, Assoku RKG, Whitelaw DD, Murray M. Haemorrhagic lesions resulting from Trypanosoma vivax infection in Ayrshire cattle. Vet Parasitol 1989; 31(3-4): 187-197. http://dx.doi.org/10.1016/0304-4017(89)90069-1. PMid:2763442.
Guegan F, Plazolles N, Baltz T, Coustou V. Erythrophagocytosis of desialylated red blood cells is responsible for anaemia during Trypanosoma vivax infection. Cell Microbiol 2013; 15(8): 1285-1303. http://dx.doi. org/10.1111/cmi.12123. PMid:23421946.
Hamminga BJ, Wensing T, Zwart D. Changes in liver and fat depots of west African dwarf goats (Capra aegagus hircus) after an infection with T. vivax. Comp Biochem Physiol A Physiol 1996; 113(4): 401-406. Happi AN, Milner DA Jr, Antia RE. Blood and tissue leukocyte apoptosis in Trypanosoma brucei infected rats. J Neuroparasitology 2012; 3: 10. http://dx.doi.org/10.4303/jnp/N120101.
Hoare CA. The Salivaria: Subgenus Duttonella Chalmers, 1918. In: Hoare CA. The trypanosomes of mammals: a zoological monograph. Oxford: Blackwell Scientific Publications; 1972. p. 401-429.
Horn D. Antigenic variation in African trypanosomes. Mol Biochem Parasitol 2014; 195(2): 123-129. http://dx.doi.org/10.1016/j. molbiopara.2014.05.001. PMid:24859277.
Igbokwe IO, Umar IA, Omage JJ, Ibrahim NDG, Kadima KB, Obagaiye OK, et al. Effect of acute Trypanosoma vivax infection on cattle erythrocyte glutathione and susceptibility to in vitro peroxidation. Vet Parasitol 1996; 63(3-4): 215-224. http://dx.doi.org/10.1016/0304-4017(95)00887-X. PMid:8966988.
Kadima KB, Gyang EO, Saror DI, Esievo KAN. Serum biochemical values of Trypanosoma vivax-infected cattle and the effects of lactose in saline infusion. Vet Arhiv 2000; 70(2): 67-74.
Kaneko JJ, Harvey JW, Bruss ML. Clinical biochemistry of domestic animals. 6th ed. San Diego: Academic Press; 2008.
Katunguka-Rwakishaya E, Murray M, Holmes PH. The influence of supplementation with cotton seed cake on the resistance of Uganda goats to primary and secondary challenges with Trypanosoma congolense and on their response to treatment. Vet Parasitol 1997; 70(1-3): 67-76. http://dx.doi.org/10.1016/S0304-4017(96)01136-3. PMid:9195711. Katunguka-Rwakishaya E. Influence of Trypanosoma congolense infection on some blood inorganic and protein constituents in sheep. Rev Elev Med Vet Pays Trop 1996; 49(4): 311-314. PMid:9239939.
Linhares GFC, Dias FD Fo, Fernandes PR, Duarte SC. Tripanossomíase em bovinos no município de Formoso do Araguaia, Tocantins (relato de caso). Cienc Anim Bras 2006; 7(4): 455-460.
Lucas R, Magez S, Songa EB, Darji A, Hamers R, Baetselier P. A role for TNF during African Tripanosomiasis: involvement in parasite control, immuno-suppression and pathology. Res Immunol 1993; 144(5): 370-376. http://dx.doi.org/10.1016/S0923-2494(93)80082-A. PMid:8278660.
Mackenzie RK, Boyt WP, Nesham VW, Pirie E. The aetiology and significance of the phagocytosis of erythrocytes and leukocytes in sheep infected with Trypanosoma congolense (Broden, 1904). Res Vet Sci 1978; 24(1): 4-7. PMid:343212.
Menezes VT, Queiroz AO, Gomes MAM, Marques MAP, Jansen AM. Trypanosoma evansi in inbred and Swiss-Webster mice: distinct aspects
of pathogenesis. Parasitol Res 2004; 94(3): 193-200. http://dx.doi. org/10.1007/s00436-004-1207-4. PMid:15338287.
Moraes MAV. Trypanosoma vivax: infecção experimental em bovinos (Bos indicus) [Dissertação]. Jaboticabal: Universidade Estadual Paulista; 2001. Moura DM, Paneto JCC, Bittar ER, Bittar JFF. Perfil bioquímico de bovinos naturalmente infectados por Trypanosoma vivax. Cienc Anim Bras 2009; S1: 642-647.
Nakamura Y. Alterations of serum lipid, lipoprotein and inflammatory cytokine profiles of rabbits infected with Trypanosoma brucei brucei. Vet Parasitol 1998; 80(2): 117-125. http://dx.doi.org/10.1016/S0304-4017(98)00200-3. PMid:9870364.
Naoum FA. Alterações do perfil lipídico nas anemias. Rev Bras Hematol Hemoter 2005; 27(3): 223-226. http://dx.doi.org/10.1590/S1516-84842005000300018.
Olubayo RO, Mugera GM. Pathogenesis of haemorrhages in Trypanosoma vivax infection in cattle. I. Disseminated intravascular coagulation. Bull Anim Health Prod Afr 1985; 33(3): 211-217.
Paiva F, Lemos RAA, Nakazato L, Mori AE, Brum B, Bernardo KC. Trypanosoma vivax em bovinos no pantanal do estado do Mato Grosso do Sul, Brasil: I: acompanhamento clínico, laboratorial e anatomopatológico de rebanhos infectados. Rev Bras Parasitol Vet 2000; 9(2): 135-141. Pimentel SP, Ramos CAN, Ramos RAN, Araújo FR, Borba ML, Faustino MAG, et al. First report and molecular characterization of Trypanosoma vivax in cattle from state of Pernambuco, Brazil. Vet Parasitol 2012; 185(2-4): 286-289. http://dx.doi.org/10.1016/j.vetpar.2011.10.019. PMid:22054681.
Pincus MR, Schaffner JA. Liver function. In: Henry JB. Clinical diagnosis and management by laboratory methods. 19th ed. São Paulo: Manole; 1999. p. 594-615.
Schenk MAM, Mendonça CL, Madruga CR, Kohayagawa A, Araújo FR. Avaliação clínico-laboratorial de bovinos nelore infectados experimentalmente com Trypanossoma vivax. Pesqui Vet Bras 2001; 21(4): 157-161. http:// dx.doi.org/10.1590/S0100-736X2001000400006.
Sekoni VO, Saror DI, Njoku CO, Kumi-Diaka J, Opaluwa GI. Comparative hematological changes following Trypanosoma vivax and T. congolense infection in Zebu bulls. Vet Parasitol 1990; 35(1-2): 11-19. http://dx.doi.org/10.1016/0304-4017(90)90112-O. PMid:2343522. Silva AS, Costa MM, Polenz MF, Polenz CH, Teixeira MMG, Lopes STA, et al. Primeiro registro de Trypansoma vivax em bovinos no estado do Rio Grande do Sul, Brasil. Cienc Rural 2009; 39(8): 2550-2554. http://dx.doi.org/10.1590/S0103-84782009005000189.
Silva RAMS, Ramirez L, Souza SS, Ortiz AG, Pereira SR, Dávila AMR. Hematology of natural bovine trypanosomosis in the Brazilian pantanal and Bolivian wetlands. Vet Parasitol 1999; 85(1): 87-93. http://dx.doi. org/10.1016/S0304-4017(99)00081-3. PMid:10447196.
van Dam JTP, van der Heide D, van der Ingh TSGAM, Wensing T, Zwart D. The effect of the quality of roughage on the course of Trypanosoma vivax infection in West African Dwarf goats: II – Metabolic profile, packed cell volume, and pathology of disease. Livest Prod Sci 1998; 53(1): 81-90. http://dx.doi.org/10.1016/S0301-6226(97)00127-9.
Whitelaw DD, Gardiner PR, Murray M. Extravascular foci of Trypanosoma vivax in goats: the central nervous system and aqueous humor of the eye as potential sources of relapse infections after chemotherapy. Parasitology 1988; 97(1): 51-61. http://dx.doi.org/10.1017/S0031182000066737. PMid:3174238.