Vol.52, n. 3: pp. 729-736, May-June 2009
ISSN 1516-8913 Printed in Brazil BRAZILIAN ARCHIVES OF
BIOLOGY AND TECHNOLOGY
A N I N T E R N A T I O N A L J O U R N A L
Influence of Vitamin E Supplemented Diet on Charque
Quality and Lipid Stabilization
Elizete Maria Pesamosca Facco,
1*Moacir Evandro Lage
2and Helena Teixeira Godoy
11Departamento de Ciência de Alimento, Faculdade de Ciência de Alimentos; Universidade de Campinas; C.P.: 612;
13083-970; Campinas - SP - Brasil. 2Centro de Pesquisa em Alimentos; Escola de Veterinária; Universidade Federal de Goiás; C.P.: 131; 74001 970; Goiânia - GO - Brasil
ABSTRACT
The present work evaluated and compared the lipid oxidation of charque, taken from, the semi-tendinosus muscle of animals from the Nelore breed (Bos taurus indicus), supplemented with α-tocopherol. Charque was produced submitting the samples to salt moisture, salt drying and exposition to the sun for dehydration until water activity values (Aw) reached 0.75. The statistical analysis of the results showed that there were no significant differences in the values of cholesterol, total lipids, fatty acids and substances relative to tiobarbituric acid (TBARS) and tocopherol as the samples were controlled and supplemented, respectively. Despite this, the values of TBARS and
cholesterol were lower in the samples with the supplement of α-tocopherol. The supplementation, at the levels used
showed no significant result in the addition of α-tocopherol in the feeding of animals destined for the processing of charque.
Key words: Charque, lipid oxidation, tocopherol, vitamin, supplementation
*
Author for correspondence: [email protected]
INTRODUCTION
Charque is a meat product made by the salting and sun-drying of pieces of meat until water activity (Aw) reaches approximately 0.75. The low water activity in the processed meat enables the conservation of charque at room temperature and its use as a protein source for the population who are without a source of refrigeration.
Charque is prepared by means of a process that takes into account the salt, luminosity and air properties, which accelerate many degradation reactions, mainly, oxidization reactions.
Lipid oxidation deterioration is one of the main problems of food production in terms of technical and economical points of view, because it limits
they determine the quality and the shelf life of these products. There was a steady increase of oxidation approximately eight times during storage after 90th day of processing. On the other hand, in cured jerked beef, the effect of nitrite antioxidant activities was noticeable. After processing, in desalted samples, TBARS measurement in both charque and jerkeed beef samples revealed that there was approximately twice as much lipid oxidation in the nitrite-free charqui (Youssef et al., 2003)
Lipid oxidation has a direct influence on the composition of the fatty acids. The evaluation of the composition of the fatty acids from sun dried meat (Lira et al., 2000) and charque (Torres et al., 1989) showed that there was a loss of unsaturated fatty acids, considered essential, with a consequential proportional increase in saturated fatty acids, which were associated with the health problems. In charque, the biggest fraction of fatty acids belongs to the saturated ones, a smaller fraction to diunsaturated and an even smaller portion, around 2% to polyunsaturated ones (Torres et al., 1989). The fatty acid profile of charque and jerked beef had little influence of the processing conditions (Correia and Biscontini, 2003).
A way to minimize the loss of nutritiously important substances and the production of compounds, which are bad for health is through the use of antioxidants, especially those that can be found in nature. This is due not only to the consumer’s tendency to reject the use of additives in food, but also to avoid possible collateral effects. Nowadays, many studies have been developed on the activity of vitamin E (tocopherols) as a natural antioxidant in the muscles. It has been observed that supplementation at a supranutricious level in the diet of animals in the termination fattening phase increases the concentration of tocopherols in the muscle cell. Consequently, there would be a lessening of the oxidation effects and, therefore, a decrease in the severity of the subsequent alterations in the muscle tissue (Mitsumoto et al., 1993; Buckley et al., 1995; Liu et al., 1996a; Liu et al., 1996b; Jensem et al., 1997; Jensem et al., 1998; Lynch et al., 1999; Houben et al., 2000; Rey et al, 2001; Grau et al., 2001, Descalzo et al. 2005; Kin et al. 2006; Walshe et al. 2006). The toxicity did not appear in ruminants and there was a great safety margin in the use of vitamin E in the diet of the majority of the animals (Nutrient
Requirements Of Beef Cattle, 1996).
Data found in literature refer to the post mortem addition of α-tocopherol. Torres et al. (1989) added BHA/BHT and α-tocopherol during the processing of charque, stating that the diminishing of the number of TBA was effective only in the first two weeks of storage of the product.
Therefore, the objective of this work was to comparatively evaluate the lipid oxidation in charque from animals supplemented and non-supplemented with α-tocopherol and determine the composition of the fatty acids, relating it to the supplementation effect.
MATERIAL AND METHODS
Materials
Meat samples for charque processing were acquired from supplemented or non-supplemented animals in confinement. The confinement was carried out with 24 animals of the Nelore breed (Bos taurus indicus), all male, castrated, with an initial average weight of 279 Kg, which belonged to the Departament of Zootecnology of the Faculty of Zootecnology and Food Engineering USP, Pirassununga, SP. These animals were confined for 98 days, after 28 days of adaptation. The animals were confined in 12 stalls for two, separated into two groups of 12, in a balanced manner. One group received mixed ration with a corn concentrated base, soy meal, citric pulp, mineral and bulky mixture based on raw sugar cane bagasse, while the other received the same ration supplemented with α-tocopherol acetate (Lutavit E 50% - BASF), 1000mg/head/day of the active principal, while the other group received the same ration without supplementation.
The animals were slaughtered in the abattoir located in the above-mentioned farm. The carcasses were maintened for 24 h in cold storage. After this, one semi-tendinous muscle from each animal was removed and sent, under refrigeration, to the Laboratory of Meat Technology at the Faculty of Food Engineering, UNICAMP, Campinas-São Paulo, Brazil, for the manufacture of charque, following the procedure described by Picchi and Cia (1980).
rocksalt and pressed. The applied pressure was 0.5kg/cm2. After 24 h, salting was carried out once again. So as to uniform salt concentration, the pieces were inverted and the salt layer was adjusted. After five turnovers, the samples were washed to remove the excess salt on the surface and left to dry at room temperature. After 24 h, the sundrying process was initiated until Aw values near 0.75 (5 days of exposure) were reached. After drying, the pieces were pared, vacuum packed and stored under refrigeration at 4ºC. The pieces were submitted to wet salting followed by drip hanging. An 8 cm long sample (the whole length of the sample) was taken. The visible fat and 5 cm from the border were removed. The muscle part of the sample was mixed in a food multiprocessor and stored for total fatty analyses, the composition of fatty acids, number of TBARS, α-tocopherol and cholesterol.
Methods
The methods used for characterization of lipid oxidation in charque samples are described below. All analyses were carried out in duplicate for each of the 27 samples of semi-tendinous muscle. Lipids – The analysis of total lipids was carried out following Bligh and Dyer (1959). The method is based on the extraction with chloroform:methanol (2:1) and gravimetric determination.
Fatty acid – The transterification and methylation of the fatty acids in the samples was carried out according to Metcalfe et al. (1966). The chromatographic analysis was developed in a gas chromatograph (VARIAN, 3300 model) with flame ionisation detector, split/splitless injector, 98:2 split reason, capillary column fused silica DB-FFAP (30m x 0.32mm x 0.25µm). The operation parameters were: detector temperature 280ºC; injector temperature 250ºC; column temperature 140ºC for 30 min and at a rate of 2.5ºC/min also at 210ºC. The final temperature was kept constant for 20 min. An HP (Helwett Packard) chromatograph (model 1050) with a Rheodyne model manual injection system (20 µl), equipped with a 20 µl sample loop, and a diode array detector (DAD) (UV-Vis) was used.
To identify the fatty acids, the retention time comparison (tr) with the peaks of the sample chromatograms and of the methylic esters chromatogram (fatty acid mix, Sigma - F.A.M.E.
Mix C4-C24) and the correct equivalent length corrected values of the chain (ECL’) were used. TBARS test – The evaluation of lipid oxidation was carried out by means of a TBA test, following Raharjoet al. (1992). The method is based on 2-tiobarbituric acid with malonaldehyde reaction, producing a pink colored product, the absorbance of which is measured in the espectrophotometer (Perkin Elmer lambda 6 Series PECSS) at 531 nm. Quantification was carried out using a standard curve made with 1,1,3,3-tetraetoxipropane solutions.
Cholesterol and alpha-tocopherol – Free cholesterol and alpha-tocopherol analyses were carried out for simultaneous determination with high performance liquid chromatography (HPLC) according to Katsandis and Addis (1999). This was linked to the Software HP-Chemstation system, which in addition to monitoring all the compounds provided a better data treatment. The separation of cholesterol and alpha-tocopherol was carried out with a 5µ Microsorb-MV
chromatographic column(4.6mx150mm). The elution system was isocratic, with a mobile phase made up of 99:1 hexano:isopropanol (V/V) and a 1.3 ml/min flow rate. Detection of the cholesterol and alpha-cholesterol was carried out at 202 and 295nm, respectively. The identification was made by comparison of the retention time of the standards obtained under the same conditions; co-chromatography and the absorbance spectra of the standard and samples obtained from the DAD detector. The degree of purity of the peak was evaluated by the software. Quantification was carried out by external standardization. The concentration of the analytical curve was 115µg/ml to 1153µg/ml for cholesterol in hexane, with 0.53µg/ml to 20.0µg/ml concentration levels for the alpha-tocopherol in hexane.
All the data were submitted to variance analysis (ANOVA), with test t (Tukey) parameter at a 95% confidence level.
RESULTS AND DISCUSSION
between the controlled and alpha-tocopherol supplemented charque samples. The high coefficient variation could be related to the difference among the animals, as the samples were from different animals.
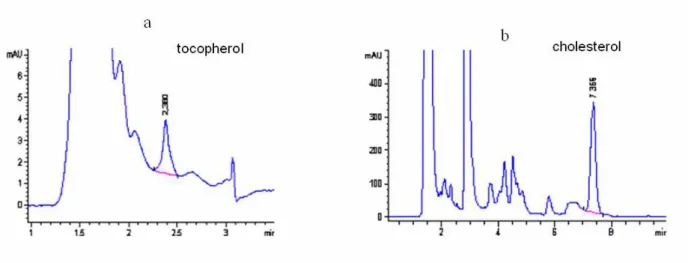
Figure 1 shows a characteristic chromatogram of charque extract, pointing out the α-tocopherol (a) and cholesterol (b) peaks. The average cholesterol values found were 168.4mg/100g and 160.9mg/100g for control and supplemented samples, respectively, varying from 147.2 to
187.8mg/100g for control samples and from 129.3 to188.7mg/100g for supplemented samples. There was very little data in literature on the amount of cholesterol in charque or in other de-hydrated meat. Torres et al. (1989), however, reported the presence of cholesterol oxidation products in charque. The amount of cholesterol in charque was approximately 3.5 times highes in comparison to the amount found in raw Nelore meat (40mg/100g) by Bragagnolo (1997).
Tabela 1- Total lipids, cholesterol and TBARS in charque samples.
Sample Range1 M±±±±sd2 cv%3
lipids (%) Control 7.1-12.6 8.4±1.9 23.2
supplemented 6.5-11.8 8.5±1.7 20.2
Cholesterol (mg/100g) Control 147.2-187.8 168.4±12.8 7.6
supplemented 129.3-188.7 160.9±16.9 10.5
TBARS (mg/kg) Control 1.0-1.7 1.4±0.2 16.0
supplemented 1.1-1.9 1.3±0.2 17.6
1. Minimum and maximum values found in the 12 samples of charque analyzed 2. Average and standard derivation of 12 determinations in duplicate.
3. Coefficient of variation.
Figure 1 - Cromatogram of charque by HPLC. Column Microsorb-MV 5µ (4.6mx150mm). Mobile phase: hexane:isopropanol (99:1), Flow 1.3ml/min. Detection of α-tocopherol (a) a 295nm and of the cholesterol ( b) 202nm.
The TBAR values found were 1.4 and 1.3mg/kg for the control and supplemented samples, respectively. Torres et al. (1989) analysing the lipidic oxidation of charque using distillation after 60 days of storage, found 2.5 and 4.5 mg of malonaldehyde/kg of sample for the charque processed with salt and rock salt, respectively. Torres et al. (1994) analysing the charque after 40 days of storage found similar TBA values, 2.58mg
Witte et al., 1970) or 1.3 to 1.4 times (Pikul et al., 1989). The results of this work were approximately 1.9 times smaller than those found in literature and similar to those found by Salih et al. (1987) and Witte et al. (1970). The high variation coefficient values could be associated to the difference in the quantity of fat interlaid, the
action of the oxidant agents during the processing and the differences in the metabolism of α -tocopherol in the animals.
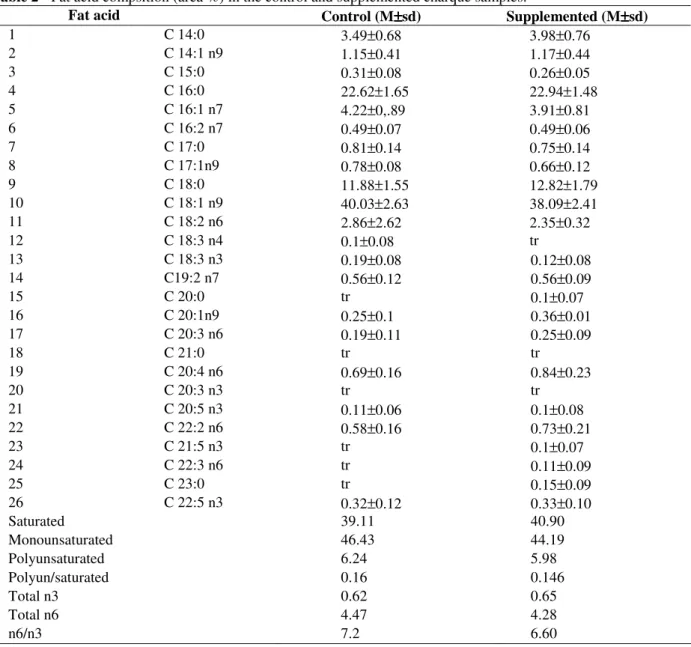
Fatty acids in the total lipids, identified in the supplemented and control samples and their relative percentages, are presented in Table 2.
Table 2 - Fat acid compsition (area %) in the control and supplemented charque samples.
Fat acid Control (M±±±±sd) Supplemented (M±±±±sd)
1 C 14:0 3.49±0.68 3.98±0.76
2 C 14:1 n9 1.15±0.41 1.17±0.44
3 C 15:0 0.31±0.08 0.26±0.05
4 C 16:0 22.62±1.65 22.94±1.48
5 C 16:1 n7 4.22±0,.89 3.91±0.81
6 C 16:2 n7 0.49±0.07 0.49±0.06
7 C 17:0 0.81±0.14 0.75±0.14
8 C 17:1n9 0.78±0.08 0.66±0.12
9 C 18:0 11.88±1.55 12.82±1.79
10 C 18:1 n9 40.03±2.63 38.09±2.41
11 C 18:2 n6 2.86±2.62 2.35±0.32
12 C 18:3 n4 0.1±0.08 tr
13 C 18:3 n3 0.19±0.08 0.12±0.08
14 C19:2 n7 0.56±0.12 0.56±0.09
15 C 20:0 tr 0.1±0.07
16 C 20:1n9 0.25±0.1 0.36±0.01
17 C 20:3 n6 0.19±0.11 0.25±0.09
18 C 21:0 tr tr
19 C 20:4 n6 0.69±0.16 0.84±0.23
20 C 20:3 n3 tr tr
21 C 20:5 n3 0.11±0.06 0.1±0.08
22 C 22:2 n6 0.58±0.16 0.73±0.21
23 C 21:5 n3 tr 0.1±0.07
24 C 22:3 n6 tr 0.11±0.09
25 C 23:0 tr 0.15±0.09
26 C 22:5 n3 0.32±0.12 0.33±0.10
Saturated 39.11 40.90
Monounsaturated 46.43 44.19
Polyunsaturated 6.24 5.98
Polyun/saturated 0.16 0.146
Total n3 0.62 0.65
Total n6 4.47 4.28
n6/n3 7.2 6.60
n3 fatty acid Omega 3. n6 fatty acid Omega 6. NI – not identified. tr – trace.
M±sd – Médias values found in the 12 samples of charque analyzed.
Six of them were the most important; the sums of their respective areas was 84.86% in the control samples and 84.09% in the treatment. They were C14:0, C16:0, C16:1n7, C18:0, C18:1n9, C18:2n6.
only 6.24% and 5.95% were polyunsaturated. The ratio of polyunsaturated fatty acids in terms of the saturated ones was, for control and treatment, 0.16 and 0.15, respectively and the n3/n6 ratio was 0.14 for control and 0.15 for treatment.
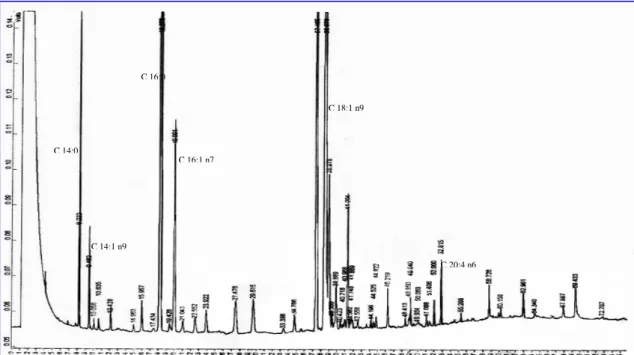
Figure 2presents a chromatographic profile of the fatty acids in the charque sample. Torres et al. (1989) found values of 54.36% for saturated fatty acids, in the total triglicerols and 46.18% in the phospholipid portion of charque processed with salt and 60 days of storage. The data of the present work could be compared to the works of Lira et al. (2000) who analyzing sun dried meat found a
value of 39.46% for the saturated fatty acid fraction and 60.16% for the unsaturated one, of which 53.75% was monounsaturated.
The averages and estimates of the standard deviation of the concentration of α-tocopherol in the muscle, expressed in µg of α-tocopherol /100g of sample, are shown in Table 3.
There was no significant difference between the control and supplemented samples, for a confidence level of 95%. The α-tocopherol varied from 3.8 to 10.0µg/100g in the control sample and from 3.6 to 9.5µg /100g in the treatment sample.
Figure 2 - Chromatogram of the fatty acid of charque by CG. Capilar column of fused silica DB-FFAP (30m x 0.32mm x 0.25µm). Detector temperature 280ºC; injector temperature 250ºC; column temperature 140ºC for 30 minutes, and program 2.5ºC/ minutes also 210ºC, stability for 20 minutes and split 98:2.
Table 3 - α-Tocopherol levels in the samples of charque. α αα
α-tocopherol µµµµg/100g
Sample Range1 M±±±±sd2 cv%3
Control 3.8-10.0 6.8±2.2 31.7
Supplemented 3.6-9.4 5.8±2.4 41.0
1. Minimum and maximum values found in the 12 samples of charque analyzed. 2. Average and standard derivation of 12 determinations in duplicate.
3. Coefficient of variation.
C 18:1 n9
C 16:1 n7 C 14:0
C 20:4 n6 C 16:0
Many studies using raw “in natura”1 meat showed that the supplementation of α-tocopherol reduced the lipid oxidation and the oxidation of mioglobin, insuring better quality of the meat (Mitsumoto et al., 1993; Buckley et al., 1995; Liu et al., 1996a; Jensem et al., 1997; Jensem et al., 1998; Lynch et al., 1999, Houben et al., 2000; Rey et al., 2001; Descalzo et al. 2005; Walshe et al. 2006). However, the results showed that either the concentration of α-tocopherol used in the supplementation was not sufficient to increase the levels in the muscle part of the charque and retarded the oxidation effect, or the oxidation processes were so intense that the tocopherol concentration was not sufficient. For meat, however, Liu et al. (1995) recommended the use of 500mg of α-tocopherol acetate/day/head during 126 days of cattle confinement, which was enough to carry out a protection effect against lipid oxidation. Another factor was the fact that the experiment was conducted with young growing animals.
There was no significant difference (95%) between the control and supplemented samples.
ACKNOWLEDGEMENTS
Authors thank the Faculty of Zootecnology and Food Engineering USP, Pirassununga, Spand FAPESP for the financial support.
RESUMO
O processamento do charque acelera as reações oxidativas. Com o intuito de diminuir as conseqüências dessas reações indesejáveis, lança-se mão do uso de antioxidantes, principalmente os naturais, que são mais bem aceitos pela população consumidora. O presente trabalho avaliou e comparou a oxidação lipídica do charque, obtido a partir de ponta de agulha de bovinos da raça Nelore, suplementados com 1000mg/dia/cabeça de α-tocoferol e sem a suplementação. A análise estatística dos resultados mostrou que não houve diferença significativa nos valores de colesterol (168,4 e 160,9), lipídios totais (8,4 e 8,5), TBARS (1,4 e 1,3) e α-tocoferol para as amostras controle e suplementadas, respectivamente. Foram identificados 35 ácidos graxos Os principais ácidos graxos presentes nas amostras de charque
foram: C14:0, C16:0, C16:1, C18:0, C18:1, C18:2, sendo majoritário o C18:1n9. A suplementação, nos níveis utilizados não mostrou resultados significativos na adição do α-tocoferol na alimentação de bovinos destinado ao processamento do charque.
REFERENCES
Bligh, E. C. and Dyer, W. J.(1959) A rapid method of total lipid. Extration and purification. Can. J. Biochem. Physiol. 37, 91-97.
Buckley, D. J.; Morissey, P.A. and Gray, J. I. (1995) Influence of dietary vitamin E on the oxidative stability and quality of pig meat. J. Anim. Sci. 73, 3122-3130.
Bragagnolo, N. (1997.) Fatores que influenciam o nível de colesterol, lipídios totais e composição de ácidos graxos em camarão e carne. Tese de doutorado (Ciências de Alimentos) – Faculdade de Engenharia de Alimentos, Universidade Estadual de Campinas, Campinas, São Paulo.
Correia, R. T. P.; Biscontini, T. M. B. (2003), Influência da dessalga e cozimento sobre a composição química e perfil de ácidos graxos de charque e jerked beef, Ciênc. Tecnol. Aliment. 23, 38-42.
Descalzo, A. M.; Insani, E. M.; Biolatto, E.; Sancho, A. M.; García, P. T.; Pensel, N. A. Josifovich. J. A. (2005). Infuence of pasture or grain-based diets supplemented with vitamin E on antioxidant/oxidative balance of Argentine beef. Meat Sci. 70, 35-44.
Grau, A.; Guardiola, F.; Grimpa, S.; Barroeta, A. C. and Codony, R. (2001) Oxidative stability of dark chicken meat through frozen storage: Influence of dietary fat and alpha-tocopherol and ascorbic acid suplementation. Poultry Sci. 80, 1630-1642.
Houben, J. H.; van Cijk, A.; Eikelemboom, G. and Hoving-Bolink, A. H. (2000) Effect of dietary vitamin E supplementation, fat level and packaging on colour stability and lipid oxidation in minced beef. Meat Sci., 55, 331-336.
Inhamuns, A. J. (2000) Composição de ácidos graxos de peixes de água doce da região amazônica brasileira. Tese de doutorado (Ciências de Alimentos) – Faculdade de Engenharia de Alimentos, Universidade Estadual de Campinas, Campinas, São Paulo.
and oxidative stability of pork meat. Meat Sci. 45, 491-500.
Jensen, C.; Lauridsen, C. and Bertelsen, G. (1998) Dietary vitamin E: quality and storage stability of pork and poultry. Trends Food Sci. Technol. 9, 62-72. Katsanidis, E. and Addis, P. B. (1999) Novel HPLC analisys of tocopherols, tocotrienols and cholesterol in tissue. Free Rad. Biol. Med. 27, 1137-1140. Kin, Y. C.; Tyu, Y. C.; Cho, Y. J.; Rhee, R. M. (2006)
Influence of dietary alpha-tocopheryl acetate supplementation on cholesterol oxidation in retail packed chicken meat during refrigerated storage. Biosci. Biotechnol. Biochem. 70, 808-814.
Lichtenstein, A. H.; Ausman, L. M.; Carrasco, W.; Jenner, J. L.; Ordovas, J. M. and Schaefer, E. J. (1994) Hypercholesterolemic effect of dietary-cholesterol in diets enriched in polyunsatured and satured fat-dietary-cholesterol, fat-saturation, and plasma lipids. Arterioscler.Thromb. 14, 168-175. Lira, G. M.; Shimokomaki, M.; Mancini-Filho, J. and
Torres, E. A. F. S. (2000) Avaliação da oxidação lipídica em carne-de-sol. Higiene Alimen. 14, 66–69. Liu, Q.; Larani, M.C. and Schaefer, D. M. (1995) A
review of dietary vitamin-E suplementation for improvimente of beef quality, J.Anim. Sci. 73, 3131-3140.
Liu, Q.; Scheller, K. K.; Arp, S. C.; Schaefer, D. M. and Frigg, M. (1996a) Color coordnates for assessment of dietary vitamin E effects on beef color stability. J. Anim. Sci. 74, 106-116.
Liu, Q.; Scheller, K. K.; Arp, S. C.; Schaeffer, D. M. and Willians, S. N. (1996b) Titrution of fresh meat color stability and malondialdehyde development with Holstein steers fed vitamin-E supplemented diets. J. Anim. Sci. 74, 117-126.
Lynch, A.; Kerry, J. P.; O’sullivan, M. G.; Lawlor, J. B. P.; Buckley, D. J. and Morrissey, P. A. (2000) Distribution of α-tocopherol in beef muscles following dietary α-tocopheryl acetate supplementatiom. Meat Sci. 56, 211-214.
Metcalfe, L. D., Schmits, A. A. Pelka, J. R. (1966) Rapid preparation of fatty caids esters from lipids for gas chromatographic analysis. Anal. Chem. 38, 514-515.
Mitsumoto, M.; Arnold, R.N.; Schaefer, D. M. and Cassens, R.G. (1993) Dietary versus postmortem supplementation of vitamin E on pigment and lipid stability in ground beef. J. Anim. Sci. 71, 1812-1816. Morrissey, P., A.; Sheehy, P. J. A.; Galvin, K.; Kerry, J.
P.; Buckley, D. J. (1998) Lipid stability in meat products Meat Sci. 49, 73-86.
Nutrient Requirements Of Beef Cattle. (1996) Nutrient Requirements of Domestic Animals, National Research Council, Seventh Revised Edition.
Picchi, V. nd Cia, B. (1980) Fabricação do charque. Boletim do Centro de Tecnologia de Carnes ,11–30. Pikul, J.; Leszczynski, D. E. and Kummerow, F. A.
(1989) Evaluation of three modified TBA methods
for measurig lipid oxidation in chicken meat. J. Agricult. Food Chem. 37, 1309-1313.
Raharjo, S.; Sofos, J. N. and Schmidt, G. R. (1992) Improved speed, specificity, and limit of determination of na aqueous acid extraction thiobarbituric acid-C18 method for mesuring lipid peroxidation in beef. Journal Agricult Food Chem. 40, 2182-2185.
Rey, A. I.; Kerry, J. P.; Lynch, P. B.; Lopez-Bote, C. J.; Buckley, D. J. and Morrissey, P. A. (2001) Effect of dietary oils and alpha-tocopherol acetate supplementation on lipid (TBARS) and cholesterol oxidation in cooked pork. J.Anim. Sci. 79, 1201-1208.
Salih, A. M.; Smith, D. M.; Price, J. F. and Dawson, L. E. (1987) Modified extraction 2-thiobarbituric acid method for measuring lipid oxidation in poultry. Poultry Sci., 66, 1483-148.
Seideman, S. C.; Cross, H. R.; Smith, G. C. and Durland, P. R. (1985) Factors associated with fresh meat color: A review. J.Food Quality 6, 211-237. Strásnky, K.; Jursík, T. and Vitek, A. (1997) Standard
equivalent chain lenght values of monoenic and polyenic (methylene interrupted) fatty acids. J. High Resol. Chromatogr. 20, 143-158.
Thompson, R. H. A (1996) simplified faty acid analyses in multicomponent foods with a standard set of isotherma GLC conditions coupled with ECL determinations. J. Chromatogr. Sci. 34, 495-504. Torres, E. A. F. S.; Shimokomaki, M.; Franco, B. D. G.
M. and Landgraf, M. (1994) Parameters determining the quality of charqui, an intermediate moisture meat product. Meat Sci. 38, 229–234.
Torres, E.; Pearson, A. M.; Gray, J. I.; Ku. P. K. and Shimokomaki, M. (1989) Lipid oxidation in charqui (salted and dried beef). Food Chem. 32, 257-268. Tarlargis, B. G.; Watts, B. M.; Younathan, M. T. and
Dugan, L. Jr. (1960) A destillation method for the quantitative determination of malonaldehyde en rancid foods. J. Am. Oil Chem. Soc. 37, 44-48. Youssef, E. Y.; Garcia, C. E. R.; Shimokomaki, S.
(2003), Effect of Salt on Color and Warmed over Flavor in Charqui Meat Processing Braz. Arch. Biol. Technol., 46, 595-600.
Walshe, B. E.; Sheehan, E. M. Delahunty, C. M. Morrissey, P. A. Kerry, J. P. (2006) Composition, sensory and shelf life stability analyses of Longissimus dorsi muscle from steers reared under organic and conventional production systems. Meat Sci. 73, 319-325.
Witte, V. C.; Krause, G. F. and Bailey, M. E. (1970) A new extraction method for determining 2-thiobarbituric acid values of pork and beef during storage. J. Food Sci. 35, 582-585.