1
Original Article
Lipidic Profile of Individuals without Cardiopathy
with Overweight and Obesity
Fernando Araújo, Alice T. Yamada, Marinalva V. M. Araújo, Maria do Rosário D. O. Latorre,
Alfredo J. Mansur
São Paulo, SP - Brazil
Instituto do Coração of Hospital das Clínicas - FMUSP
Mailing address: Fernando Araújo - InCor - Av. Dr. Enéas de Carvalho Aguiar, 44 - Cep 05403-000 - São Paulo, SP - Brazil
E-mail: [email protected] Sent for publishing on 09/05/2004 Accepted on 12/16/2004
Objective
To assess the lipidic profile of overweight and obese individuals submitted to cardiologic assessment and who did not show evi-dences of cardiopathy.
Methods
Sample with 684 individuals, 389 (56.9%) women and 295 (43.1%) men, with age ranging from 14 to 74 (average of 40.6) years old, without evidences of cardiopathy after clinical assessment and analysis of electrocardiogram, thorax radiography, ergometric test on treadmill and two-dimensional Doppler echocardiogram. The serum profile of lipids and glucose regarding sex and ranges of body mass index (BMI) - eutrophic up to 24.9 Kg/m2, overweight
25-29.9 Kg/m2 and obese > 30 Kg/m2, was studied.
Results
The following means showed a significant statistic difference between the sexes: glucose (mg/dL) in women 90.21±23.13 and men 95.28±28.64 (p<0.001); triglycerides (mg/dL) in women 97.27±55.24 and men 141.47±57.06 (p<0.001) and HDL-C (mg/dL) in women 52.63±13.92 and men 43±10.88 (p<0.001). The average BMI in women was 26.15 and in men 26.33 (p=ns). In the analysis through BMI ranges there was a significant difference between the sexes (p=0.037). In the categories of overweight and obesity, only the means of triglycerides in women showed a significant statistic difference: overweight women with 102.25±60.68 mg/dL and obese 121.64±63.57 mg/dL (p=0.034).
Conclusion
Women without cardiopathy showed serum levels of glucose, triglycerides and HDL-cholesterol lower than men’s. In both sexes, the means are lower in the comparison with eutrophic and weight, and only the triglycerides average of women with over-weight and obesity showed significant statistic difference.
Key words
lipids, obesity, overweight, epidemiology, body mass index
The excess of weight and dyslipidemia increase the risk of atherosclerotic cardiovascular disease1,2, which represent and
im-portant cause of morbidity and mortality in Brazil3. Interventions
to maintain a healthy weight and normal values of lipids are part of prevention measures for the prevention of cardiovascular disea-ses, also in individuals without cardiopathy evidences4.
The concept of excess of weight includes individuals with overweight (body mass index from 25 to 29.9 kg/m2) and obesity
(body mass index ≥ 30 kg/m2); it is acknowledged the correlation
between the increases of body mass index with the increase of risk of cardiovascular diseases5,6.
The association between excess of weight and dyslipidemia was verified in different studies1. In individuals with overweight
and obesity, we frequently find little to moderate increases in the serum levels of triglycerides, lower serum levels of HDL-choleste-rol; however, the serum levels of LDL-cholesterol may or may not be increased7.
The population studies that identified the association between excess of weight and dyslipidemia were based on atherosclerotic disease carriers8-11. That association was less studied in individuals
with those risk factors, but without cardiopathy, and that frequently seek cardiologic medical assistance with preventive objectives or health examination.
There are many mechanisms by which the weight increase contributes for the increase of incidence of cardiovascular diseases. Among those we can mention the changes in the metabolism of glucose and lipids12-14.We formulated the hypothesis that the serum
rates of glucose and lipids differ among the individuals without cardiopathy classified as under overweight and obesity condition. We carried out this study to compare the serum rates of glucose and lipids in asymptomatic individuals without evidence of cardio-pathy, regarding the body mass index, categorized as eutrophic, overweight and obesity conditions.
Methods
2
Asymptomatic individuals eligible for the protocol, in accor-dance to the criteria of inclusion and exclusion described below, were invited to participate in the protocol, and those who agreed, signed a free and clarified consent term.
The inclusion criteria were as follows: a) individuals from both sexes, of any race and with age ≥ 14 years old, asymptomatic and without previous cardiopathy; b) regular general and special physi-cal examinations performed by a physician; c) regular electrocar-diogram; d) thorax radiography with normal cardiac area and pleuro-pulmonary fields. The exclusion criteria were: a) previous or current history of cardiovascular disease or cardiologic symptoms; b) ante-cedents of: systemic hypertension, diabetes mellitus, Chagas’ di-sease, hyperthyroidism, hypothyroidism, chronic obstructive pul-monary disease, asthma, renal insufficiency, chronic inflammatory diseases, anemia, neoplasias and osteo-articular diseases, as those affections can unleash cardiopathies or make impossible the correct cardiologic assessment; c) laboratory exams compatible with diabetes mellitus, tireopathies, anemia, Chagas’ disease and renal insuffi-ciency; d) ergometric test compatible with myocardial ischemia or hypertensive behavior of blood pressure; e) two-dimensional Doppler echocardiogram with dilatation of cardiac chambers, systolic or diastolic dysfunctions and valvopathies.
Six hundred and eighty-four individuals were studied, 389 (56.9%) women and 295 (43.1%) men, with ages varying from 14 to 74 (average of 40.6) years old. The average age of women was 40.85±11.61 years old and men’s was 40.29±11.37 years old. The ethnic distribution was: 516 (75%) whites, 117 (17.1%) mulattos, 32 (4.7%) far eastern individuals and 22 (3.2%) blacks. The correlations of serum levels of glucose, triglycerides, to-tal cholesterol toto-tal, HDL-cholesterol, LDL-cholesterol, Vlesterol, total cholesterol /HDL-cholesterol relation and LDL-cho-lesterol/HDL-cholesterol relation with the body mass index of women and men were studied, and categorized as follows:
≤ 24.9 Kg/m2 eutrophic individual, 25 to 29.9 Kg/m2 overweight
individual and > 30 Kg/m2 obese individual.
The descriptive analysis was carried out through percentages, means, standard deviations and minimum and maximum values. The normality of distributions was assessed through the test of Komolgorov-Smirnov. The comparison of the means of body mass indexes, of smokers and non-smokers, according to the sex, was done by the test of Mann-Whitney. The comparison of the means of laboratory variables (glucose and lipids) regarding sex and the body mass index were done through the test of Tukey Honest Significant Differences (Tukey-HSD). Significant values of p < 5% were considered. The statistic program SPSS for Windows (version 10.0) was used.
The project was approved by the Ethics Commission for Analysis of Projects of the Hospital. All participants signed a free and clarified consent term.
Results
One hundred and sixty participants (23.4%) were smokers and 524 (76.6%) non-smokers. The body mass indexes of women and men did not differ significantly regarding smoking (tab. I).
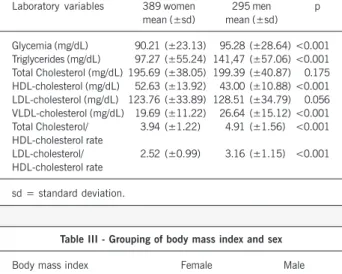
The means of total cholesterol and LDL-cholesterol did not differ significantly as for the sex, but the means of the total
cho-lesterol /HDL-chocho-lesterol rate and LDL-chocho-lesterol/HDL-chocho-lesterol rate showed a significant statistic difference between the sexes. The distribution of other sex-related variables are on table II.
The average of body mass index of women (average of 26.15± 4.72) Kg/m2 and men’s (average of 26.33±4.04) Kg/m2 did not
show statistically significant difference. For the following out of the analysis 9 women with body mass index lower than 18.5 kg/m2, and
who did not show evidences of clinical abnormality, were gathered with eutrophic individuals (BMI up to 24.9 kg/m2). The distribution
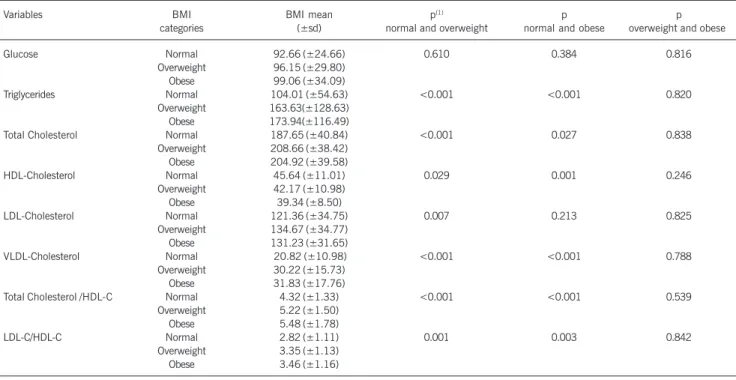
of participants of the casuistry regarding sex and the categories of body mass index showed a difference (p=0.037) (tab. III).
We analyzed the glycemia and serum lipids rate regarding the categories of body mass index (eutrophy, overweight, obesity) and concerning sex (women on table IV and men on table V).
The means of glucose showed statistically significant differences among eutrophic women and those with overweight and obesity; there was no significant statistic difference among men. Lipidic values showed statistically significant difference both in eutrophic women and men, comparing with the overweight and obese. In the comparative analysis between the group with overweight and obesity only among women, the means of triglycerides showed significant statistic difference.
Table I - Comparison of means of the body mass index (BMI) per sex and smoking
Sex Non-Smokers Smokers p(1)
n n
(mean of BMI±sd) (mean of BMI±sd)
Female 304 85 0.362
(26.31 Kg/m2±4.94) (25.55 Kg/m2±3.81)
Male 220 75 0.093
(26.53 Kg/m2±4.13) (25.74 Kg/m2±3.74)
(1) - Test of Mann-Whitney; sd = standard deviation.
Table II - Descriptive statistics of laboratory variables according to sex
Laboratory variables 389 women 295 men p mean (±sd) mean (±sd)
Glycemia (mg/dL) 90.21 (±23.13) 95.28 (±28.64) <0.001 Triglycerides (mg/dL) 97.27 (±55.24) 141,47 (±57.06) <0.001 Total Cholesterol (mg/dL) 195.69 (±38.05) 199.39 (±40.87) 0.175 HDL-cholesterol (mg/dL) 52.63 (±13.92) 43.00 (±10.88) <0.001 LDL-cholesterol (mg/dL) 123.76 (±33.89) 128.51 (±34.79) 0.056 VLDL-cholesterol (mg/dL) 19.69 (±11.22) 26.64 (±15.12) <0.001 Total Cholesterol/ 3.94 (±1.22) 4.91 (±1.56) <0.001 HDL-cholesterol rate
LDL-cholesterol/ 2.52 (±0.99) 3.16 (±1.15) <0.001 HDL-cholesterol rate
sd = standard deviation.
Table III - Grouping of body mass index and sex
Body mass index Female Male
n (%) n (%)
Up to 24.9 Kg/m2 183 (47.0) 117 (39.8)
25 - 29.9 Kg/m2 130 (33.6) 128 (43.2)
Higher or equal to 30 Kg/m2 076 (19.4) 050 (17.0)
Total 389 (56.8) 295 (43.2)
3
Lipidic Profile of Individuals without Cardiopathy with Overweight and Obesity
Discussion
The sample consisted of 56.1% of individuals with excess of weight (BMI ≥ 25Kg/m2), from which 60.2% were men and 43%
were women. In a study of prevalence of individuals with overweight and obesity in the northeast and southeast regions in Brazil15,
with average age of 29 years and 5 months old, the overweight prevalence was 30% for men and 26.6% for women, and the obesity prevalence was 6.7% for men and 12.7% for women. Our
study showed a greater prevalence of obesity and overweight, probably due to a higher average age of individuals involved in the study (40.6 years old). For 2005, the forecast is 57.5% of men and 44.9% of women with some level of overweight or obesity16.
Our results already suggest that growing increase of individual with excess of weight.
In the analysis of obesity (BMI ≥ 30Kg/m2), we verified a
greater percentage of women (17% of men and 19.4% of women). In the study by Gigante et al.17, the obesity prevalence was 21%,
Table IV - Comparison of means of glucose and lipids with body mass index (BMI in Kg/m2) of female sex
Variables BMI BMI mean p(1) p p
categories (±sd) normal and overweight normal and obese overweight and obese
Glucose Normal 85.73 (±8.47) 0.040 <0.001 0.182
Overweight 92.07 (±17.38) Obese 97.88 (±44.50)
Triglycerides Normal 84.11 (±42.45) 0.009 <0.001 0.034
Overweight 102.25 (±60.68) Obese 121.64 (±63.57)
Total Cholesterol Normal 189.68 (±36.60) 0.006 0.217 0.677
Overweight 202.91 (±39.84) Obese 198.31 (±36.33)
HDL-Cholesterol Normal 55.79 (±14.05) 0.014 <0.001 0.069
Overweight 51.43 (±13.11) Obese 47.08 (±13.15)
LDL-Cholesterol Normal 116.63 (±32.23) <0.001 0.031 0.769
Overweight 131.50 (±35.46) Obese 128.16 (±31.84)
VLDL-Cholesterol Normal 17.71 (±10.57) 0.179 <0.001 0.022
Overweight 19.96 (±10.66) Obese 24.20 (±12.48)
Total Cholesterol /HDL-C Normal 3.57 (±1.02) <0.001 <0.001 0.171 Overweight 4.17 (±1.29)
Obese 4.47 (±1.29)
LDL-C/HDL-C Normal 2.23 (±0.89) <0.001 <0.001 0.316
Overweight 2.71 (±0.99) Obese 2.91 (±1.03)
sd = standard deviation; (1) Tukey-HSD test.
Table V - Comparison of means of glucose and lipids with body mass index (BMI in Kg/m2) of male sex
Variables BMI BMI mean p(1) p p
categories (±sd) normal and overweight normal and obese overweight and obese
Glucose Normal 92.66 (±24.66) 0.610 0.384 0.816
Overweight 96.15 (±29.80) Obese 99.06 (±34.09)
Triglycerides Normal 104.01 (±54.63) <0.001 <0.001 0.820
Overweight 163.63(±128.63) Obese 173.94(±116.49)
Total Cholesterol Normal 187.65 (±40.84) <0.001 0.027 0.838
Overweight 208.66 (±38.42) Obese 204.92 (±39.58)
HDL-Cholesterol Normal 45.64 (±11.01) 0.029 0.001 0.246
Overweight 42.17 (±10.98) Obese 39.34 (±8.50)
LDL-Cholesterol Normal 121.36 (±34.75) 0.007 0.213 0.825
Overweight 134.67 (±34.77) Obese 131.23 (±31.65)
VLDL-Cholesterol Normal 20.82 (±10.98) <0.001 <0.001 0.788 Overweight 30.22 (±15.73)
Obese 31.83 (±17.76)
Total Cholesterol /HDL-C Normal 4.32 (±1.33) <0.001 <0.001 0.539 Overweight 5.22 (±1.50)
Obese 5.48 (±1.78)
LDL-C/HDL-C Normal 2.82 (±1.11) 0.001 0.003 0.842
Overweight 3.35 (±1.13) Obese 3.46 (±1.16)
4
25% among women and 15% among men. In the study by Schieri et al.18, obesity was also more prevalent in women than in men.
Those findings did not differ when the population from the northeast of Brazil was analyzed19. The results from our study reproduce the
tendency of difference regarding the excess of weight between the sexes (p=0,037), with prevalence of women in obesity category and men in overweight category.
When we only analyzed hypercholesterolemia (cholesterolemia
≥ 200 mg/dL) we observed a frequency of 46% from the population in our study, and we did not see significant difference between the sexes. Other studies, with identical value of reference, showed prevalence of hypercholesterolemia of 37%, in employees from a metallurgical industry in São Bernardo do Campo, (SP)20 and 35%
in a study with adults in the city of Cotia21. A study for determining
cholesterol involving 81,262 individuals from other Brazilian cities, besides São Paulo22, showed that 40% of them showed cholesterol
rate over 200 mg/dL, and as in the finding in our study, there was not statistically significant difference between the sexes either.
The values of cholesterolemia presented a significant statistic difference among eutrophic and overweight individuals. Curiously that finding did not occur in the comparison between eutrophic and obese individuals. The study by Souza et al.23, which assessed
the prevalence of dyslipidemia in other region of Brazil, showed a significant statistic difference in the prevalence among individuals with and without overweight. However, the same was not seen in relation to obesity.
Regarding the means of LDL-cholesterol, men and women did not show statistically significant difference (128 and 123 mg/ dL respectively). Curiously, eutrophic men did not show means of LDL-cholesterol with significant statistic difference in relation to the obese ones, but there was difference in the relation of eutrophic with overweight. Obese and overweight individuals did not show statistically different means. The means of LDL-cholesterol among eutrophic and overweight women were different, as well as bet-ween eutrophic and obese. We noted that 44% from the population in the present study showed serum levels of such lipoprotein ≥
130mg/dL, above those recommended by the 3rd Brazilian
Guide-lines on Dyslipidemia1. Studies that used the reference point ³
130mg/dL observed lower prevalences than that found in our study, as the one carried out by Bertolami et al.20 with metal sheet
employees from São Bernardo do Campo (SP), that found 37% of individuals with high levels of LDL-cholesterol, and the study by Cardoso et al.24, in Cotia, observed a prevalence of 34% of that
dyslipidemia. The study by Cercato et al.25 did not show any
asso-ciation among the increase in levels of total cholesterol and LDL-cholesterol and obesity.
We observed in the present casuistry that 14% of women and 19% of men showed levels of HDL-cholesterol ≤ 40 mg/dL. The average values of HDL-cholesterol were higher to women, which
was also noted in other Brazilian studies21,26. The statistically
significant difference between the means of HDL-cholesterol in women and men probably explains the finding of different rates of total cholesterol/HDL-cholesterol and LDL-cholesterol/HDL-cho-lesterol, as the total cholesterol and LDL-cholesterol did not show significant different between the sexes.
The values of triglycerides differed concerning sex (p<0,001), the levels of triglycerides were higher in men. In women, the means of triglycerides differed between eutrophic with overweight and obese. In overweight and obese men a significant difference of the means of serum lipids rates was not seen. Other Brazilian studies also found higher prevalences in the levels of serum trigly-cerides in male individuals27,28. In that casuistry, we observed 6%
of women and 22% of men with levels of triglycerides higher than 150mg/dL, a reference point from which preventive measures must be instituted.
Our results concerning HDL-cholesterol and triglycerides are in accordance to the findings in other studies, which means that with the increment of body mass index there is a discreet to moderate increase of triglycerides and reduction of HDL-choles-terol29-31. However, by comparing individuals with overweight and
obesity, the significant statistic differences only occurred in the serum means of triglycerides in women.
The glucose means differed between the sexes and were higher in men. The prevalence of hyperglycemia in our population was much lower than those reported by Gus et al.32. The fact that
individuals with diagnosis of diabetes mellitus were excluded from the present study would be contributing for the reduction of the prevalence of hyperglycemia in our population in the study.
The casuistry consisted of 684 adult individuals, selected from the clients that the Clinical Unit of General Ambulatory of Instituto do Coração demanded for cardiologic assessment, limiting the stu-dy. A random and thoughtful population sample in the city of São Paulo would need the inclusion of individuals from many regions in the city and in accordance to the representativeness of the popula-tion in that region. However, that informapopula-tion was not possible, which made this type of analysis impossible. Besides, other risk factors, such as familial history of cardiopathy, were not quantified. The body mass index has the limitation of being little descriptive concerning the distribution of muscular adipose tissue of a single patient. The assessment methods of body fat distribution, although efficient, were not sufficiently assessed as indicators of cardiovas-cular risk, and they are not being used in clinical practice7.
5
Lipidic Profile of Individuals without Cardiopathy with Overweight and Obesity
References
1. III Diretrizes Brasileiras sobre Dislipidemias e Diretriz de Prevenção da Ateroscle-rose do Departamento de AteroscleAteroscle-rose da Sociedade Brasileira de Cardiologia. Arq Bras Cardiol 2001;77 (supl.III):1-48.
2. Santos Filho RD, Martinez TLR. Fatores de risco para doença cardiovascular: Ve-lhos e novos fatores de risco, veVe-lhos problemas. Arq Bras Endocrinol Metab 2002;46:212-4.
3. de Lolio CA, Lotufo PA, Lira AC, Zanetta DM, Massad E. Mortality trends due to myocardial ischemia in capital cities of the metropolitan areas of Brazil, 1979-89. Arq Bras Cardiol 1995;64:213-6.
4. Hubert HB, Feinleib M, McNamara PM, Castelli WP. Obesity as an independent risk factor for cardiovascular disease: a 26 year follow-up of participants in the Fra-mingham Heart Study. Circulation 1983; 67: 968-77.
5. Bray GA. Classification and evaluation of the obesities. Med Clin North Am 1989; 73:161-84.
6. Calle EE, Thun MJ, Petrelli JM, Rodriguez C, Heath CW Jr. Body-mass index and mor-tality in a prospective cohort of U.S. adults. N Engl J Med 1999;341:1097-105. 7. Diretrizes para Cardiologistas sobre Excesso de Peso e Doença Cardiovascular.
De-partamentos de Aterosclerose, Cardiologia Clínica e FUNCOR da Sociedade Brasi-leira de cardiologia. Arq Bras Cardiol 2002;78 (supl I):1-14.
8. Berchtold P, Berger M, Jorgens V et al. Cardiovascular risk factors and HDL-cho-lesterol levels in obesity. Int J Obes 1981;5:1-10.
9. Fisberg RM, Stella RH, Morimoto JM, Pasquali LS, Philippi ST, Latorre MRDO. Li-pid profile of nutrition students and its association with cardiovascular disease risk factors. Arq Bras Cardiol 2001;76:137-47.
10. Abbasi F, Brown BW Jr, Lamendola C, McLaughlin T, Reaven GM. Relationship between obesity, insulin resistance, and coronary heart disease risk. J Am Coll Cardiol 2002; 40: 937-43.
11. Murtaugh KH, Borde-Perry WC, Campbell KL, Gidding SS, Falkner B. Obesity, smo-king, and multiple cardiovascular risk factors in young adult African Americans. Ethn Dis 2002;12:331-5.
12. Van Itallie TB. Obesity: adverse effects on health and longevity. Am J Clin Nutr 1979; 32:2723-33.
13. Krauss RM, Winston M, Fletcher BJ, Grundy SM. Obesity: impact on cardiovascu-lar disease Circulation 1998;98:1472-6.
14. Eckel RH, Barouch WW, Ershow AG. Report of the National Heart, Lung, and Blood Institute-National Institute of Diabetes and Digestive and Kidney Diseases Working Group on the pathophysiology of obesity-associated cardiovascular di-sease. Circulation 2002; 105:2923-8.
15. Abrantes MM, Lamounier JA, Colosimo EA. Overweight and obesity prevalence in Northeast and Southeast Regions of Brazil. Rev Assoc Med Bras 2003;49:162-6. 16. Conde WL, Levy-Costa RL, Monteiro CA. Quantas pessoas têm excesso de peso? Estudos epidemiológicos em obesidade no Brasil. In: HALPERN, A.; MANCINI, M.C. (org). Manual de obesidade para o clínico. São Paulo: Ed. Roca, 2002.
17. Gigante D, Barros F, Post C, Olinto M. Prevalência de obesidade em adultos e seus fatores de risco. Rev Saúde Pública 1997;31:236-46.
18. Sichieri R, Coitinho DC, Leão MM, Recine E, Everhart JE. High temporal, geogra-phic, and income variation in body mass index among adults in Brazil. Am J Pub-lic Health 1994; 84:793-8.
19. Monteiro CA, Conde W. A tendência secular da obesidade segundo estratos so-ciais: Nordeste e Sudeste do Brasil, 1975-1989-1997. Arq Bras Endocrinol Metab 1999; 43:186-94.
20. Bertolami MC, Faludi AA, Latorre Mdo R, Zaidan Filho T. Lipid profile of metallur-gic industry employees and its relationship with other risk factors. Arq Bras Cardiol 1993; 60:293-9.
21. Fornes NS, Martins IS, Hernan M, Velasquez-Melendez G, Ascherio A. Frequency of food consumption and lipoprotein serum levels in the population of an urban area, Brazil. Rev Saude Publica 2000;34:380-7.
22. Martinez TLR, Santos RD, Armaganijan D et al. National alert campaign about in-creased cholesterol: determination of cholesterol levels in 81,262 Brazilians. Arq Bras Cardiol 2003;80:635-8.
23. Souza LJ, Souto Filho JT, de Souza TF et al. Prevalence of dyslipidemia and risk factors in Campos dos Goytacazes, in the Brazilian state of Rio de Janeiro. Arq Bras Cardiol 2003; 81:249-64.
24. Cardoso E, Martins IS, Fornari L, Monachini MC, Mansur Ade P, Caramelli B. Elec-trocardiographic abnormalities and cardiovascular risk factors for ischemic heart disease in an adult population from Sao Paulo, Brazil. Rev Assoc Med Bras 2002;48:231-6.
25. Cercato C, Mancini MC, Arguello AM, Passos VQ, Villares SM, Halpern A. Systemic hypertension, diabetes mellitus, and dyslipidemia in relation to body mass index: evaluation of a Brazilian population. Rev Hosp Clin Fac Med Sao Paulo 2004;59:113-8.
26. Lessa I, Conceicao JL, Souza ML et al. Prevalence of dyslipidemias in adults in la-boratory tests from Salvador, Brazil. Arq Bras Cardiol 1997;69:395-400. 27. Guedes DP, Guedes JE. Body fat distribution, blood pressure and plasma lipids and
lipoprotein levels. Arq Bras Cardiol 1998;70:93-8.
28. Rabelo LM, Viana RM, Schimith MA et al. Risk factors for atherosclerosis in stu-dents of a private university in São Paulo-Brazil. Arq Bras Cardiol 1999;72:569-80. 29. Katzel LI, Krauss RM, Goldberg AP. Relations of plasma TG and HDL-C concentra-tions to body composition and plasma insulin levels are altered in men with small LDL particles. Arterioscler Thromb Vasc Biol 1994; 14:1121-8.
30. Grundy SM. Hypertriglyceridemia, atherogenic dyslipidemia, and the metabolic syn-drome. Am J Cardiol 1998;81 (suppl): 18B-25B.