ARTIGO ORIGINAL
Disease: From Clinical Epidemiology to Pathophysiology
A Homeostase Fosfo-Cálcica na Doença Renal Crónica:
Da Epidemiologia Clínica à Fisiopatologia
1. Serviço de Nefrologia. Hospital Fernando da Fonseca. Amadora. Portugal.
2. Departamento de Endocrinologia-Nutrição. Faculdade de Ciências Médicas. Universidade NOVA de Lisboa. Lisboa. Portugal. 3. Laboratório de Fisiologia. Instituto de Ciências Biomédicas Abel Salazar. Universidade do Porto. Porto. Portugal.
Autor correspondente: Ana Pires. ana.l.mariquitos@gmail.com
Recebido: 15 de julho de 2016 - Aceite: 11 de abril de 2017 | Copyright © Ordem dos Médicos 2017
Ana PIRES1, Luís SOBRINHO2, Hugo Gil FERREIRA3
Acta Med Port 2017 Jun;30(6):485-492 ▪ https://doi.org/10.20344/amp.8040
RESUMO
Introdução: O propósito do presente trabalho consistiu em descrever alguns dos mecanismos fisiopatológicos envolvidos nas
per-turbações do metabolismo fosfo-cálcico na doença renal crónica a partir de um processo simples de filtragem de dados e de alguns conceitos básicos de teoria de sistemas.
Material e Métodos: Foram estudados os valores (um conjunto por doente, obtido numa única colheita de sangue) de creatinina,
cál-cio, fósforo, paratormona, 25-hidroxivitamina D e 1,25-dihidroxivitamina D num grupo de 2507 doentes com doença renal crónica não sujeitos a substituição renal. As variáveis foram emparelhadas e tratadas, primeiro por um processo de média deslizante e depois por distribuição por classes de frequência. Os resultados obtidos foram interpretados à luz do conceito de ansa de retro-controlo contendo dois ramos de sinais opostos cuja intersecção define o ‘ponto operacional’ do sistema. Este ponto desloca-se ao longo da evolução da doença e o sentido do deslocamento indica qual dos dois fatores (a calcémia ou a concentração de paratormona, por exemplo) está a afetar primariamente o sistema.
Resultados: Esta análise mostrou que a evolução das relações entre as variáveis observadas seguiu um padrão monótono, bifásico
ou trifásico.
Discussão: À medida que a doença renal crónica progride ocorrem alterações na regulação do metabolismo fosfo-cálcico, passando
por diferentes fases. Numa fase mais avançada há uma perda do controlo das glândulas paratiróides pela calcémia e pela fosfatémia. A sensibilidade à ação inibitória da 1,25-dihidroxivitamina D diminui progressivamente mas nunca desaparece.
Conclusão: A metodologia utilizada na análise de uma base de dados clínicos permitiu ilustrar mecanismos fisiopatológicos
subja-centes.
Palavras-chave: Cálcio; Fósforo; Hiperparatiroidismo; Homeostase; Insuficiência Renal Crónica
ABSTRACT
Introduction: A simple data filtering process together with some basic concepts of control theory applied to electronically stored
clinical data were used to identify some of the pathophysiological mechanisms underlying the perturbations of the calcium/phosphorus homeostasis in chronic kidney disease.
Material and Methods: Retrospective data (a set per patient of serum single value concentrations of creatinine, calcium, phosphorus,
parathormone, 25-hydroxyvitamin D and 1,25-dihydroxyvitamin D) from 2507 patients with stable chronic kidney disease not on renal replacement therapy were studied. The variables were paired and subjected sequentially to a moving average and partioned into frequency classes. The plots were interpreted using the concept of a feedback loop comprising two branches of opposite sign and of set point of the loop. The set point for each pair of variables is displaced in the course of the disease and this displacement indicates which of the two factors involved (the serum concentrations of calcium or parathormone, for example) is primarily affected.
Results: This analysis showed that in the course of the development of chronic kidney disease the relationships between the observed
variables progressed following a monotonous, a biphasic or a triphasic pattern.
Discussion: As chronic kidney disease progresses, calcium/phosphorus metabolism regulation evolves through different phases. Later,
there is a progressive loss of the parathyroid gland sensitivity to the control by the serum concentrations of calcium and phosphorus. The sensitivity to the inhibitory action of 1,25-dihydroxyvitamin D decreases monotonously but never releases the gland.
Conclusion: The clinical data analysis used permits to illustrate the underlying pathophysiological mechanisms. Keywords: Calcium; Homeostasis; Hyperparathyroidism; Kidney Failure, Chronic; Phosphorus
INTRODUCTION
The conceptual basis of present day medical practice is largely grounded on the findings of molecular biology and on statistical guidelines (evidence based medicine) regularly produced by a large number of respected scientific and professional bodies, guidelines that the clinicians cannot ignore.
This evolution entailed a progressive loss of interest in the application of a pathophysiological approach in a clinical environment and the progressive disappearance of
the departments of physiology in European and American medical schools. Yet, confronted with a patient, only the knowledge - not necessarily profound - of the underlying disease mechanisms, will enable the definition of the reality boundaries of his/her condition, essential if one wants to avoid big mistakes.
ARTIGO ORIGINAL
quantitative approach based on simple concepts of control theory to unveil the physiopathology subjacent to clinical situations.
We chose as a case study the disturbances in the calcium (Ca) and phosphorus (P) metabolism that take place in chronic kidney disease (CKD).
MATERIAL AND METHODS Study population
This study was conducted in the Nephrology departments of three general hospitals in the Lisbon district (Santa Cruz, São Bernardo and Fernando Fonseca). It allowed us to analyse data regarding the CKD population followed as outpatients, and was an expansion of a previously published
study1 which was continued through the period between the
years 2008 and 2011.
The data were gathered retrospectively from electronic records that included demographic information on age, gender and race, pharmacy dispensations on medication with vitamin D (calcitriol or paricalcitol) and phosphorus binders (calcium carbonate, sevelamer carbonate and/or aluminium hydroxide), and laboratory evaluation of serum
calcium ([Ca]S), phosphorus ([P]S), creatinine ([creatinine]S),
parathyroid hormone ([PTH]S), 25-hydroxyvitamin D
([25(OH)D]S) and 1,25-dihydroxyvitaminD ([1,25(OH)2D]S).
Exclusion criteria comprised patients: 1) with a unstable renal function during the previous 6 months defined as the variation of serum creatinine of more than 0.5 mg/dl; 2) on vitamin D therapy; 3) on dialysis or submitted to a renal transplant; 4) with glomerular filtrations rates less than 15
ml/min per 1.73 m2 and above 160 ml/min per 1.73 m2; 5)
with serum concentrations of intact PTH less than 10 pg/ml. The present study was approved by the ethical committees of the hospitals where it took place.
Laboratory evaluation
Fasting serum samples were collected during a routine follow-up outpatient visit. For each patient all variables studied were measured in the same blood sample.
Serum creatinine, calcium and phosphorus were measured using standardized autoanalyser techniques.
Serum intact parathyroid hormone concentration was determined by chemiluminescent immunometric assay with two systems: Immulite 2000 Intact PTH from Diagnostic Products Corporation, Los Angeles, Calif., USA and by Elecsys Systems and Modular Analytics E170 from Roche
Diagnostic, GmbH, Mannheim, Germany. [25(OH)D]S
and [1,25(OH)2D]S were measured by radioimmunoassay
either with Biosource Europe, SA, Nivelles, Belgium or Immunodiagnostic Systems, Ltd., United Kingdom. The estimated glomerular filtration rate (eGFR) was calculated using the abbreviated Modification of Diet in
Renal Disease Study (MDRD) formula2 as follows: eGFR
(in milliliters per minute per 1.73 m2) = 186.3 X [serum
creatinine]-1.154 X age-0.203 X [0.742 if a woman] X [1.21 if
black]
Since data on race were available for only 51% of the patients, we decided not to include it in the estimation of GFR. This missing value had the effect of underestimating eGFR by 21% for the black race. However, in the available data, about 3% of our patients were black, so the overall effect was small.
Principles of the analysis
Regulated and regulatory variables. The setpoint. Serum ionic calcium participates, as an activator, in a large variety of very important metabolic processes such as bone formation and remodeling, coagulation, synaptic transmission, excitation/contraction and excitation/ secretion, in general with an affinity for this ion below the micromolar range. Its survival value might explain why its concentration in serum is so tightly regulated.
Physiological regulation can be analyzed in terms of feedback loops. In the case of calcium homeostasis the most important operate through the control of PTH secretion
which involve the state variables: [Ca]S, [P]S, [PTH]S,
[1,25(OH)2D]S and fibroblast growth factor 23 (FGF23).
3
Parathormone production is inhibited by [Ca]S,
[1,25(OH)2VD]S and [FGF23]S through the action on its
parathyroid glands receptors, respectively CaR, VDR and
FGFR coupled to klotho.4 [P]
S stimulates PTH production
through an extracellular putative receptor not yet identified.5
O O
O O
O
Figure 1 – Schematic representation of variations of [PTH]S as a function of [Ca]S and of [Ca]S as a function of [PTH]S. The intersection of
both lines defines the set point of the system (A). The set point moves from position 1 to position 2 when [PTH]S is the driving variable as in primary hyperparathyroidism (B) or in hypocalcemia, when [Ca]S is the driving variable (C).
200 200 200
150 150 150
100 100 100
50 50 50
0 0 0
6 8 10 12 6 8 10 6 8 10
PTH curve
Ca
curve
SP 1
2
1 2
12 12
14 14 14
[PTH]
S
(pg/mL)
[Ca]S (mg/dL)
ARTIGO ORIGINAL
On the other hand, PTH leads to [P]S decrease by promoting
its kidney excretion and increases [Ca]S, [1,25(OH)2VD]S
and [FGF23]S, stimulating Ca bone and renal resorption,
1,25(OH)2VD renal production and FGF23 bone production.
6 As an example, the Ca/PTH loop comprises two
branches: one branch is the hypercalcemic action of PTH7
and the other is the inhibitory action of Ca on the secretion
of PTH.8 Each of these actions can be represented by a line
on a plot of [Ca]sversus [PTH]S. At any particular moment
the concentrations of the two factors must satisfy both
curves, defining the so called setpoint(SP)(Fig. 1A). The
concept of SP imported from control system theory9 was
first introduced in medicine by Guyton in the analysis of the
cardiac output.10
To any pathological situation entailing a sustained
displacement of [Ca]S from its normal value will correspond
a displacement of the SPeither along the line describing
a primary change in [PTH]S, (primary hyperparathyroidism,
positive slope line in Fig. 1B) or along the negative slope
line reflecting a primary change in [Ca]S (Fig. 1C) or a
combination of both. These figures should be seen as representing ‘thought experiments’, since in real situations one should expect the involvement of the other loops
participating in the calcium homeostasis. [Ca]S is regulated
even in disease situations.1 In any case the primary
participation of Ca or PTH is revealed by the polarity of the slope of the Ca/PTH plot.
In a clinical environment this analysis cannot be applied to a single patient. We propose instead to use it in the characterization of the different phases of the evolution of the perturbations in Ca/P metabolism resulting from
chronic renal failure. If we measure [Ca]S and [PTH]S in the
same blood sample these two quantities will define the SP of the metabolic state of the patient. If we perform these measurements in a large number of patients it is reasonable to assume that the further away the SP is from its normal value the more advanced the disease and, in average, the ‘older’ it is. If so, the trajectory of the SP (following a positive or negative slope) will indicate if it is driven by primary
alterations of [Ca]S or of [PTH]S (Fig. 1).
Trend extraction from the raw data
The method used in processing our data was previously
reported.1 We showed above that the slope of the
displacement of the SP provides an indication of which of two variables studied is driving the metabolic process. To analyze the relations between different pairs of variables measured in the same blood sample, tables have to be constructed. It is, then, important to address the question of how to extract the signal (the slope of their relationship) from the noise present in the raw data. There are two main sources of noise. Firstly, that due to the effects of medications the patient may be taking, of the diet or mood, pulsatility, variability in the laboratory assays, etc.. In sufficiently large populations it is hoped that this noise, unrelated to the signal, can be partially filtered by conventional statistical methods such as smoothing or moving average. The data is first sorted by the
independent variable ([PTH]S in the example presented in
Fig. 2). The first n values of the dependent variable (say, 5)
are averaged and the 3rd value is replaced by this average.
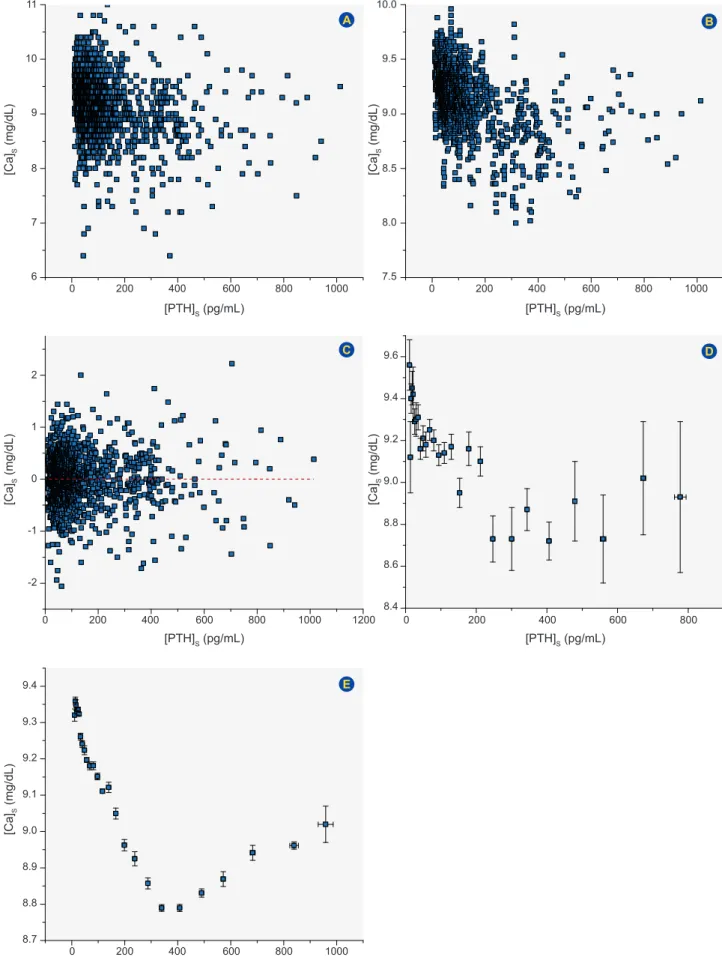
Then sample 2 to 6 are averaged and sample 4 is replaced by this average. The procedure is applied to the whole set of data. The random effects are likely to be distributed above and below the average and, at least in part, they will cancel out each other. Fig. 2, panel A, represents a plot of the raw data obtained from a population of 2507 patients. Panel B reports the same data subjected to a smoothing with a window of 11 consecutive samples while panel C shows the extracted noise obtained by subtracting B from A. There is a considerable reduction of the noise in B making now apparent the emergence of two noisy trends with opposite slopes. As expected, the noise displayed in C is distributed around an average of zero. The moving average technique
is conventionally used to detect trends.11
Another source of noise is the variability to be expected of the setting point between individuals. This is one of the sources of dispersion when one tries to define ‘normal’ values for a variable. It can also be partially filtered out by partitioning the results into classes of frequency.
In this procedure the data sorted as above is binned and the population of each bin is replaced by its mean and standard error of the mean (SEM). Panel D of Fig. 2 reports the application of this procedure directly to the data of panel A and shows already the underlying trends of the evolution of the disease. In panel E we plot the data treated first by
smoothing (panel B) and then by the binning procedure1.
When the raw data were plotted representing the
relationship between [Ca]S and [PTH]S as shown in Fig. 2A
no clear pattern of association between the two variables appeared. When the data were binned directly two trends emerged but with very large SEMs.
After sequentially smoothing and binning the data as described above it became possible to observe the relations
between [Ca]S and [PTH]S (Fig.s 2E, 3F) and, similarly, for
all the pairs of variables as represented in Fig. 3.
RESULTS
Participant characteristics
The demographic, clinical and laboratory characteristics of the population are described in Table 1. Patients were between 16 and 96 years old and had a mean eGFR of
56.8 ± 34.3 ml/min per 1.73m2, varying from 15.03 to 159.4
ml/min per 1.73 m2. The primary renal diseases were:
diabetes (11%), tubulointerstitial disease (7.3%), chronic glomerulonephritis (5.6%), hypertension (12.8%), cystic kidney disease (2.2%), miscellaneous (5.7%) and unknown or missing (55.4%).
Functional relationships between the state variables Some of the relationships between the state variables
(eGFR, [Ca]S, [P]S, [PTH]S, [25(OH)D]S and [1,25(OH)2D]S)
ARTIGO ORIGINAL
Figure 2 – The filtering of the data. A: Raw data. B: Data filtered by moving average. C: Noise filtered out by moving average. D: Data filtered by the binning procedure applied directly to the raw data. E: Data obtained by applying in succession the moving average and the binning procedure to the raw data.
A
C
E
B
D
[Ca]
S
(mg/dL)
[Ca]
S
(mg/dL)
[Ca]
S
(mg/dL)
[Ca]
S
(mg/dL)
[Ca]
S
(mg/dL)
[PTH]S (pg/mL)
[PTH]S (pg/mL)
[PTH]S (pg/mL)
[PTH]S (pg/mL)
[PTH]S (pg/mL)
0
0
0
0
0 200
200
200
200
200 400
400
400
400
400 600
600
600
600
600 800
800
800
800
800 1000
1000
1000 1200
1000 6
-2
8.7 8.8
7.5
8.4 7
-1
8.9
8.0
8.6
8
0
9.0 9.1
8.5
8.8 9
1
9.2 9.3
9.0
9.0 10
2
9.4
9.5
9.4
11 10.0
9.6
ARTIGO ORIGINAL triphasic. This diversity could not have been perceived by
visual inspection of the raw data, as exemplified in Fig. 2, panel A, and the analysis could not have been easily carried out by the use of more conventional statistical methods. The physiologic meaning of some of the associations herein found will be discussed in detail further below.
DISCUSSION
The serum concentration of calcium and the external balance of phosphorus are regulated through the operation of a number of feedback loops, which involve the bone,
the parathyroid glands, the gut and the kidney13-18 and are
thus altered in the course of chronic kidney disease with
the development of secondary hyperparathyroidism.19,20
There is evidence that this is associated with low levels of
[25OHD]S,21,22 impairment in the renal production of
[1,25(OH)2D]S,
23-25 serum calcium decrease26,27 and
phos-phorus retention by the kidney.28,29 More recently it was
reported that FGF23, which is produced in the bone, increases early in CKD and may reach very high levels
in the late stages of kidney disease.30-32 It is known that
FGF23 inhibits kidney 1-alfa hydroxilase, hence inhibiting
[1,25(OH)2D]Sproduction, and promotes kidney phosphorus
excretion.33 As CKD progresses, PTH continued demand is
associated with a parathyroid gland hyperplasia together with a loss of the calcium, vitamin D and FGF23/klotho receptors, rendering the parathyroid glands partially
resistant to the inhibition by those factors.6
As expected, the plots of Fig. 3 indicate that the changes in trends in the course of CKD probably result from the interplay between the production of PTH and its controlling
factors: [Ca]S, [P]S, [1,25(OH)2D]S and also [25(OH)D]S.
In a population of CKD patients in different stages of the disease, one should expect the values of these state variables to be spread but, in average, to follow those relationships. Since these patients were studied in quasi steady state, the concentrations of PTH in serum are a direct reflection of its rate of secretion. As the measurements of
[FGF23]S were unavailable in our study this hormone is a
‘hidden variable’. We will discuss in more detail the most important relationships unveiled by our analysis.
Dependence on GFR
The reduction in eGFR is linearly correlated with a
decrease in [1,25(OH)2D]S (Fig. 3E) (R = 0.97, p = 0.0001),
showing that its production is compromised from the early
stage of the CKD as also reported by others. 28,31,34 This may
be due both to the effect of kidney tubular mass reduction35,
Figure 3 – Correlations between the observed variables. The number of samples for each of the variable pairs is given in each panel. The
linear fitting and computation of correlation coefficients were performed with Origin version 6.1.
p: Probability; R: Coefficient of correlation.
A E I B F J C G K D H L [PTH] S (pg/mL)
GFR (mL/min/1.73 m2)
GFR (mL/min/1.73 m2) [PTH]
S (pg/mL) [PTH]S (pg/mL) [PTH]S (pg/mL)
GFR (mL/min/1.73 m2) GFR (mL/min/1.73 m2) GFR (mL/min/1.73 m2)
[1,25(OH) 2 D]S (pg/mL) [1,25(OH) 2 D]S (pg/mL) [P]S (mg/dL) [P]S (mg/dL) [Ca] S (mg/dL) [25(OH)D] S (ng/mL) [25(OH)D] S (ng/mL) [P]S (mg/dL) [Ca] S (mg/dL) [Ca] S (mg/dL) [1,25(OH) 2 D]S (pg/mL) 400
40 9.2 3.8
25
50
9.4
4.0 30
200
30 9.0 3.6 20
8.8 3.5 20 9.0 4.0 25 9.2 4.5 9.4 0 20
8.8 3.4 15
8.6 3.0 15
0
0 0 0 0
0 0 0
40
40 300 300 300
40 40 40
80
80 600 600 600
80 80 80
120
120 900 900 900
120 120 120
160
160
160 160 160
[PTH]S (pg/mL) [25(OH)D]S (ng/mL) [1,25(OH)2 D]S (pg/mL) [1,25(OH)2 D]S (pg/mL)
40 50 40 9.2 3.8 30 30 9.1 3.4 3.6 20 20 9.0 3.2
0 200 400 600 800 0 20 40 60 0 20 40 60 0 20 40
R 0.98 R -0.98 R -0.96 R 1.0 R 0.94 R -0.95 R -0.95 R -0.82 R 0.98 R 0.81 R
-0.90 0.48R
R 0.945 p < 1.0e-4 p < 1.0e-4 p < 1.0e-4 p < 1.0e-4 p < 1.0e-4 p < 1.0e-4 p < 1.0e-4 p 0.0072 p 3.8e-4 p 0.0087 p
0.036 0.27p
ARTIGO ORIGINAL
and to the increase in serum levels of FGF23 through its
inhibiting action on 1,25(OH)2D production.
33
A decrease in eGFR was accompanied by a monotonous,
non-linear, increase in [PTH]S (Fig. 3A). The increase in
[PTH]S together with the fall in [Ca]Swhich accompanies the
decline in eGFR are conventionally attributed to the fall in
[1,25D(OH)2D]S and to the increase in [P]S (Fig. 3A, 3B, 3C
and 3E).36,37
As opposed to [1,25(OH)2D]S and [PTH]S,the curves
describing the variations of [Ca]S (Fig. 3B) and [P]S with the
eGFR (Fig. 3C) were biphasic, changing the polarity of the slopes at values of eGFR of approximately 50 ml/min per
1.73 m2.
The correlation between the concentrations of [Ca]S and
eGFR (Fig. 3B) is positive (R = 0.98; p < 0.001) for values
of this variable below 50 ml/min per 1.73m2 and negative
(R = -0.82; p = 0.007) above this value, while the correlation
between [P]S and eGFR (Fig. 3C) is negative (R = -0.96; p <
0.001) for values below 50 ml/min per 1.73 m2 and positive
(R = 0.81; p = 0.009) above this value. The reasons for
this behavior are far from clear. From the numerical data it is possible to show that the glomerular loads of both Ca and P fall linearly with eGFR regardless of the trends of their concentrations in the serum. This indicates that the variations with opposite slopes of the two ions cannot be explained by the changes in GFR which would affect both ions in the same direction.
The negative correlation between [Ca]S and eGFR for
values of this variable above 50 ml/min per 1.73 m2 (Fig.
3B) coincides with the observations of Evenepoel et al31
and is, so far, a finding for which we have no explanation. It
cannot be attributed to a change in [1,25(OH)2D]S, since, in
the same range, this hormone is positively correlated with
eGFR (Fig. 3E). The positive correlation between [Ca]S and
eGFR below 50 ml/min per 1.73 m2 occurs while there is
a dramatic rise of [PTH]S with the fall in eGFR. It probably
results, among other factors, from a reduction in the intestinal uptake of that ion due to the positive correlation
between eGFR and [1,25(OH)2D]S(Fig.s 3E, 3K).
The positive correlation between eGFR and [P]S (Fig.
3C) for values of eGFR above 50 ml/min per 1.73 m2, is an
observation previously reported by others30,36 which cannot
be explained by the simultaneous rise in [PTH]S, but may
be due to the early rise in [FGF23]S together with the fall
in [1,25(OH)2,D]S.
37 When eGFR falls below 50 ml/min per
1.73 m2 there is a progressive increase in [P]
S (Fig. 3C), as
also reported by Isakova et al30probably because the fall in
the glomerular load can no longer be compensated by an
increased tubular excretion.1,38
The element [25(OH)D]S is independent of eGFR for
values above 80 ml/min per 1.73 m2 (Fig. 3D) but below
this threshold both variables decline in parallel, as also
reported by Isakova et al.30 This has been attributed to a
poor nutritional state and to underexposure to the sun in chronic patients in combination with vitamin D metabolism disturbance, which includes an impaired endogenous synthesis of vitamin D in the skin and the compromise of
the uptake of 25(OH)D from the glomerular ultrafiltrate for its recycling to the circulation and maintenance of its serum
levels.39 Moreover, FGF23 promotes 25(OH)D catabolism
by stimulation of the 24-hydroxylase.40 The dependence of
[1,25(OH)2D]S on [25(OH)D]S (Fig. 3J) suggests that in CKD
the synthesis of the active vitamin is substrate dependent.41
Dependence on PTH
The panels in which [PTH]S was used as independent
variable (Fig. 3, panels F – G) reveal a biphasic or triphasic
behaviour. [Ca]S (Fig. 3F) is negatively correlated (R = -0.98;
p < 0.001) with PTH for concentrations of this hormone
below 360 pg/ml and positively correlated (R = 0.98; p <
0.001) above this value. This reflects the development of a lower sensitivity to factors controlling PTH production
([Ca]S, [1,25(OH)2D]S, [FGF 23]S) and eventually of tertiary
hyperparathyroidism.42
It was noted that [PTH]S and [P]S show a triphasic
relationship (Fig. 3G). For values of [PTH]S below 630 pg/ml
phosphorus drives the displacement of the set point. As the production of PTH becomes partially or totally autonomous, PTH promotes the excretion of phosphorus (R = -0.96;
p = 0.04) in spite of the reduced tubular mass available to
respond to this physiological mechanism, thus resulting in a
decrease of [P]S. For very low values of [PTH]S, the [PTH]S/
[P]S curve exhibits a unexplained negative slope. A possible
explanation is that for values of eGFR above 80 ml/min per
Table 1 - Characteristics of the subject population
All patients (n = 2507)
Demographics
Age* (years) 64 ± 17 [16 - 96]
Gender (male) (%) 52.3
Race (white/black) (n = 1280) 97/3
Renal Function
Serum creatinine* (mg/dL) 1.8 ± 0.89 [0.6 - 4.8]
eGFR* (mL/min per 1.73 m2) 56.8 ± 34.3 [15.03 - 159.4]
CKD Staging**
Stage 1 (%) 18.4
Stage 2 (%) 16.9
Stage 3 (%) 40.6
Stage 4 (%) 24.1
Phospho-calcium metabolism
Serum calcium* (mg/dL) (n = 2016) 9.1 ± 0.6 [6.4 - 11.7] Serum phosphorus* (mg/dL) (n = 2078) 3.5 ± 0.7 [1,18 - 7.0]
Serum iPTH* (pg/mL) (n = 1576) 134.4 ± 155.8 [10.5 - 2220]
Serum 1,25(OH)2D* (pg/mL) (n = 629) 32.8 ± 15.7 [1.25 - 77.6]
Serum 25(OH)D* (ng/mL) (n = 554) 20.1 ± 15.4 [2.5 - 98.5]
Medication
Non-calcium phosphorus binder (%) 0.1
Calcium supplements (%) 3.1
n: Number of patients
ARTIGO ORIGINAL
1.73 m2 (when [PTH]
S values are the lowest), [P]S is driven
by [PTH]S.43 Alternatively or in addition, an early rise of
FGF23 when [PTH]S has not increased yet (Fig. 3A) might
produce the same effect.44
Another important determinant of [PTH]S is [25(OH)
D]S, the decreased levels of which are common in CKD
patients.45 Fig. 3H shows a clear association between
[25(OH)D]S and [PTH]S for values of this hormone below 150
pg/ml (R = -0.95; p < 0.001), which disappeared at higher
values of [PTH]S probably because the parathyroid cells
become much less sensitive. The stability of [25(OH)D]S
with values of [PTH]S above 150 pg/mL (Fig. 3H) is difficult
to explain since [1,25(OH)2D]S is correlated with [PTH]S
over the range of values measured (Fig. 3I) and [25(OH)D]S
and [1,25(OH)2D]S are almost linearly correlated (Fig. 3J).
This stability may reflect a residual capacity of synthesis/ absorption of vitamin D independent of the progression of the CKD.
It was clear that [PTH]S and [1,25(OH)2D]S are negatively
associated, although with a progressively decreasing slope
as [PTH]S increases (Fig. 3I). This indicates that the inhibitory
branch of the corresponding loop dominates all the way and is explained by the decreasing number of receptors
of 1,25(OH)2D in the parathyroid glands. The effect of the
increase in [PTH]S in the later stages of the CKD is masked
by the progressive loss of the kidney response.
Dependence on 1,25(OH)2D
Items [25(OH)D]S and [1,25(OH)2D]S were positively
associated (Fig. 3J). This plot can be fitted by a Michaelis Menten saturation curve (VM = 41.4 ± 1.2; K = 6.78 ± 0.63)
suggesting that the production of [1,25(OH)2D]S is a function
of the substrate [25(OH)D]S and is not saturated for levels of
[25(OH)D]S up to 40 ng/ml. Also, [1,25(OH)2D]S is negatively
correlated with [P]S (Fig. 3L) (R = 0.95; p < 0.001). This
may be explained in part by the phosphorus inhibition of
1,25(OH)2D production either directly or indirectly through
FGF23.46-49 In studies evaluating CKD stages 1 to 3, it was
found that [1,25(OH)2D]S was independently and positively
associated with [25(OH)D]S, and negatively associated with
[FGF-23]S and [P]S.31,35 The assumption of an early [FGF23]
S
increase is supported by the observation50 that it occurs
as eGFR decreases below 90 ml/min per 1.73 m2 but the
exact mechanisms of increased FGF23 in CKD remains to
be determined.51,52 As well, [1,25(OH)
2D]Sis positively and
linearly correlated with [Ca]S (Fig. 3K) (R = 0.94; p < 0.001).
Finally, [1,25(OH)2D]S (Fig. 3I) is non-linearly negatively
correlated to [PTH]s throughout the whole range.
CONCLUSION
The application of simple methods of data processing (moving average and partioning into frequency classes) to numerical clinical data of the nephrology departments from three general hospitals, allowed the clear cut identification of trends in the behaviour of Ca/P homeostasis in the evolution of CKD.
Using the concept of feedback loop together with our knowledge of the physiological mechanisms in which the observed state variables participate, it was possible to illustrate previously known mechanisms but also to unveil relations so far practically disregarded or even hitherto unknown and unexplained.
PROTECTION OF HUMANS AND ANIMALS
The authors declare that the present study was approved by the ethical committees of the hospitals where it took place and developed according to the Helsinki Declaration of the World Medical Association.
DATA CONFIDENTIALITY
The authors declare having followed the protocols in use at their working center regarding patients’ data publication.
CONFLICTS OF INTEREST
The authors declare that there are no conflicts of interest.
FUNDING SOURCES
No subsidies or grants contributed to this work.
REFERENCES
1. Pires A, Adragao T, Pais MJ, Vinhas J, Ferreira HG. Inferring disease mechanisms from epidemiological data in chronic kidney disease: calcium and phosphorus metabolism. Nephron Clin Pract. 2009;112:c137–47.
2. Manjunath G, Sarnak MJ, Levey AS. Prediction equations to estimate glomerular filtration rate: an update. Curr Opin Nephrol Hypertens. 2001;10:785-92.
3. Cannata-Andía JB, Martin KJ. The challenge of controlling phosphorus in chronic kidney disease. Nephrol Dial Transplant. 2016;31:541-7. 4. Ben-Dov IZ, Galitzer H, Lavi-Moshayoff V, Goetz R, Kuro-o M,
Mohammadi M, et al. The parathyroid is a target organ for FGF-23 in rats. J Clin Invest. 2007;117:4003-8.
5. Brown EM, Juppner H. Parathyroid hormone: synthesis, secretion and action. In: Favus MJ, editor. Primer on the metabolic bone diseases and disorders of mineral metabolism. 6th ed. Washington: American Society
for Bone and Mineral Research; 2006. p. 90-9.
6. Felsenfeld AJ, Levine BS, Rodriguez M. Pathophysiology of calcium, phosphorus and magnesium dysregulation in chronic kidney disease. Semin Dial. 2015;28:564-77.
7. Habener JF, Rosenblatt M, Potts JT. Parathyroid hormone: biochemical aspects of biosynthesis, secretion, action and metabolism. Physiol Rev. 1984;64:985–1053.
8. Brown EM. Four parameter model of the sigmoidal relationship between parathyroid hormone release and extracellular Ca concentration in normal and abnormal parathyroid tissue. J Clin Endocrinol Metab. 1983;56:572-81.
9. Milsum JH. Biological control systems analysis. Columbus: McGraw-Hill Inc; 1966.
10. Guyton AC, Jones CE, Coleman TG. Circulatory physiology: cardiac output and its regulation. Philadelphia: WB Saunders Co; 1973. 11. Spiegel MR, Stephens LJ. Schaum’s Outline of Statistics. 3rd ed.
Columbus: McGraw-Hill Inc; 1961. p. 436-7.
12. National Kidney Foundation. K/DOQI clinical practice guidelines for chronic kidney disease: Evaluation, classification and stratification. Am J Kidney Dis. 2002;39:S1.
ARTIGO ORIGINAL
14. Bergwitz C, Jüppner H. Regulation of phosphate homeostasis by PTH, vitamin D, and FGF23. Annu Rev Med. 2010;61:91-104.
15. Berndt T, Kumar R. Clinical disturbances of phosphate homeostasis. In: Alpern R, Hebert S, editors. Seldin and Giebisch´s the kidney physiology and pathology. 4th ed. Amsterdam: Elsevier; 2008. p. 1989-2006.
16. Mundy GR. Hormonal factors which regulate bone. In: Mundy GR, Martin TJ, editors. Physiology and pharmacology of bone. Berlin: Springer-Verlag; 1993. p. 215–48.
17. Tatsumi S, Miyagawa A, Kaneko I, Shiozaki Y, Segawa H, Miyamoto K. Regulation of renal phosphate handling: inter-organ communication in health and disease. J Bone Miner Metab. 2016;34:1-10.
18. Blaine J, Chonchol M, Levi M. Renal control of calcium, phosphate, and magnesium homeostasis. Clin J Am Soc Nephrol. 2015;10:1257-72. 19. Drüeke TB, Massy ZA. Changing bone patterns with progression of
chronic kidney disease. Kidney Int. 2016;89:289-302.
20. Ritter CS, Slatopolsky E. Phosphate toxicity in CKD: the killer among Us. Clin J Am Soc Nephrol. 2016;11:1088-100.
21. Al-Aly Z, Qazi RA, González EA, Zeringue A, Martin KJ. Changes in
serum 25-hydroxyvitamin D and plasma intact PTH levels following treatment with ergocalciferol in patients with CKD. Am J Kidney Dis. 2007;50:59-68.
22. Kandula P, Dobre M, Schold JD, Schreiber MJ Jr, Mehrotra R, Navaneethan SD. Vitamin D supplementation in chronic kidney disease: a systematic review and meta-analysis of observational studies and randomized controlled trials. Clin J Am Soc Nephrol. 2011;6:50-62. 23. Slatopolsky E, Lopez-Hilker S, Delmez J, Dusso A, Brown A, Martin KJ.
The parathyroid-calcitriol axis in health and chronic renal failure. Kidney Int Suppl. 1990;29:S41-7.
24. Koenig KG, Lindberg JS, Zerwekh JE, Padalino PK, Cushner HM, Copley JB. Free and total 1,25-dihydroxyvitamin D levels in subjects with renal disease. Kidney Int. 1992;4:161-5.
25. Prince RL, Hutchison BG, Kent JC, Kent GN, Retallack RW. Calcitriol deficiency with retained synthetic reserve in chronic renal failure. Kidney Int. 1988;33:722-8.
26. Malluche HH, Werner E, Ritz E. Intestinal absorption of calcium and whole-body calcium retention in incipient and advanced renal failure. Miner Electrolyte Metab. 1978;1:263-70.
27. St-Arnaud R, Demay MB. Vitamin D biology. In: Glorieux FH, Pettifor JM, Juppner H, editors. Pediatric bone: biology and diseases. San Diego: Academic Press; 2003. p. 193-216.
28. Llach F, Massry SG. On the mechanism of secondary hyperparathyroidism in moderate renal insufficiency. J Clin Endocrinol Metab. 1985;61:601-6. 29. Delmez JA, Slatopolsky E. Hyperphosphatemia: its consequences
and treatment in patients with chronic renal disease. Am J Kidney Dis. 1992;19:303-17.
30. Isakova T, Wahl P, Vargas GS, Gutiérrez OM, Scialla J, Xie H, et al. Fibroblast growth factor 23 is elevated before parathyroid hormone and phosphate in chronic kidney disease. Kidney Int. 2011;79:1370-8. 31. Evenepoel P, Meijers B, Viaene L, Bammens B, Claes K, Kuypers D, et
al. Fibroblast growth factor-23 in early chronic kidney disease: additional support in favor of a phosphate-centric paradigm for the pathogenesis of secondary hyperparathyroidism. Clin J Am Soc Nephrol. 2010;5:1268– 76.
32. Vervloet MG, Massy ZA, Brandenburg VM, Mazzaferro S, Cozzolino M, Ureña-Torres P, et al. Bone: a new endocrine organ at the heart
of chronic kidney disease and mineral and bone disorders. Lancet Diabetes Endocrinol. 2014;2:427-36.
33. Gutiérrez OM. Fibroblast growth factor 23 and disordered vitamin D metabolism in chronic kidney disease: updating the “trade-off” hypothesis. Clin J Am Soc Nephrol. 2010;5:1710-6.
34. Gutierrez O, Isakova T, Rhee E, Shah A, Holmes J, Collerone G. Fibroblast growth factor-23 mitigates hyperphosphatemia but accentuates calcitriol deficiency in chronic kidney disease. J Am Soc Nephrol. 2005;16:2205-15.
35. Slatopolsky E, Delmez JA. Pathogenesis of secondary hyperparathyroidism. Nephrol Dial Transplant. 1996;11:130–5. 36. Craver L, Marco MP, Martínez I, Rue M, Borràs M, Martín ML, et al.
Mineral metabolism parameters throughout chronic kidney disease stages 1-5--achievement of K/DOQI target ranges. Nephrol Dial Transplant. 2007;22:1171-6.
37. Evenepoel P, Rodriguez M, Ketteler M. Laboratory abnormalities in CKD-MBD: markers, predictors, or mediators of disease? Semin Nephrol. 2014;34:151-63.
38. Bellasi A. Pro: should phosphate binders be used in chronic kidney disease stage 3-4? Nephrol Dial Transplant. 2016;31:184-8.
39. Dusso A, González EA, Martin KJ. Vitamin D in chronic kidney disease. Best Pract Res Clin Endocrinol Metab. 2011;25:647-55.
40. Quarles LD. Role of FGF-23 in vitamin D and phosphate metabolism: implications in chronic kidney disease. Exp Cell Res. 2012;318:1040-8. 41. Brown A, Dusso A, Slatopolsky E. Vitamin D. In: Alpern R, Hebert S, editors. Seldin and Giebisch´s the kidney physiology and pathology. 4th
ed. Amsterdam: Elsevier; 2008. p. 1803-49.
42. Fraser WD. Hyperparathyroidism. Lancet. 2009;374:145-58.
43. Dhayat NA, Ackermann D, Pruijm M, Ponte B, Ehret G, Guessous I, et al. Fibroblast growth factor 23 and markers of mineral metabolism in individuals with preserved renal function. Kidney Int. 2016;90:648-57. 44. Wolf M. Mineral (mal)adaptation to kidney disease. Clin J Am Soc
Nephrol. 2015;10:1875-85.
45. Levin A, Bakris GL, Molitch M, Smulders M, Tian J, Williams LA, et al. Prevalence of abnormal serum vitamin D, PTH, calcium, and phosphorus in patients with chronic kidney disease: results of the study to evaluate early kidney disease. Kidney Int. 2007;71:31-8.
46. Perwad F, Zhang MY, Tenenhouse HS, Portale AA. Fibroblast growth factor 23 impairs phosphorus and vitamin D metabolism in vivo and suppresses 25-hydroxyvitamin D-1alpha-hydroxylase expression in vitro. Am J Physiol Renal Physiol. 2007;293:F1577-83.
47. Liu S, Quarles LD. How FGF-23 works. J Am Soc Nephrol. 2007;18:1637-47.
48. Shimada T, Hasegawa H, Yamazaki Y, Muto T, Hino R, Takeuchi Y, et al. FGF-23 is a potent regulator of vitamin D metabolism and phosphate homeostasis. Bone Miner Res. 2004;19:429-35.
49. Erben RG, Andrukhova O. FGF23-Klotho signaling axis in the kidney. Bone. 2017 (in press).
50. Ix JH, Shlipak MG, Wassel CL, Whooley MA. Fibroblast growth factor-23 and early decrements in kidney function: the heart and soul Study. Nephrol Dial Transplant. 2010;25:993-7.
51. Kovesdy CP, Quarles LD. FGF23 from bench to bedside. Am J Physiol Renal. 2016;310:F1168-74.
![Figure 1 – Schematic representation of variations of [PTH] S as a function of [Ca] S and of [Ca] S as a function of [PTH] S](https://thumb-eu.123doks.com/thumbv2/123dok_br/15745622.637086/2.850.85.809.832.1048/figure-schematic-representation-variations-pth-function-function-pth.webp)