Environmental performance evaluation of agro-industrial innovations
e
part 1:
Ambitec-Life Cycle, a methodological approach for considering life cycle thinking
Maria Cléa Brito de Figueirêdo
a,*, Geraldo Stachetti Rodrigues
b, Armando Caldeira-Pires
c,
Morsyleide de Freitas Rosa
a, Fernando Antônio Sousa de Aragão
a,
Vicente de Paulo Pereira Barbosa Vieira
d, Francisco Suetônio Bastos Mota
daEmbrapa Agroindústria Tropical, Rua Dra Sara Mesquita, 2270, CEP 60511-110 Fortaleza, Ceará, Brazil
bEmbrapa Labex Europe/Unité Performance des systèmes de culture de plantes pérennes (Cirad PerSyst), TA-B 34/02, Bureau 143, Avenue Agropolis, 34398 Montpellier Cedex 5, France
cUniversidade de Brasília, Campus Universitário Darcy Ribeiro, CEP 70910-900 Brasília, Distrito Federal, Brazil
dUniversidade Federal do Ceará, Departamento de Engenharia Hidráulica e Ambiental, Bloco 713, Campus do Pici, CEP 60451-970 Fortaleza, Ceará, Brazil
a r t i c l e
i n f o
Article history:
Received 17 August 2009 Received in revised form 12 March 2010 Accepted 22 April 2010
Keywords: Methodology
Technological innovation Multi-criteria analysis Environmental impact
a b s t r a c t
As sustainability considerations increasingly dominate the technology development debate worldwide, practical approaches to assess environmental performance of innovations have been warranted. The present study (Part 1) introduces Ambitec-Life Cycle, a method derived from Ambitec-Agro for consid-ering life cycle thinking in the environmental performance evaluation (EPE) of agro-industrial innova-tions. An agro-industrial innovation case study related to residue recycling is presented, revealing steps in the product life cycle where opportunities are best for technological improvements. In Part 2 (this issue) of this study, a methodological approach for considering the environmental vulnerability of watersheds and to integrate this analysis in EPE methods is presented. This approach is applied to Ambitec-Life Cycle and to the same residue case study, allowing the identification of performance indicators with greater potential to cause impacts at the studied watersheds.
Ó2010 Elsevier Ltd. All rights reserved.
1. Introduction
According to the ISO 14031 standard, environmental perfor-mance evaluation (EPE) is a procedure used to support managerial decisions about environmental aspects of an organization that can interact with and cause impacts to the environment. EPE is carried out by monitoring the relevant environmental aspects (inputs, outputs, and environmental effects of processes, products, or services) and by comparing the results with established goals and pertinent legislation standards that are defined in the organization environmental management system (ISO, 1999).
Although the focus of EPE is usually the management system of an organization (Hermann et al., 2007), it can also be applied to the performance assessment of specific technological innovations, in order to analyze their potential impact on production processes and contribute towards technological improvement. Research teams can
benefit from applying EPE in all steps of technological innovation, from research and development up to the transference stage, since these studies allow a better understanding of innovations’positive and negative impacts, as well as the proposition of design changes to improve the environmental benefits of innovation adoption.
Depending on the evaluation objectives, the focus of EPE can be restricted to the stage in which a technological innovation is used, or can encompass other stages of its life cycle: raw material production, innovation production, and innovationfinal disposal (ISO, 1999). Methodological approaches such as Ambitec-Agro (Rodrigues et al., 2003; Irias et al., 2004) and Inova-tec ( Jesus-Hitzschky, 2007) are examples of EPE methods that compare the performance of an innovation with a previous technological context considering the stage in which it is used.
The EPE of an innovation considering its life cycle usually follows the framework proposed in the ISO 14040 standard that has been implemented differently in life cycle impact assessment (LCIA) methods, such as Ecoindicator 99 (Goedkoop and Spriensma, 2000), TRACI (Bare et al., 2003), EPS 2000 (Steen, 1999), Impact 2002þ(Jolliet et al., 2003) and EDIP 2003 (Potting and Hauschild, 2005). These methods are not specific to the study of agro-indus-trial innovations, but were developed to assess the environmental *Corresponding author. Tel.:þ55 85 3391 7100; fax:þ55 85 3391 7109.
E-mail addresses: [email protected] (M.C.B. de Figueirêdo), stacheti@ cnpma.embrapa.br (G.S. Rodrigues), [email protected] (A. Caldeira-Pires), [email protected] (M.F. Rosa), [email protected] (F.A.S. de Aragão),[email protected](V.P.P.B. Vieira),[email protected](F.S.B. Mota).
Contents lists available atScienceDirect
Journal of Cleaner Production
j o u r n a l h o m e p a g e : w w w . e l s e v i e r . c o m / l o c a t e / j c l e p r o
performance of any product, process, or service considering regional and global impact categories.
Life cycle assessments (LCA) of agricultural and industrial food products have been carried out increasingly with the development of inventories (Nemecek and Erzinger, 2005; Coltro et al., 2006; Mourad et al., 2007). A set of methodological approaches for considering agrochemical applications and their impacts on the environment (Roy et al., 2009; Nemecek et al., 2008) and land use issues, such as biodiversity loss and soil quality (Weidema and Lindeijer, 2001; Cowell and Clift, 2000; Canals et al., 2007; Mattson et al., 2000; Antón et al., 2007) are also available, although most of them are not consensual and have not been implemented in conventional LCIA methods. However, many diffi -culties contribute to the restricted use of LCA, such as the scarcity of locally detailed databases to support data inventories; the lack of consolidated methods to evaluate impacts on soil, such as erosion, salinization and compaction, and impacts on water availability, among others (Pennington et al., 2004; Pegoraro et al., 2007).
The present study introduces Ambitec-Life Cycle, a method derived from Ambitec-Agro (Rodrigues et al., 2003) for considering life cycle thinking in EPE of agro-industrial technological innova-tions. The method is being included in the institutional impact assessment platform of the Brazilian Agency for Agricultural ResearcheEmbrapa.
A case study applying Ambitec-Life Cycle in the EPE of the green coconut substrate (GCS) is presented. The GCS is a product inno-vation developed by Embrapa.
Ambitec-Life Cycle is a life cycle method tailored to the agro-industrial sector. The method uses multi-criteria hierarchical structure to connect a set of environmental aspects (indicators) to environmental criteria and principles, presenting a structure and normalization rules different from LCA methods based on ISO 14040. The environmental aspects are consumptions and emissions
usually responsible for the occurrence of impacts in the surroundings of agro-industrial activities. However, the method’s structure does not directly relate indicators to impact categories, but to environmental criteria and principles. When compared to LCA methods, Ambitec-Life Cycle offers an alternative way to evaluate the performance of an agro-industrial innovation by pre-senting its environmental aspects that least and most contribute to meeting the established criteria and principles.
2. Ambitec-Life Cycle
Ambitec-Life Cycle was developed following the steps proposed by Malczewski (1999) to multi-criteria analysis. It aims to contribute to the improvement of the environmental performance evaluation of agro-industrial innovations at the development phase, subsidizing research teams with environmental information about a new technological development as compared to its concurrent available alternative that has a similar function in the market (Figueirêdo, 2008). In this context, a technological innova-tion is understood as a new or differentiated product or process proposed to fulfill, with economic or environmental advantages, a given function in the market (OECD, 1997).
From Ambitec-Agro (Rodrigues et al., 2003), Ambitec-Life Cycle took the same hierarchical structure that links indicators to criteria and to principles. However, the proposed method allows the EPE of a product throughout its life cycle. The method also uses different rules to gather data, based on the concepts of functional unit and referenceflow, and to normalize the indicators’values.
2.1. Framework
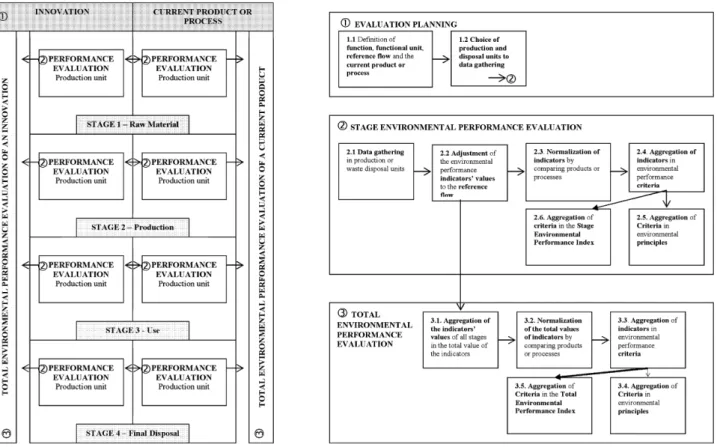
The framework of Ambitec-Life Cycle is presented inFig. 1. The
scheme at the left side of this figure emphasizes the
methodological focus on the comparison between the performance of an innovation and its current product or process. It also shows that the scope of the method encompasses four life cycle stages: (i) production/extraction of raw materials and resources used by the innovation; (ii) innovation production process; (iii) innovation utilization; and (iv)final disposal. Product innovations are evalu-ated considering all these stages, while process innovations that do not generate new products have their evaluation focused on the process utilization stage (iii). For product innovations, the perfor-mance results of each stage are integrated as a total environmental performance evaluation of the studied innovation as well as of its current process or product.
At the right side ofFig. 1the main steps involved in the use of Ambitec-Life Cycle are presented: (i) evaluation planning; (ii) EPE of each life cycle stage; and (iii) total EPE that considers the results of all stages. These steps are described in the following paragraphs.
2.2. Evaluation planning
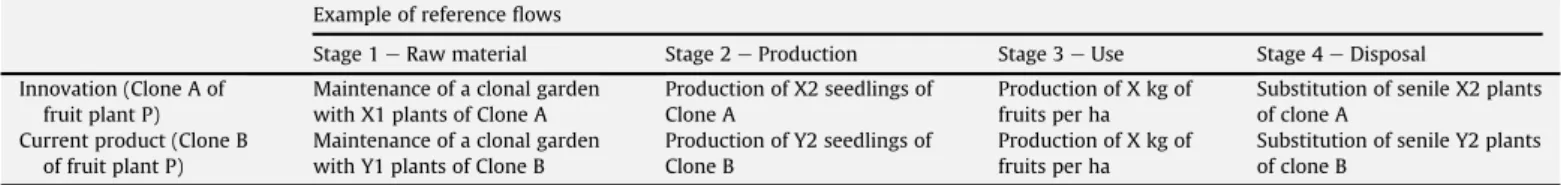
The planning step of an innovation’s EPE begins with the defi -nition of its function, functional unit, current product or process, and the referenceflow, based on ISO 14040 procedures (ISO, 2006). A function of an innovation is defined by looking at its purpose when adopted. A current product or process is chosen for comparison, as having a similar function to that of the proposed innovation at the local market context. The functional unit is a quantification of an innovation (be it a process or product) function. The reference flow is the measure of intermediate and final products necessary to fulfill an established functional unit. An innovation and its current product or process have common func-tion, functional unit, and specific reference flows. Examples of commonly used functions, functional units, and possible agro-industrial innovations are presented in Table 1. An example of referenceflows to the comparative study of two clones of a fruit plant is presented inTable 2.
The planning step continues with the choice of the production and disposal units for data collection of the environmental performance indicators. These units must be chosen considering the representativeness of the processes they adopt, according to their market share, and their permission for data gathering. Data is
collected for each life cycle stage of the innovation and of the current product or process.
2.3. EPE of a life cycle stage
The EPE throughout the life cycle stages of an innovation and of a current product or process uses a multi-criteria structure relating indicators to a set of criteria, principles, and index of environmental performance (Fig. 2). Note that some indicators are applicable only to the evaluation in agricultural units; some only to the evaluation in agro-industrial units; and some are common to the evaluation in both units.
Environmental principles of great importance to agro-industry are: efficiency in the use of resources, especially those non-renewable and dangerous; conservation of biodiversity, water, soil and air; and product quality. The criteria and indicators related to each environmental principle were chosen taking into account consumptions and emissions with potential to cause environ-mental impacts.
The following environmental impacts were pointed out as relevant to the study of agro-industrial activities: loss of biodiver-sity; soil erosion, compaction, salinization, sodification, and acidi-fication; desertification; environmental contamination by agrochemicals and solid wastes, encompassing toxicity issues and soil and water contamination; water scarcity; water pollution, encompassing eutrophication and water salinization; depletion of non-renewable resources; global warming; and food contamina-tion by additives. A revision of the main environmental aspects (consumptions and emissions), physical and biotic characteristics that interact with these aspects, and remediation actions related to these impacts are described inFigueirêdo (2008).
2.3.1. Data gathering
In each production unit, indicators are measured using material balance where the consumptions of material and energy are quantified to a certain production mass (e.g.: volume of water used (L) per 100 kg of material produced). After measurements, the minimum, average, and maximum indicator values must be iden-tified for a given production mass. These values will allow the consideration of data variability and the performance evaluation of three scenarios: (i) all indicators assuming average value
Table 1
Examples of commonly used agro-industrial functions, functional units, products and processes.
Function Functional units Example of innovations Current product or
process
Increase in productivity Production of a mass or volume per area or time
New clone of fruit plant A Harvest tractor A
Existing fruit plant A Existing harvest tractor B
Physical support to seedling and plant root development
Physical support to the development of a number of seedlings
Substrate A Existing substrate B
Degraded areas reclamation Area or volume of water recovered
Method A to desalinization of soil
Previous method B to desalinization of soil
Increase food shelf-life Shelf-life of 10 days to coconut water
Combined methods A to increase shelf-life
Combined methods B to increase shelf-life
Generate bio-energy Generate a quantity of energy (kWh)
Bio-energy from agro-residue A
Bio-energy from agro-residue B or other source
Greater tolerance to pests and diseases
Production of a mass per area, reducing pesticides use in a established percentage
Clone B or genetic modified organism of plant A
Plant A
Reinforce polymer-based materials
Increase strength in a established percentage
(ii) indicators assuming their highest values to innovation and their lowest values to the compared current product or process (most favorable case to innovation); and (iii) indicators assuming their lowest values to innovation and their highest values to the current technology (most unfavorable case to innovation).
2.3.2. Adjustment of indicator values to the referenceflow
The values of the environmental performance indicators gath-ered in the production or waste disposal unit, usually related to a certain production mass, need to be adjusted to the production mass defined in the referenceflow. A linear correlation is assumed between the production mass and the values obtained by the indicators in thefield measurement (Equation(1)).
In Equation(1),‘Production_reference_flow’is the production value established in the referenceflow for a life cycle stage;‘Indicator
-i_measure’ is the value obtained for indicator‘i’in a production
unit; ‘Production_measured’is the production value used in the measurements of the indicators at a production unit; and ‘Indica-tori_adjusted’is the indicator measured adjusted to the production
value established in the referenceflow.
For example, consider the EPE of a new substrate A for roses, compared to a current substrate B. The functional unit adopted is the production of one viable rose using substrate. The referenceflow at the substrate production stage for substrate A is 2.42 kg of substrate and for substrate B is 1.62 kg. However, data gathering is usually related to the amount of substrates A and B produced in a month
Fig. 2.Set of environmental performance indicators, criteria and principles available to the environmental performance evaluation of a technology.
Table 2
Example of a referenceflow to an innovation whose function is to increase productivity.
Example of referenceflows
Stage 1eRaw material Stage 2eProduction Stage 3eUse Stage 4eDisposal
Innovation (Clone A of fruit plant P)
Maintenance of a clonal garden with X1 plants of Clone A
Production of X2 seedlings of Clone A
Production of X kg of fruits per ha
Substitution of senile X2 plants of clone A
Current product (Clone B of fruit plant P)
Maintenance of a clonal garden with Y1 plants of Clone B
Production of Y2 seedlings of Clone B
Production of X kg of fruits per ha
Substitution of senile Y2 plants of clone B
Indicatoriadjusted¼ Production reference flow*indicatori measured
(37,157 kg for substrate A and 58,391 kg of substrate B). Now, consider that the consumption of energy in a month is 4844.8 kWh for substrate A and 7776.0 kWh for substrate B. In order to calculate the energy consumption related to each substrate according to the referenceflow, Equation(1)is applied, providing the energy value of 0.32 kWh ((2.42*4844.8)/37,157) for substrate A and the energy value of 0.22 kWh ((1.62*7776.0)/58,391) for substrate B.
2.3.3. Normalization of indicators
Because each indicator has a different measurement unit, they must be normalized to a common dimensionless scale in order to allow their aggregation. Thus, after adjustment of each indicator value to the referenceflow (Equation(1)), the values of all envi-ronmental performance indicators are normalized to a standard non-dimensional scale, which ranges from 0 (worst performance) to 100 (best performance). To normalize these indicators, the “maximum or minimum score”linear scale transformation is used, as proposed byMalczewski (1999). The“maximum score” trans-formation rule (Equation(2a)) is used when“the higher the indi-cator value, the higher the performance”, while the “minimum score”rule is used when“the higher the indicator value, the lower the performance”(Equation (2b)). The description of each envi-ronmental performance indicator with the equation used for normalization is presented inAppendix A.
Indicatorinormalized ¼
Indicator i Valuemaxi
*100 (2a)
Indicatorinormalized ¼
Value min Indicatori
*100 (2b)
In Equations(2a) and (2b),‘Indicatori’ is the measured value of
indicator‘i’that was already adjusted (Equation(1)) and is related to an innovation or to its current product or process; Valuemaxi is
the maximum value of indicator‘i’and Valuemini is the minimum
value of indicator‘i’, obtained by the comparison between the value assumed by the innovation and by its current product or process; ‘Indicatori_normalized’ is the normalized value of indicator ‘i’,
when evaluating an innovation or its current product or process. For instance, consider the example of the substrates A and B described in Section 2.3.2. The normalized energy value of substrates A and B are obtained using Equation(2b)(the higher the energy value, the lower the performance of a product or process). In the case of substrate A, this value is 68.37 ((0.22/0.32)*100). For substrate B production, the normalized energy value is 100.00 ((0.22/0.22)*100).
2.3.4. Aggregation of indicators
The simple arithmetic average is used to aggregate normalized performance indicators into criteria, criteria into principles, and criteria into an environmental performance index for the life cycle stage under consideration. It is assumed that all indicators have the same importance in a particular criterion and that all criteria have the same importance in the formulation of principles and the total environmental performance index. According toHardi and Semple (2000)andMalczewski (1999)simple and weighted averages are the most straightforward methods of aggregation, being used in the formulation of numerous indices, such as the Human Development Index.
2.4. Total EPE
The results of the analysis of each life cycle stage are aggregated to obtain a concluding performance evaluation of an innovation and its current product or process. The values of each indicator in
each stage, already adjusted to the referenceflow, are aggregated into a total value that represents all life cycle stages. This aggre-gation is performed using one of the following rules: sum of indi-cators values, when their measurement units are area, energy, mass or volume; and simple average of indicators values, when their measurement units express concentration or conductivity (e.g.: mg/L, dS/m) or are non-dimensional (e.g.: risk class of genetically modified organisms).
Data normalization and aggregation of indicators in indices (criteria, principles, and total performance index) are also per-formed using the same rules already described for the environ-mental performance evaluation in each life cycle stage. This leads to the determination of the total environmental performance index that considers all stages for the innovation and its current product or process.
3. Application of Ambitec-Life Cycle in the study of an agro-industrial innovation
3.1. Evaluation planning
The Ambitec-Life Cycle method was applied to study the green coconut substrate (GCS), a product that provides physical support to seedlings and to plant production in soilless cultivation. This new product was compared with the ripe coconut substrate (RCS), considered as the existing current product as it is usually used in flower and horticulture production in the Brazilian market.
The study encompassed the following stages of GCS and RCS life cycles: coconut husk disposal (stage 1), coconut substrate produc-tion (stage 2), coconut substrate use in rose seedling (stage 3a) and flower production (stage 3b), and coconut substratefinal disposal (stage 4). Both studied substrates have solid wastes as raw material: GCS is derived from immature coconut husk wastes generated from the production of coconut water; and RCS is derived from mature coconut husk wastes from coconut meat production. Because these materials are wastes and are not generated to be used in the substrate production, the impact of coconut husks disposal, instead of the impacts of their generation, were analyzed and compared at thefirst life cycle stage (Stage 1eraw material, inFig. 1).
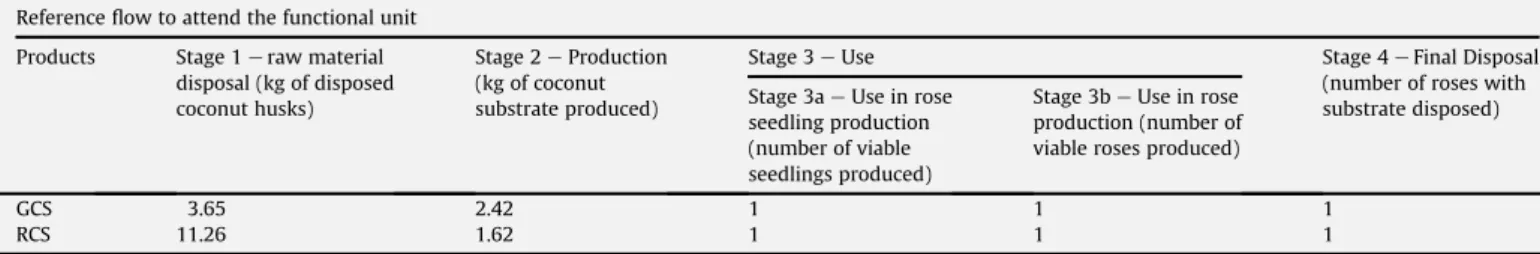
The life cycle stages of GCS and RCS were located in different production units. The choice of each visited production unit was based on the EPE team knowledge of their market representative-ness and the companies’permission to gatherfield data related to the performance indicators. The functional unit adopted was the mass of substrate necessary to support the production of one commercial rose of the Carola cultivar. For each product (GCS and RCS) a referenceflow was defined to meet the established func-tional unit (Table 3). The indicator’s values gathered in field measurements for each product and stage were adjusted consid-ering this referenceflow.
3.2. EPE of GCS and RCS
The environmental performance indices obtained for GCS and of RCS, throughout their respective product life cycles, are presented in Fig. 3, considering the average, minimum and maximum performance values. The environmental performance of GCS was higher in stage 1 (coconut husk disposal), similar to the perfor-mance of RCS in stages 3a (use in rose seedling production) and 4 (substratefinal disposal), and lower than the current product on stages 2 (substrate production) and 3b (use in rose production). These stages deserve to be further investigated to identify which criteria most contributed to the performance of GCS.
In stage 1, the performance of the disposed green and ripe
a voluminous urban waste usually sent to landfills, contributing to the production of leachate and global warming gases. On the other hand, ripe coconut husks are usually embedded into coconutfields, ameliorating soil structure and contributing to increased production.
On average, 11.26 kg of green coconut husks are disposed in a landfill when RCS, instead of GCS, is commercialized. This disposal into landfills results in consumptions (0.001 kWh of energy, 0.032 L of diesel to transport the husks, 0.009 L of water to rinse tractors and other equipment, 0.0003 ha to dispose the husks) and emis-sions (generation of 0.01 L of leachate, with a load of 0.006 g of BOD, 0.016 g of COD and 0.002 g of TSS), that do not occur when ripe husks are incorporated in soil. Thus, the use of one kilogram of green coconut husks to produce substrate causes a greater comparative benefit to the environment than the use of the same mass of mature coconut husks. As a consequence, in stage 1, GCS performed higher (99.55) than RCS (39.79).
In stage 2 (substrate production), initially, a set of mechanical (grinding, squeezing, and separation) and manual (maturation, washing, and drying) processes are performed for the production of GCS. This substrate obtained its lower environmental performance (73.79) in relation to RCS (100.00) in this stage. Four criteria related to agro-industrial processes should be managed to improve GCS performance in this stage:
- effluent generation: The production of 2.42 kg of GCS generates 12.51 L of a high polluting effluent, with an EC of 2.88 dS/m and a load of 126.38 g of BOD, 191.52 g of COD, 21.02 g of TSS, 0.39 g of TNK, 0.43 g of TP and 1.17 g of TOG. The effluent with the higher load is the one resulting from the mechanical pressing of the husks. This effluent is produced because it is necessary to extract the liquid (80% of the green coconut husk mass) that elevates the substrate electric conductivity (EC), inhibiting plant root growth. Since the effluent is rich in nutrients and organic matter, it could be used as a raw material for another process, such as biofuel or fertilizer production.
- water consumption: The production of 2.42 kg of GCS consumes 15.80 L of water not recycled or reused to wash the substrate. The water is used because after the liquid is extrac-ted from the husks, the substrate still presents high EC, and machines must be rinsed after each production day. This volume is twice that used in the production of RCS. Ways to reduce water volume in this stage are: more efficient liquid extraction from husks by the pressing machine, reducing the amount of water necessary to lower EC of the substrate; immersion of the substrate in a specific volume of water for a certain time, which must be adequately determined by research; and use of controlled volume of water to wash machines, instead of running water.
Environmental Performance along GCS and RCS life cycles, considering data variations
94.49 100.00 93.40 91.19 94.44
87.19
57.99 89.60
72.75 73.79
80.38 100.00
40.72
93.83
76.94
96.67
89.06 93.96
32.95
92.00
72.44 94.67
82.94 99.55
39.79
93.18
92.72
74.80 96.49
0.00 20.00 40.00 60.00 80.00 100.00
GCS STAGE 1
-Disposal of coconut husks
RCS GCS
STAGE 2 -Substrate production
RCS GCS
STAGE 3a -Substrate use
in rose seedling production
RCS GCS
STAGE 3b -Substrate use
in rose production
RCS GCS
STAGE 4 -Substrate
disposal
RCS GCS
TOTAL RESULT
RCS
Performance scores
0.00 20.00 40.00 60.00 80.00 100.00
Fig. 3.Environmental performance along life cycle stages of GCS and RCS.
Table 3
Referenceflow for GCS and RCS.
Referenceflow to attend the functional unit
Products Stage 1eraw material disposal (kg of disposed coconut husks)
Stage 2eProduction (kg of coconut substrate produced)
Stage 3eUse Stage 4eFinal Disposal
(number of roses with substrate disposed) Stage 3aeUse in rose
seedling production (number of viable seedlings produced)
Stage 3beUse in rose production (number of viable roses produced)
GCS 3.65 2.42 1 1 1
- electricity consumption: Energy was used in the pressing, crushing, and separating machines, resulting in a consump-tion of 0.32 kWh per 2.42 kg of GCS produced. This consumption can be reduced with adjustments in equipment, since the substrate production process was interrupted several times due to obstructions, increasing the use of energy.
- solid waste generation: Along the GCS production line, rests of husks and substrates fell down from the machines and were considered wastes, although they could be reused in the production process. If managerial procedures were adopted to favor reuse of this material, an average of 0.90 kg of solid waste per rose produced with GCS would become raw material.
In stage 3a, GCS and RCS were used in rose seedling production of the Carola cultivar, during 30 days in a greenhouse. Despite the similar performances observed for both substrates, production using GCS scored lower in the water consumption criteria. Because rose production requires substrates with EC of at least 0.3 dS/m, GCS demanded 0.42 L per rose produced, almost twice the volume required to wash RCS. More efficient liquid extraction and the washing of green coconut husks in the previous stage would reduce the water demand in this stage.
In stage 3b, substrates were used to support rose production of the Carola cultivar. Data was gathered for a period of 120 days in a greenhouse. GCS scored lower (74.80) than RCS (96.49) in this stage, with the following main aspects to be addressed by the GCS research team in order to improve environmental performance:
- product durability: GCS changed its physical and chemical characteristics by the third month of use in rose production (stage 3), exhaling a sulfur smell, characteristic of anaerobic degradation. This fact suggests that the maturation process performed in the previous stage was not adequate to produc-tion longer than two months, new research being necessary to improve the product shelf-life. GCS degradation impacted plant development, resulting in lower rose production and higher generation of solid wastes, consumption of fertilizers, use of irrigation water, use of energy, use of pesticides and of land, per rose produced.
- water consumption: Because the substrate washing process in stage 2 was not efficient, rewashing of the substrate was necessary in stage 3b in order to remove salts that inhibit seedling and rose production. A volume of 94.12 L of water per commercial rose produced was used in this procedure. - effluent generation: Effluent was generated when GCS was
washed before and during production to reduce EC, and when irrigation water was drained. GCS drainage presented a higher polluting load than RCS, generating 25.73 L of effluent per commercial rose produced, with a load of 1.91 g of BOD, 6.81 g of COD, 1.64 g of TSS, 0.12 g of TNK, 0.10 g of TP and 0.46 g of TOG. Since both substrates received fertilized water with the same characteristics, GCS higher polluting load could be mostly explained by the substrate degradation and solubili-zation and by lower plant development and removal of nutrients.
In stage 4, thefinal disposal of substrates was analyzed. After two or more years, old substrates are usually exchanged for new ones and the old material is sent to composting. The GCS scored a little lower (91.19) than the RCS (94.44) because more GCS per commercial rose produced was sent to composting and a higher area was necessary for composting this substrate.
In the stage of total environmental performance evaluation, the aggregation of indicator values along life cycle stages resulted in a lower performance to GCS (80.38) as compared to RCS (89.06) (Fig. 3). The main criteria when GCS achieved the lowest perfor-mance and that need research improvements, considering its life cycle are: product durability, water consumption, and effluent generation.
The performances of both products were also evaluated in order to consider data variability, using two scenarios: indicators assuming their highest values to GCS and lowest values to RCS (most unfavorable case to GCS), and indicators assuming their lowest values to GCS and highest to RCS (most favorable case to GCS) (Fig. 3). In the most favorable scenario to GCS, its total envi-ronmental performance (87.19) was a little better than the perfor-mance of RCS (82.94), implying that data variability in this study did not assure best overall performance to neither one of the substrate production technologies.
4. Discussion and conclusions
The presented Ambitec-Life Cycle method is a complementary approach to the environmental performance evaluation of agro-industrial innovations. The method integrates life cycle thinking to the multi-criteria structure currently used for technology innova-tion impact assessments at Embrapa, with the Ambitec-Agro method (Rodrigues et al., 2003; Monteiro and Rodrigues, 2006). This structure links environmental indicators of relevance for agro-industrial activities to criteria and to principles of sustainability, but does not directly connect indicators to impact categories as LCA methods do (Goedkoop and Spriensma, 2000; Bare et al., 2003; Steen, 1999; Jolliet et al., 2003; Potting and Hauschild, 2005; ISO, 2006). The method allows the identification of indicators that present satisfactory environmental performance and of those that need improvement.
Traditional methods for environmental assessment tailored for the evaluation of agro-industrial innovations (e.g.: Ambitec-Agro and Inova-tec) focus on the evaluation in particular stages of an innovation life cycle. The focus on a single stage of an innovation life cycle can mislead the performance evaluation of an innovation, because performance can be better in that one stage but worse in the others. The application of Ambitec-Life Cycle to the evaluation of GCS in comparison with RCS showed that the innovation per-formed better in or equal in three life cycle stages and worse in two others. The environmental assessment performed revealed oppor-tunities for technological improvements in all stages of GCS.
When the R&D team knows the areas where an innovation will most probably be adopted, the consideration of the envi-ronmental vulnerability of these areas is important. Areas vulnerable to the occurrence of certain impacts (e.g.: water scarcity) adopting agro-industrial innovations which exert pres-sures related to those impacts (e.g.: high water demand) have higher potential to be negatively impacted. Part 2 (this issue) of this study presents a methodological approach to carry out watershed vulnerability analysis and integrate it into EPE of agro-industrial innovations. This approach is applied to Ambitec-Life Cycle, expanding its framework, and to the study of GCS and RCS, allowing the identification of environmental performance indi-cators with greater potential to cause impacts in the studied watersheds.
Acknowledgements
The authors would like to thank the Brazilian Agricultural Research Corporation (Embrapa) for financially supporting the research; the researchers Adriano Lincoln Albuquerque Mattos and Renato Carrha Leitão for revision and important contributions to
this work; and the companies Cearosa, Recicasco, Ecofor, Ducoco and Jangurussu Cooperative for allowing them to gather data.
Appendix A. Description of environmental performance indicators
Criteria and indicators Description
1. Consumption of materials
1.1 Total materials** 1.2 Dangerous material** 1.3 Non-renewable material** 1.4 Non-reused or non-recycled
material**
Measure the total mass (kg) of materials (1.1), dangerous materials (1.2), non-renewable materials (1.3) and non-reused or non-recycled materials (1.4) used in a technological process. At the use andfinal disposal stages, the total material corresponds to the technological innovation that has been evaluated. According to the principles of industrial ecology and eco-efficiency, the consumption of materials must be reduced to a minimum level that guarantees product quality, especially those that are dangerous, non-renewable, non-reused or non-recycled (Sonnemann et al., 2004).
2. Electricity consumption
2.1 Total electricity**
Measure the total energy consumption (kWh) of equipments. Energy conservation is an eco-efficiency principle (Sonnemann et al., 2004).
3. Fuel consumption
3.1 Total fuels** 3.2 Fossil fuels**
3.3 Fuels not obtained from waste**
Measure the total volume (L) of fuels (e.g. gasoline, diesel, mineral coal, biofuels) (3.1), the total volume (L) of fossil fuels (3.2) and the total volume (L) of fuels not derived from waste (3.3) used by equipments. The consumption of fuels must be reduced, especially those from non-renewable sources, according to the principles of industrial ecology and eco-efficiency ( Sonnemann et al., 2004). Burning of fossil fuels contribute to global warming and reduce non-renewable mineral reserves. Whenever possible, fuels from wastes should be preferred.
4. Water consumption
4.1 Total water**
4.2 Water not recycled/reused**
Measure the total volume (L) of water (4.1) and of not recycled or reused water (3.2) used in a production process. The consumption of water must be reduced, according to the principles of industrial ecology and eco-efficiency and because water scarcity is a problem afflicting communities worldwide (Sonnemann et al., 2004). When it is used, reused or recycled water should be used whenever possible in order to reduce demand for raw or treated water.
5. Land use
5.1 Deforestation** 5.2 Recovery*
Measure the deforested area (ha) necessary for agricultural production or waste disposal (5.1) and the area (ha) recovered that was previously degraded (5.2). Deforestation must be avoided, since it can contribute to biodiversity loss, soil erosion, compaction, and reduction of organic matter. Products or processes that recover degraded areas must be fostered whenever possible.
6. Fertilizer consumption
6.1 Total macronutrients** 6.2 Total micronutrients**
Measure the total mass (kg) of macronutrients (nitrogen, phosphorus, potassium, calcium, magnesium and sulfur) (6.1) and of micronutrients (boron, cobalt, zinc, iron, manganese, molybdenum and cupper) (6.2) contained in fertilizers used in an agricultural process. The excess use of macronutrients and micronutrients change soil chemical properties leading to reduced nutrient absorption capacity by plants. Nutrients in soil are also transported to water by runoff and leaching processes, polluting water bodies and contributing to eutrophication (nitrogen and phosphorus mainly) of impounded water. Nitrogen-based fertilizers also contribute to global warming and soil acidification.
7. Pesticides consumption
7.1 Total pesticides**
Measures the mass (g) of pesticides used per toxicity class (1every high; 2ehigh; 3emedium; 4elow). A weight was attributed to each toxicity class (1e0.4; 2e0.3; 3e0.2; 4e0.1). Afinal value is obtained by multiplying the mass of pesticide belonging to each toxicity class by its respective weight. Pesticides cause soil, water, air, and biological contamination and should be avoided or reduced, especially those belonging to high toxicity classes.
8. Product durability
8.1 Product shelf-life*
Measures the technological product shelf-life (days) of the innovation and current product. Longer product durability reduces storage losses with waste generation and is a principle of eco-efficiency.
9. Use of genetically modified organism (GMO)
9.1 Risk class of GMO**
Evaluates the risk class of a used GMO in agricultural processes that are part of the studied product life cycles, according to the risk classes used by the Brazilian National Technical Commission of Bio-security (CTNBio, 2006). The following risk class values are used in this indicator: 1elow risk or no GMO; 2emedium risk GMO; 3ehigh risk GMO; and, 4every high risk GMO. GMOs can cause biodiversity changes in the region where they are cultivated, especially when they belong to high risk classes.
10. Use of food addictives
10.1 Food addictive limit*
Measures the sum of maximum use levels and/or limits (g) of each food addictive used in a product. The higher the maximum limit allowed (FAO and WHO, 2008), the lower potential of a food to cause health problems, such as intoxication and allergy.
References
Antón, A., Castells, F., Montero, J.I., 2007. Land use indicators in life cycle assess-ment. Case study: the environmental impact of Mediterranean greenhouses. Journal of Cleaner Production 15, 432e438.
Ayers, R.S., Westcot, D.W., 1991. A qualidade da água na agricultura. UFPB, Campina Grande.
Bare, J.C., Norris, G.A., Pennington, D.W., Mckone, T., 2003. TRACI: the tool for the reduction and assessment of chemical and other environmental impacts. Journal of Industrial Ecology 6 (3e4), 49e78.
Canals, L.M., Romanyà, J., Cowell, S.J., 2007. Method for assessing impacts on life support functions (LSF) related to the use of “fertile land” in Life Cycle Assessment (LCA). Journal of Cleaner Production 15, 1426e1440.
Coltro, L., Mourad, A.L., Oliveira, P.A.P.L.V., Baddini, J.P.O.A., Kletecke, R.M., 2006. Envi-ronmental profile of Brazilian Green Coffee. International Journal of LCA 11 (1),16e21. Cowell, S.J., Clift, R., 2000. A methodology for assessing soil quantity and quality in
life cycle assessment. Journal of Cleaner Production 8, 321e331.
Comissão Nacional Técnica de Biossegurança e CTNBio [National Technical Commission of Bio-security], 2006. Resolução Normativa No 2, de 27/11/2006. Diário Oficial da União, Brasília.http://www.anbio.org.br/legis/instrucao_nor. htm.
Embrapa Meio Ambiente, 2002. Relatório de referência: emissão de gases de efeito estufa na queima de resíduos agrícolas. Embrapa, Brasília.
Food Agriculture Organization (FAO), World Health Organization (WHO), 2008. Codex General Standard for Food Additives (GSFA) Online Database.http:// www.codexalimentarius.net/gsfaonline/index.html?lang¼en.
(continued)
Criteria and indicators Description
11. Solid waste generation
11.1 Total solid waste** 11.2 Dangerous waste** 11.3 Not recyclable or reusable
waste**
Measure the mass (kg) of total solid wastes (11.1), dangerous wastes (11.2), and of non recyclable or reusable wastes generated in each life cycle stage. Solid waste generation indicates losses along the production line and should be minimized, especially those with greater pollution potential (dangerous or hazardous wastes) and that are non reusable or recyclable. Increasing recycling and reuse processes are eco-efficiency goals (Sonnemann et al., 2004).
12. Erosion and compaction
12.1 Area of uncovered soil** 12.2 Area of mechanized soil**
Measure the area (m2) of uncovered soil (12.1) and of soil subjected to mechanized equipment (13.2) in agricultural areas related to a product life cycle or process. Uncovered soils are susceptible to rain and wind erosion and compaction. When tractors or other plowing equipment are used, the risk of compaction increases. Thus, areas of uncovered soil and areas subjected to heavy mechanization should be avoided or reduced.
13. Irrigation water quality
13.1 Salinity of irrigation water** 13.2 Sodicity of irrigation water**
Evaluates irrigation water potential to cause soil salinization and sodification when the product or process requires irrigation during its life cycle. The salinity of irrigation water (13.1) is measured by water electrical conductivity (EC), while the sodicity of irrigation water (13.2) is measured qualitatively, by comparing water EC with water sodium adsorption ratio (SAR), according toAyers and Westcot (1991). The higher the EC value, the higher its salinity and potential to cause soil salinization. Moreover, the combination of EC and RAS indicates water potential to cause sodicity. When water sodicity indicates severe problems (Ayers and Westcot, 1991), the“Sodicity of irrigation water”(13.2) must be valued as 0 (worst performance), when it indicates moderate problems, this indicator must be valued as 50 and when it indicates no problems, this indicator must be valued as 100 (best performance).
14. Burning
14.1 Burned agriculture area** 14.2 Total burned waste**
Evaluate the potential emission of global warming gases, by burning residues and solid wastes. Burning of agricultural residues generates global warming gases (CH4, N2O, NOx, CO and CO2) (Embrapa Meio Ambiente, 2002). Although plant growth uptakes CO2and it is not considered a relevant global warming gas related to agricultural activities, the other global warming gases are relevant and should be avoided. Thefirst indicator (14.1) measures the agricultural area (ha) burned to clean crop residues. This indicator must be used only when an innovation or its current product or process requires the burning of agricultural areas. The second indicator (14.2) measures the total mass (kg) of solid wastes burned without control or use in industrial processes, when crop residues are collected and burned without control. When crop residues are burned without collection in agricultural areas, the former indicator (14.1) must be used.
15. Effluent generation
15.1 Biochemical Oxygen Demand (BOD) load**
15.2 Chemical Oxygen Demand (COD) load**
15.3 Total Suspended Solid (TSS) load**
15.4 Total Kjeldahl Nitrogen (TKN) load**
15.5 Total Phosphorous (TP) load** 15.6 Total Oil and Grease (TOG)
load**
15.7 Electric Conductivity (EC)** 15.8 Effluent not recycled/reused**
Evaluate the polluting load, salinity, and the adoption of reuse/recycling practices.
Total loads (g) of each considered parameter (BOD, COD, TSS, TKN, TP and TOG) are measured by multiplying the effluent total volume (L) by the average parameter concentration (mg/L). Effluents of agro-industrial activities are usually rich in organic matter and nutrients, presenting high levels of BOD, COD, TSS, TKN, TP and TOG. Such effluents can cause water turbidity, low oxygen availability, and disorders on biological communities, leading to eutrophication of impounded waters. Effluent salinity is measured by the average EC (dS/m) of non-used effluents, indicating its salinity and potential to increase water and soil salinization.
The adoption of reuse/recycling practices is measured by the total volume of effluents (L) non recyclable/reusable. Reuse and recycling is a principle of eco-efficiency (Sonnemann et al., 2004) that, when applied to effluents, reduces their pressure upon water bodies.
16. Waste degradation
16.1 Total organic waste**
Measures the mass (kg) of organic wastes sent to landfills. Organic wastes, when sent to landfills, are anaerobically degraded, generating leachate and global warming gases.
17. Flood irrigation
17.1 Flooded area**
Measures the agricultural areas (ha) subjected toflood irrigation. This type of irrigation generates methane, an important global warming gas, by anaerobic degradation of crop residues (IPCC, 1996).
Figueirêdo, M.C.B., 2008. Environmental performance evaluation of agro-industrial technological innovations, considering life cycle and environmental vulnera-bility: Ambitec-Life Cycle Model. PhD thesis, Ceará Federal University, Fortaleza. Hydraulics and Environmental Engineering, Brazil (in Portuguese).
Goedkoop, M., Spriensma, R., 2000. The Eco-indicator 99: a Damage Oriented Method for Life Cycle Impact Assessment. Methodology Report. PRé Consul-tants B.V., Amersfoort.
Hardi, P., Semple, P., 2000. The dashboard of sustainability: from a metaphor to an operational set of indices. In: Proceedings of the Fifth International Conference on Social Science, Colônia, German.
Hermann, B.G., Kroeze, C., Jawjit, W., 2007. Assessing environmental performance by combining life cycle assessment, multi-criteria analysis and environmental performance indicators. Journal of Cleaner Production 15, 1787e1796. Intergovernmental Panel on Climate Change (IPCC), 1996. Technologies, Policies and
Measures for Mitigating Climate Change. Technical Paper I. IPCC.
Irias, L.J.M., Gebler, L., Palhares, J.C.P., Rosa, M.F., Rodrigues, G.S., 2004. Avaliação de impacto ambiental de inovações tecnológicas agropecuáriase aplicação do Sistema Ambitec. Agricultura em São Paulo 51 (1), 23e40.
International Standardization Organization (ISO), 1999. ISO 14031: Environmental Management e Environmental Performance Evaluation e Guidelines. ISO, Geneva.
International Standardization Organization (ISO), 2006. ISO 14040: Environmental Management e Life Cycle Assessment e Principles and Framework. ISO, Geneva.
Jesus-Hitzschky, K.R.E., 2007. Impact assessment system for technological innova-tion: INOVA-tec System. Journal of Technology Management & Innovation 2 (2), 67e82.
Jolliet, O., Margni, M., Charles, R., Humbert, S., Payet, J., Rebitzer, G., Rosenbaum, R., 2003. IMPACT 2002þ: a new life cycle impact assessment methodology. International Journal of LCA 8 (6), 324e330.
Malczewski, J., 1999. GIS and Multicriteria Decision Analysis. John Wiley & Sons, New Jersey.
Mattson, B., Cederberg, C., Blix, L., 2000. Agricultural land use in life cycle assess-ment (LCA): case studies of three vegetable oil crops. Journal of Cleaner Production 8, 283e292.
Monteiro, R.C., Rodrigues, G.S., 2006. A system of integrated indicators for socio-environmental assessment and eco-certification in agricultureeAmbitec-Agro. Journal of Technology Management & Innovation 1 (3), 47e59.
Mourad, A.L., Coltro, L., Oliveira, P.A.P.L.V., Kletecke, R.M., Baddini, J.P.A.O., 2007. A simple methodology for elaborating the life cycle inventory of agricultural products. International Journal of LCA 12 (6), 408e413.
Nemecek, T., Erzinger, S., 2005. Modeling representative life cycle inventories for Swiss arable crops. International Journal of LCA 10 (1), 1e9.
Nemecek, T., Richthofen, J.S., Dubois, G., Casta, P., Charles, R., Pahl, H., 2008. Envi-ronmental impacts of introducing grain legumes into European crop rotations. European Journal of Agronomy 28, 380e393.
Organization for Economic Cooperation and Development (OECD), 1997. Oslo Manual. OECD, Paris.
Pegoraro, L.A., Goedkoop, M., Ugaya, C.M.L., Tadano, Y.S., 2007. The life cycle impact assessment (LCIA) and some important considerations to Brazil. Proceedings of CILCA São Paulo.
Pennington, D.W., Potting, J., Finnveden, G., Lindeijer, E., Jolliet, O., Rydberg, T., Rebitzer, G., 2004. Life cycle assessment Part 2: current impact assessment practice. Environmental International 30, 721e739.
Potting, J., Hauschild, M., 2005. Background for Spatial Differentiation in LCA Impact Assessment e The EDIP2003 Methodology. http://www2.mst.dk/Udgiv/ publications/2005/87-7614-581-6/pdf/87-7614-582-4.pdf.
Rodrigues, G.S., Campanhola, C., Kitamura, P.C., 2003. An environmental impact assessment system for agricultural R&D. Environmental Impact Assessment Review 23 (2), 219e244.
Roy, P., Ney, D., Orikasa, D., Xu, Q., Okadome, D., Nakamura, N., Shiina, T., 2009. A review of life cycle assessment (LCA) on some food products. Journal of Food Engineering 90, 1e10.
Sonnemann, G., Castells, F., Schuhmacher, M., 2004. Integrated Life-cycle and Risk Assessment for Industrial Processes. Lewis Publishers, New York.
Steen, B., 1999. A Systematic Approach to Environmental Priority Strategies in Product Development (EPS). Version 2000eGeneral System Characteristics. http://msl1.mit.edu/ind_eco/sslinks/links.php?go¼20.
Weidema, B.P., Lindeijer, E., 2001. Physical Impacts of Land Use in Product Life Cycle Assessment.http://www.lca-net.com/files/gaps9.pdf.
Maria Cléa Brito de Figueirêdo: Ph.D. in Civil Engineering, in the concentration area of Environmental Sanitation, from Ceará Federal University (Fortaleza, Ceará, Brazil) in 2009. M.Sc in Science and Technology Studies from Rensselaer Polytechnic Institute (Troy, NY, USA) in 2003. Researcher at the Brazilian Agency for Agricultural Researche Embrapa, Center of Tropical Agro-industry, since 2001, in the area of environmental impact assessment.
Geraldo Stachetti Rodrigues: Ph.D. in Ecology and Evolutionary Biology from Cornell University (Ithaca, NY, USA) in 1995. Researcher at the Brazilian Agency for Agricultural ResearcheEmbrapa, Center of Environment, in the area of environmental impact assessment since 1987. Currently working at Embrapa Labex Europe/Unité Perfor-mance des systèmes de culture de plantes pérennes (Montpellier, France).
Armando Caldeira-Pires: Ph.D. in Mechanical Engineering from Lisboa Technical
University in 1995. Professor at the Brasília University (Brasília, DF, Brazil) since 2004. Project leader and professor in the areas of industrial ecology and life cycle analysis.
Morsyleide de Freitas Rosa: Ph.D in Chemical Engineering from Rio de Janeiro Federal University. Researcher at the Brazilian Agency for Agricultural ResearcheEmbrapa, Center of Tropical Agro-industry, since 1995, in the areas of environmental manage-ment and nanotechnology.
Fernando Antônio Sousa de Aragão: M.Sc. in Plant Breading from Viçosa Federal
University (Viçosa, MG, Brazil) in 1997. Researcher at the Brazilian Agency for Agri-cultural ResearcheEmbrapa, Center of Tropical Agro-industry, since 2002, in the area of agronomy.
Vicente de Paulo Pereira Barbosa Vieira: Ph.D in Water Resources Management from
Colorado University in 1978. Professor at Ceará Federal University since 1963 in the areas of water resources economy, risk analysis and environmental indicators building.
Francisco Suetônio Bastos Mota: Ph.D. in Public Health from São Paulo University