REVIEW ESSAY
Entrepreneurship, Tuvalu, development and .tv: a response James M. Conway
Consultant Funafuti, Tuvalu
ABSTRACT: This paper comments on ‘Entrepreneurship and the Dot TV Phenomenon’ by Baldacchino & Mellor (2015) who suggest that state-run entrepreneurship is behind the success of .tv. To examine this, I briefly review the early years of .tv, the government’s administration of .tv, the actual impact of .tv income, and the numerical weight of .tv income compared with other sources of government revenue. I debunk several .tv-related myths and explore the media’s enduring .tv attraction. I also comment on topics covered by the authors that are unrelated to .tv – such as subsistence, exports, development models – identifying inaccuracies, issues in need of clarification, misleading descriptions, or material that I find stretched beyond credibility. Connecting .tv success to entrepreneurship might be a reasonable premise, but I doubt its plausibility. Notions of entrepreneurship, however, can be conceptually different. Perhaps this could be a starting point to re-examine such differences, some of which can be slender, in the context of island- and sovereignty-related assets and income.
Keywords: assets, budgets, .tv (dot tv), development, entrepreneurship, governpreneurship, income, revenue, sovereignty, subsistence, Tuvalu
© 2015 – Institute of Island Studies, University of Prince Edward Island, Canada
Introduction
Most all visitors to Tuvalu have heard of .tv1, Tuvalu’s country-code Top-Level Domain name (ccTLD). Part of the internet’s domain naming system, .tv was assigned in the 1980s by the Information Sciences Institute at the University of Southern California, the forerunner of IANA, the Internet Assigned Names Authority. IANA manages domain names such as ccTLDs, number resources such as internet protocol addresses, IP assignments such as name and number registries, etc. Without IANA, the internet would not function as we know it and .tv would probably not exist. News of .tv first found a general audience in the late 1990s. It has been written about widely, often inaccurately, and has been a persistent source of myth-making. Only the effects of climate change have given Tuvalu more worldwide media exposure.
Baldacchino & Mellor (2015) have examined what they call the phenomenon of .tv. Driven by government involvement, they suggest that a state form of entrepreneurship in the years Tuvalu has managed the .tv asset (not The .tv Corporation) could be a key factor behind its success as a source of government revenue.2 I discuss this possibility, including the public administration of .tv, its numerical weight as a source government revenue, the media’s role in building .tv awareness, and the suggested roles played by politicians and public officials in managing the .tv asset.
1
Elsewhere, also written as dot tv, dottv and dotTV.
Corrections and clarifications
Some material unrelated to .tv is inaccurate, or would benefit from additional information that I assume was not readily available to the authors. The following discussion is not inclusive.
Tuvalu is one of five atoll states, including Tokelau, a New Zealand Territory. Official records indicate tsunamis have never hit the Tuvalu group due to seafloor topography, with mean depths of 5,000 to 5,500 meters. Never permanently inhabited prior to 1949, beginning in the late 19th century traders intermittently lived on Niulakita to produce copra and exploit its guano (Nia, 1983). Describing Tuvalu as perhaps an excellent example of primitive socialism
or possibly island socialism seems somewhat archaic in a predominately modern context. In any event, the vast network of extended families, including dependencies, is the overwhelmingly dominant social network and safety net, more so than church groups, island communities, NGOs, and other institutions, whose social roles are important but different from those of the extended family.
The brief notes on tourism skip over more complicated issues, challenges and costs. Though it has never been a government priority, Tuvalu tourism is promoted by regional organizations with government consent, and promoted on locally-sponsored and independent websites. Tourism could be a viable growth sector, something it has not been in the country’s four decade history. Plentiful evidence suggests it will not be anytime soon, either. To attain real growth, the sector will need a prominent, sustained and disciplined government vision; large infusions of capital and labour; government incentives (loans, tax holidays, land availability, etc.); enforceable (and enforced) legal frameworks; a genuine wherewithal to attract foreign direct investment; a climate more friendly to business (and profits); secure property leases; attuning a culture not always business or customer-service oriented; as well as other requirements. At present, the Tuvalu government lacks the basic means (or will) to license certified tourism operators, tour guides, and other service-related professionals.
and marketing of .tv – the country’s own commercial corner of the Internet landscape – to guarantee the country better internet access, and related infrastructure and support.)
The labour export market for Tuvalu’s merchant seamen has collapsed in recent years, no longer employing “15% of adult males”. The number of seamen on active overseas contracts is now well below 100, down from highs of 400-500 in the late 1990s. Seafarer remittance income at its peak was A$2-4m per year, not A$10m, as cited in Shen & Binns (2012) and Wu (2013). Although tangential to the discussion, as a comparatively high cost, marginal supplier of seafaring labour, international labour competition has been slowly forcing Tuvalu seafarers out of the market. The steady decline of Tuvalu’s maritime training institute (TMTI) may also be a contributing factor, as well as competing increases in government wages and other sources of household income, such as non-seafarer remittances.
Tuvalu does not export frozen fish, and has never done so commercially.3 Copra exports ended in the mid-2000s, steadily declining from a peak of 680 tons in 1984.4 The first year of zero copra exports was recorded in 1998. Semi-regular annual government cash subsidies of various amounts propped up the copra industry beginning in 1980 (ADB, 2002, p. 205). The highest ever annual production subsidy was 56% in 1984 (A$382/ton), the same year production peaked, a clearly predictable result.5
Annual fish license revenue has been reported separately in national budgets since the 1980s (see Table 3 for 2006-2015 estimates). Historically, fish license revenue has been the largest source of recurrent government financing (see Table 3), not the second largest as cited in Siaosi et al. (2012) by Baldacchino & Mellor (2015).
Tuvalu’s national budget in recent years is close to US$30m, not US$14m, even allowing for depreciation of the Australian dollar.
Subsistence and related issues
Baldacchino & Mellor (2015) discuss a number of issues related to subsistence. In doing so, they unintentionally expose a broad range of misconceptions – and bad data. Lifestyle choices in Tuvalu are changing more rapidly than most existing literature would suggest. This could be the result of poor observation, suspect data collection by official sources, or both. In recent years, estimates seem habitually retrofitted to squeeze inside a subsistence box.
First, the authors assert that there is no formal unemployment, implying the formally employed can seamlessly revert to informal (and equally productive) subsistence employment (Mellor, 2003 & 2004). This is, of course, at odds with official unemployment data. The current nationwide unemployment rate is 40%, aged 15 years and older, out of an economically active total labour force participation rate of 59%6 (Tuvalu Govt, 2013b). I acknowledge that traditional measures of unemployment are notoriously hard to interpret in the context of Tuvalu’s economy. Standard unemployment definitions can be unsuitable or problematic fits, meaning application and interpretation can be difficult. But to say that all people can revert to subsistence ways “whenever they choose” is a stretch for what might be
3
This is distinct from fish caught in Tuvalu waters by distant water fishing nations under licensing agreement.
4
Other sources cite 1979 and 1983 as the years of peak copra production, with 680 tonnes roughly the mean between the two. The reason for the different years and cited production volumes is not readily apparent.
5
This can also be a desired result if the objective is a (mostly) direct welfare transfer to copra producers, not the actual production of copra. The economic and social pros and cons of this objective extend beyond this discussion.
6
true for the 40% that live in the outer islands. Even that segment of the population would struggle if entirely dependent today on subsistence food production. Doing so would cause varying degrees of hardship if it meant reliance on pure subsistence diets that lasted indefinitely. Reverting to largely subsistence ways of living is absolutely untrue for the country’s 60% that reside on Funafuti, who are heavily dependent on imported foodstuffs to meet their dietary intake. (Currently, there are 38 large, medium and small retail stores on Funafuti that sell imported food only, up from less than ten only a few years ago.)
Food consumption on Funafuti far exceeds subsistence production, and has for many years. Even a theoretical increase in subsistence production could not meet demand. The population is too large and there is no available land to put into food production. The atoll has a limited carrying capacity that is already under strain, causing unwanted environmental side effects. Increased food production, if it was even possible to any significant degree, would amplify impacts already affecting Funafuti’s fragile ecosystem, problems such as excess nutrient leachate.
Dietary preferences for most of the population – almost four times larger than 100 years ago (Tuvalu Govt, 1980a, p. 2) – have been permanently changed by imported food. The idea of “subsistence affluence” (Fisk, 1982), cited by Baldacchino & Mellor (2015), is a very broad generalization. Their discussion of local food availability and abundance paints an overly simplistic picture. Examples, with my explanatory notes added, include: fish (abundant); shell fish (consumed in small quantities); birds (rare on Funafuti, protected in some areas, usually restricted to special occasions on the outer islands); pigs, chicken, and ducks (none are raised for daily consumption7); home-grown vegetables such as sweet potatoes, pumpkin (very limited and sporadic production, especially on Funafuti, except for pulaka, a root crop, grown in larger quantities); coconuts and coconut by-products (abundant, consumed daily, including for pig food); bananas (relatively abundant but not for daily consumption; production is declining, especially on Funafuti8); breadfruit (seasonal) and other fruit, such as pawpaw (harvested or grown in medium-to-small quantities; more abundant in the outer islands).
From 2001 to 2010, the Tuvalu economy experienced a structural shift away from subsistence production into the cash economy. “Population growth on Funafuti (the centre of the cash economy) grew faster than that of the nation, whereas the mainly subsistent outer islands experienced population declines” (Howe, 2013, p. 4), with both trends dating to 1992. Yet official data continuously shows subsistence production growing, “overstat[ing] the contribution of the informal sector throughout the period.” It takes some effort to arrive at a reliable, coherent set of data. (It is suspected that part of the reason why the data shows subsistence production growing is because Pacific statisticians often adjust their calculating methodologies, which has led to production anomalies in the data. This creates at least two problems: time-series data becomes corrupted and inconsistent because older data is not adjusted, and it masks or distorts underlying long-term trends.)
Unstable small island data sources and unreliable data collection routinely produce odd results for subsistence-based production, employment and other data. Concerns, however, can be overstated. Bad data can push government policy in the wrong direction, but the ultimate effects of misinformation are less clear, especially if the influence of government policy is weak, a common tendency in the smaller Pacific states.
7
Pigs are consumed only on special occasions, such as family/community events and some holidays.
Bad data can, however, wrongly influence aid donor behaviour if donors lean too heavily on it, on those rare occasions when they actually do rely on data. For a country as small as Tuvalu, one might be surprised at the absolute volume of data collected – both good and bad – by the national statistics office, multiple and overlapping regional agencies, and international institutions. Little of it is used to formulate policy or guide aid investment decisions. A frustratingly large amount of data collected does not form coherent, internally consistent time-series data that is the most useful of all. Time-series data (usually covering only a few years) compiled by one agency is often inconsistent with the same time-series compiled by other agencies. These failings, in my experience, are rarely fixed by statisticians working in the field. Box 1 presents a few specific examples of unstable or unreliable data. Further discussion of subsistence-related issues is beyond the scope of this paper.
Box 1: A sampling of subsistence data issues.
•ADB (2006, pp. 18-19) reported that the share of people engaged in fishing/agriculture (and handicrafts) rose from 1992 onwards as food imports grew, admittedly a trend it found puzzling. By 2012, the number of people engaged in agriculture and fishing had fallen from 19% [2002] to 3.8% [Tuvalu Govt, 2013b, p. 33]. Such a large, unsubstantiated variation casts doubts on data accuracy.
•Food imports have risen dramatically over the last 20 years, yet the value of local food production from crops, animals and fishing is reportedly (and counter-intuitively) rising as well, in both current and constant dollars, as reported (possibly unknowingly) by the IMF (2009, pp. 20-21), whereas production should be falling. A static population size means rising food imports should be displacing local (e.g., subsistence) food production. (As mentioned above, this may be one result of varying (and evolving) methodologies used to calculate subsistence production to estimate GDP, perhaps using types of subsistence production not previously counted or thinking up ways that subsistence production had been previously – and allegedly – under-estimated or overlooked.)
•Subsistence food production also has not been offset, according to official data, by quasi-commercial agricultural production of 211 tonnes between 2008-2014, the combined production by Taiwan farms on Funafuti and Vaitupu, growing 40 tonnes of produce in 2014 and averaging 27.8 tonnes annually (ROC, 2015).9
•Who is consuming all this food? Howe (2013) summarizes this conundrum, paraphrased below:
Official data indicate GDP growth was strong from 2001 to 2010, driven by the informal non-market household sector, which grew at a real average rate of 2.3%/yr, while price growth averaged 4.6%/yr. The Government sector experienced real GDP growth of just 1.5%/yr and price growth of 2.3%/yr. The data suggests that Tuvaluans are shifting resources from Government to the subsistence sector. But the reverse is happening. Clearly there is something wrong.
9
The media and .tv
The media attraction of .tv and its perceived impact on Tuvalu is understandable. It began as a feel good story and has persisted as one.10 Though .tv had obvious commercial appeal, the size of its eventual appeal was mostly guesswork. In Box 2 are examples of what was once thought to be the impacts and expected impacts of .tv (selected annotations are in italics, each discussed more extensively elsewhere in this paper). The reality, of course, was different, and far less glamorous. News platforms over the years repeatedly rewrote the same .tv story creating numerous ‘factoids’ that still endure to this day.11
Box 2: Media reports: .tv’s presumed economic & financial impacts.
“[Tuvalu] has also capitalized on its fortunate Internet domain letters of .tv, by selling domain sites to television companies and building an online industry that could bring in as much as A$160 million a year [sic]” (Riley, 2000). By 2002-03, following acquisition by VeriSign, The .tv Corporation gross revenues were well below US$10m/yr. Annual revenue has risen slowly but steadily since, reaching between US$12-14m (2011), but not remotely approaching A$160m a year, or in total. VeriSign was then and later paying Tuvalu a fixed fee of US$2.2m/yr.
“[L]icensing the Internet country code (.tv) for $12.5m, thereby funding the country’s first street lights, the first paved road, and U.N. membership” (Whitty, 2003, p.92). The two reported .tv paid-for ‘firsts’ and UN membership is not accurate (see below).
“[The] much-coveted two-letter top-level Internet domain suffix, .tv, as in ‘Broadcast_Company.tv’, desired by almost every major television broadcasting
corporation in the world.” (Ogden, 1999, p. 455). This common view was more speculation than fact.
“The tiny nation hopes to pay for [relocation to nearby high islands or continents] with the money it banked by selling the rights to its ‘.tv’ Internet suffix for US$45 million to the domain registration company VeriSign” (Shapiro, 2003, p. C6). Both statements are false. Tuvalu did not then (and does not now) plan to use .tv earnings to relocate citizens to safer, higher ground outside Tuvalu, and it did not earn US$45m from The .tv Corp sale to VeriSign. It was US$10m.
“Tuvalu last year [2000] was for the first time able to finance from its own resource a portion of its development budget, including the installation of its first streetlights and the inaugural tarring of Funafuti’s roadways” (Finin, 2002a, p. 24; Finin, 2002b).
“Tuvalu's .tv stands to radically upgrade the country's $10 million GDP… A two-letter piece of virtual territory they vow will earn millions for a country that counts its wealth in coconuts, fish, fresh air, and foreign aid” (Raskin, 1998, p.106).
“[Idealab] has paid the country $18 million. The payments so far have increased the country’s gross domestic product by 50 percent and allowed the government to put electricity on the outer islands and create scholarships for its students” (Black, 2000, p. C2). GDP actually rose 13% in current dollars between 1999-2000 (ADB, 2006, p. 175).
10
In late 2015, another crew – this time German documentarians – is arriving in Tuvalu to film the impact of .tv on the country.
11
None of that increase is attributable to .tv. (Income from .tv is not a factor in calculating GDP, although it can have secondary effects on GDP. Such income is a rent; it does not directly add to economic production. It does produce secondary (indirect) impacts from whatever is produced from such income – e.g., infrastructure, government wage increases – which is reflected in GDP. Revenue from fishing licenses has the same indirect impact on economic production. .tv income, reflected in Gross National Income (GNI) estimates, is a better measuring stick for countries like Tuvalu which have large capital inflows from external income sources – remittances, .tv, fish licenses, the Tuvalu Trust Fund.)
“Tuvalu has already cashed its first cheque of US$19 million [sic] and used it to join the United Nations and the Commonwealth, repair…and finally tar-seal…roads and offer free local and foreign education” (Field, 2000b).
“Idealab figures DotTV can make hundreds of millions, and perhaps billions by selling websites such as www.ABC.tv” DotTV’s minimum payment of $1 million each quarter to Tuvalu makes this the nation’s single-largest source of income (Kaplan, 2000). After 15 yrs The .tv Corporation has yet to earn cumulative gross revenues in the hundreds of millions. Quarterly payments to government in 1999-2001 were $1million, but fell to $550,000/qtr in 2002; .tv was not the single largest source of recurrent national income
(see Table 2&3 below).
“[Tuvalu’s] national budget has doubled since selling its .tv domain…According to its agreement with DotTV, [Tuvalu] receives $1 million quarterly…” (Wheeler, 2000).
Expenditures doubled between 1999 and 2000, shrank by 30% in 2001, and steadily declined thereafter. Tuvalu did not sell .tv: it leased out its management and marketing. The initial agreement with The .tv Corporation paid Tuvalu $1m/qtr from 1999 to the third quarter of 2000. Quarterly payments fell to $550,000/qtr in early 2002 after The .tv
Corporation’s sale to Verisgn, a payment schedule that lasted for 12 years. (With The .tv Corporation in financial distress, Tuvalu agreed to exchange three quarterly payments from December 2000 to mid-2001 for $3m in preferred stock, later sold to VeriSign for $10m.)
“[.tv] will be the single largest source of income for a nation of 10,000” (AP, 2000). It wasn’t then – less initial windfall hype – and isn’t now.
“[Tuvalu’s] Internet dream has paid off with a US$20 million cheque [US$12.5m]…and another US$5 million payment for the first quarter of 2000…That gives every person on Tuvalu US$2,272” (Field, 2000a). The combined payment totaled US$17.5m, not US$25m. No-one received a cash payout.
“With the first $1 million payment the government received, Tuvalu was finally able to afford the $100,000 it cost to join the United Nations” (Wikipedia, 2015). This payment was not the catalyst to join the UN (cost: US$26,000), which was easily within Tuvalu’s recurrent revenue availability at the time (see below).
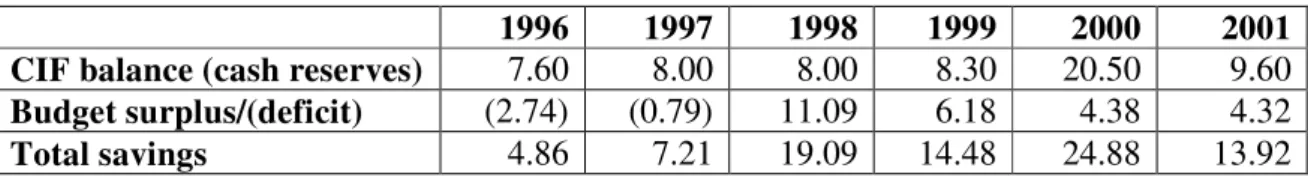
Government savings before and after .tv income
From 1996 to 1999, healthy government surpluses accumulated before the arrival of .tv income, as indicated in Table 1 (in 1996-97 all surplus revenue was held in the Consolidated Investment Fund – CIF12). .tv earnings were first reported/reflected in the 2000 national budget, though expectations may have had some effect on the 1999 budget by blurring official
12
attempts to omit the influence of expected .tv income. .tv windfall revenue eventually had a major impact on total savings but did not fund appropriated expenditure prior to fiscal year 2000. (The estimates cited below do not consider financial policy issues that govern the operation of the CIF as a repository of accumulated savings, or related budgetary issues. The estimates are, however, indicative snapshots of the government’s overall financial position.)
Total savings shown in Table 1 is cash on hand that remains as available finance after appropriated expenditures are factored out. Capital project expenditures made immediately prior to .tv income are discussed below.
Table 1: Surplus government revenue/income (A$m).
1996 1997 1998 1999 2000 2001 CIF balance (cash reserves) 7.60 8.00 8.00 8.30 20.50 9.60
Budget surplus/(deficit) (2.74) (0.79) 11.09 6.18 4.38 4.32
Total savings 4.86 7.21 19.09 14.48 24.88 13.92
Sources: Tuvalu Government (1996-2002); TTFAC (1997-1998, 2000-2001); Tuvalu Government (2007b).
Notes: Estimates are derived from publicly available information. They are calculated based on actual year-end estimates from Government budgets or from TTFAC reports; derived using proxy data from the same sources if actual estimates are not available; or, in a few cases, forecast data based on partial actual estimates. Data limitations forced certain logical assumptions to be made. The government’s financial year ends on December 31.
Capital expenditure myths
Early on, a variety of relatively costly government capital expenditure was thought to be the unique result of newly acquired .tv income. From 1998 to 2001 and later, .tv income was commonly credited with, for example, reconstructing and paving the 19.6km Funafuti road network, rebuilding underground utilities, electrifying the outer islands, funding the country’s first streetlights (actually first installed in 1989) – the list goes on. On the ground, things were far more nuanced.
From 1997 to 1999 government-financed capital projects were authorized, begun, completed or partly completed independent of .tv income. These include: (1) a new embassy in Suva, Fiji (cost: A$858,000, completed 1999); (2) community fishing centres on four outer islands (including construction and outfit – freezers, generators, icemakers), plus retrofits on two other islands (cost: A$1.3m, completed 1999/00); and (3) primary school renovation on five outer islands (cost: A$420,000, completed 1999).
Funafuti roads were first paved by the U.S. Army Corps of Engineers in 1991. Funafuti road repair, reconstruction and extension options were proposed by Beca International Consultants Ltd. (1996). The Funafuti roads project was first conceived in late 1998, and approved by Cabinet in mid-1999. Causality between conception and approval to rebuild the Funafuti road network and .tv income is weak, with initial financing decisions made independently of .tv income, which at that point was purely speculative. Government savings had been accumulating for several years due to non-.tv windfall revenue, as indicated in Table 1.13 This led the government to start financing capital projects for the first time beginning in 1998. A similar path was followed that led to electrifying the outer islands, under consideration for years, to use existing domestic revenue, as was construction of community fishing centres and other projects. Budgetary financing is explored further below.
Finance myths
.tv income and other financial windfalls added to the government’s then existing store of surplus revenue. At the time, .tv and fish license revenue, both denominated in U.S. dollars, was further boosted by the depreciating Australian dollar, as well as Tuvalu Trust Fund inflows from un-hedged investments in the U.S. This allowed the government to expand the scope of some projects in the works, proceed with others already planned, and broaden government expenditures generally. The government increased the wage bill, which clawed back inflation-eroded wages, increased or added new public service entitlements, and increased the size of the public service. Whether these wage- and staff-related costs were prudent is a rather complicated matter of perspective, but they were costly, and it could be said paid for by .tv at the expense of capital projects and improvements.
(Raising wages, increasing entitlements, and adding staff can be and usually are permanent budgetary increases, whereas capital projects are one-time expenditures, plus the cost of recurrent maintenance – if undertaken, though it rarely is. If the former are based in whole or in part on one-time windfall gains (which they were), it creates the obvious problem – all else being equal – of unsustainable financing. As discussed below, this is what actually happened, though the problems created – large deficits, accumulating debt – were neither catastrophic nor insurmountable; but the opportunity costs were relatively heavy and unrecoverable. Donor cash bailouts helped out, as did forced capital and non-essential budget cutbacks, and other remedies.)
What .tv income also partly did was soften the effects of capital and non-capital spending (some of it wise, some not so wise) that was rapidly outpacing recurrent revenue and escalating in the immediate post-2000 era.14 From 1986 to 1997,recurrent expenditure hovered around A$10m (in 2006 dollars), with government revenue closely tracking expenditure. In 1998, government revenue significantly increased (see the budget surplus in Table 1), as a result of a historic spike in fish license fees. From 1999 to 2002, revenue continued to be substantially higher than average as a result of higher revenues from both fisheries and .tv. This led to expansionary budgets and unsustainable levels of spending. Higher revenue combined with higher distributions from the Tuvalu Trust Fund (TTF) meant higher pressure on all levels of recurrent expenditure from the late 1990s through the early 2000s.
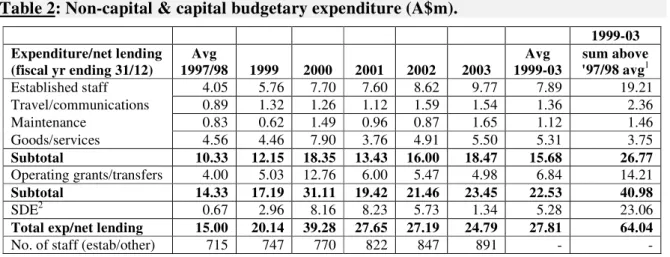
Examples of capital expenditure during this period include: road construction, service upgrades to utility infrastructure on Funafuti (telecom and electricity), and outer island electrification. As shown in Table 2, domestically financed capital expenditure peaked in 2000/01 at A$8.2m (SDE), funded by existing revenue sources and .tv income. Capital expenditures began declining thereafter, but recurrent expenditures did not.
Non-capital expenditures, excluding operating grants and transfers, rose dramatically in 2000 and remained high thru 2003 and later. (Operating grants/transfers from 2000-02 include four TTF investments of A$14m in total.) Table 2 shows when non-capital (non-glamorous) expenditures, including wages, travel/communications, and goods/services began increasing, each trending upward from 1999/00 on, with expenditures on public service staff more than doubling by 2003. Concurrently, the size of the public service increased 25%, from a 1997/98 average of 715 to 891 in 2003. Each class of average core (non-capital) expenditure
14
rose above the 1997/98 average, with staff wages/entitlements rising well above that. The sum of new non-capital expenditure between 1999-2003 totaled A$26.8m, exceeding capital expenditures of A$23.1m. A case could be made that the greatest impact of higher income/revenue from existing sources and .tv during this period was in fact not money spent on capital projects, contrary to received wisdom and widely-held popular belief, but from boosting less tangible recurrent expenditure on new hires, staff wages, travel, and so on.
As the data suggests, it is not possible to assign .tv income or other windfall revenue to specific capital or non-capital expenditures, as the literature would have it, except to make broad observations about the general upward trend (or spikes) in overall government expenditure over a very brief period when .tv windfall income was first received. Direct (or formal) budget claims/linkages on .tv income for capital expenditure projects simply do not exist, regardless of the spirit of intent.
Table 2: Non-capital & capital budgetary expenditure (A$m).
1999-03
Expenditure/net lending Avg Avg sum above
(fiscal yr ending 31/12) 1997/98 1999 2000 2001 2002 2003 1999-03 '97/98 avg1
Established staff 4.05 5.76 7.70 7.60 8.62 9.77 7.89 19.21 Travel/communications 0.89 1.32 1.26 1.12 1.59 1.54 1.36 2.36
Maintenance 0.83 0.62 1.49 0.96 0.87 1.65 1.12 1.46
Goods/services 4.56 4.46 7.90 3.76 4.91 5.50 5.31 3.75
Subtotal 10.33 12.15 18.35 13.43 16.00 18.47 15.68 26.77
Operating grants/transfers 4.00 5.03 12.76 6.00 5.47 4.98 6.84 14.21
Subtotal 14.33 17.19 31.11 19.42 21.46 23.45 22.53 40.98
SDE2 0.67 2.96 8.16 8.23 5.73 1.34 5.28 23.06
Total exp/net lending 15.00 20.14 39.28 27.65 27.19 24.79 27.81 64.04
No. of staff (estab/other) 715 747 770 822 847 891 - -
Sources: Tuvalu Government (1998-1999, 2000a, 2001-2005); AusAID, 2005, Appendix 11, p.3.
1
This is the sum of total new expenditure in excess of average base-year expenditures in 1997/98, assuming flat annual expenditure extending over the period 1999-2003. This means the sum of total additional expenditure per year above the average, e.g., sum = (1999-1997/98 avg) + (2000-avg) + (2001…).
2
Special Development Expenditure, a Government term that (usually) denotes capital expenditure.
While recurrent revenue fell from 2002/03 to 2006, recurrent expenditure remained high; it lagged well behind the fall in revenue for several years; and resulted in large budget deficits. For a brief time recurrent revenue, including .tv windfall income, allowed across-the-board expenditure increases that were ultimately unsustainable. However welcome .tv and other, equally high windfall revenue at the time was, it led to unrealistic long-run revenue expectations, and some bad but understandable (and predictable) short-term political decision-making. Not incidentally, this coincided with the increase in Tuvalu’s cash-based economy referred to by Howe (2013). Easy money from expanding the public sector (and increasing wages) may also have had a negative drag on the importance of remitted seafarer income, kick-starting the long decline in seafarer numbers as more money could be earned locally.
significant and steady source of government revenue, though not as impactful as it is generally perceived to be (see discussion based on Tables 3 & 4).15
The UN membership myth
A common misconception is that the influx of .tv income was the basis upon which Tuvalu decided to join the UN, and commit to the initial upfront and recurrent costs of UN membership, a belief propagated mostly by rewrite journalism and The .tv Corporation’s marketing arm. UN membership was actually quite inexpensive. Joining the UN meant Tuvalu became liable for a yearly fee of US$26,000 plus a US$10,000 contribution for UN peacekeeping (Tuvalu Govt, 2005b). Annual costs vary as the UN regular budget fluctuates, but both expenditures fell well within Tuvalu’s financial means at the time, even without .tv income. Compared to the added benefits Tuvalu accrued from joining the UN, the move could be described as profitable, with financial gains well outweighing the annual cost of UN dollar contributions. The 2005 government study concluded that Tuvalu’s UN mission in New York brought in an additional US$521,000 in new aid assistance (≈A$680,000 at 2005 exchange rates) from 2001-2004.16
.tv income also was not the basis in deciding to operate a full-time mission in New York starting in 2001, including staff salaries, allowances, housing, travel, office support, vehicles and other service and support costs. These expenditures would have been absorbed into the national budget without .tv income. From 2002 to 2004, the UN mission’s annual budget averaged A$499,000 (Tuvalu Govt, 2005b, p. 20; Tuvalu Govt, 2006 & 2007).
(The review of the UN mission was undertaken at the instruction of Parliament, pursued by opposition members who favoured closing the mission after barely three years of operation. Besides political posturing, the opposition’s position was based on the perception that the mission’s high-cost had produced few tangible benefits: a common view at the time. In fact, the study revealed that the opposite was true, both quantitatively (measuring mission returns and productivity) and qualitatively (that of the mission’s broader role and objectives). Also, part of the original UN mission plan was to review the mission’s initial brief and desirability after the mission had been established, and operations had sufficiently matured. The then Parliament MPs who opposed the UN mission accelerated the timetable for this review.)
Understandably, UN membership made possible by .tv income made for compelling journalism and a marketing asset for The .tv Corporation, except that the story was untrue. Tuvalu joining the UN had been discussed for years, but it was not until mid-1999 that Cabinet, led by the then Prime Minister, Ionatana Ionatana, finally took the initiative. After embarking on the practical work of joining the UN (procedures, administrative requirements,
15
There could be questions about government budget data, which I consider mostly reliable, as compared to certain other ‘official’ data that can be highly suspect, as I have demonstrated. Every effort has been made to explain and/or qualify budget data, if need be, especially, for example, if annual data is unavailable for any given year, or if reporting definitions vary slightly over time. Having said that, government budget data is remarkably consistent over long periods of time for major budget items, both revenue and expenditure. This is due mainly to standardized budget classifications, and a continuous revision of annual data until such time as actual estimates are approved. Treasury record-keeping on a mostly real-time basis also has natural advantages over other types of data that is collected only sporadically, often by different agencies, and based on tricky field survey data.
16
etc.) did UN membership begin to fall under the marketing spell of .tv, pursued with obvious and understandable gusto by The .tv Corporation.
(In mid-2015, the Idealab homepage still promoted The .tv Corporation as being responsible for financing Tuvalu road construction, electrification, UN membership, etc. After so many years, this promotion not only seemed stale; it also continued to miscalculate events. The website, coincidentally, got a recent makeover: .tv has been dropped from the Idealab homepage, now featured elsewhere on the website, no more or less prominently than other past and present start-ups, .tv having not been part of the Idealab stable of companies for the better part of 15 years.)
Other .tv issues
Baldacchino & Mellor (2015) broadly describe the early stages of the unfolding .tv story. Several items described, however, require some elaboration. The consultant recruited by the International Telecommunications Union (ITU) in February 1998 (A. Van Couvering) to assess the eight initial proposals17 to administer .tv, was himself President of NetNames USA,18 whose main business was ccTLDs. Somewhat thinly justified given all the unknowns (and unknowables) involved, the consultant found all eight proposals deficient. In his report, the consultant provided a disclaimer that he had engaged in a previous business relationship with one of the .tv bidders, Top Level Registries (Australia). The government subsequently called for a new round of bidding for .tv. Not surprisingly, NetNames became a bidder for the rights to administer .tv in the second round held in July. Van Couvering did not present NetNames’ initial bid in Funafuti – surprising many at the time for such an important business deal – sending instead a junior NetNames staffer to make the presentation. Van Couvering was present a month later to clarify NetNames’ bid as one of three short-listed firms that made it past the first round of evaluations. Even possessing some initial and confidential information concerning the other proprietary bids, NetNames’ bid was ultimately unsuccessful.19
Baldacchino & Mellor (2015) cite Ogden (1999, pp. 454-455) who states that, as early as 1998, .tv was highly sought after, “desired by almost every major TV broadcaster in the world.” This early in the unfolding story of .tv, and subsequent international media attention, such a proclamation is largely inaccurate. Although most recognized the inherent potential of .tv, its market had not yet been established. In these years (1999 and before) no one knew what the market for .tv was, however rapidly events were unfolding. Even those most closely involved in gauging .tv’s prospects – such as those bidding for the rights to lease and market the .tv domain – were relying on guesswork: some of it informed, some not. Anything else at that time was speculation. Though the demand for .tv was presumed to be significant, this does not mean that “every major broadcaster in the world” wanted a .tv domain address. In fact, few broadcasters were actually aware of .tv or how it could be used for product branding. One may recall that, at that time, most media outlets were still grappling with how best to use their internet presence, develop their own online vocabulary, as it were, and develop their media product online. And many internet-based services, dependent on hardware technology and software applications now taken for granted, such as video streaming and other elaborate media content, did not yet exist, were in their infancy, or bandwidth was either insufficient or
17
Originally ten; two were withdrawn.
18
At the time part of NetNames International (London, UK).
19
far from widely available commercially. In 1998, one of the bidders for .tv approached the Disney Corporation, one the world’s largest media content providers, to gauge its general interest in .tv. The response was lukewarm: Disney Corp. was unsure what to do with a .tv domain, and doubted it carried much potential as a media tool. By year-end 1998, .tv domain name pre-registrations numbered only 156. Very few were big multimedia firms. The most well-known (mostly US) were Fox Media, TVN, Showtime Networks, Playboy, Lifetime Television, Oracle, E.W. Scripps Company, USA Networks, and Coca-Cola (Howe & Ponton, 1999, pp. 19-22).20
Other sovereignty-based rents and revenue possibilities
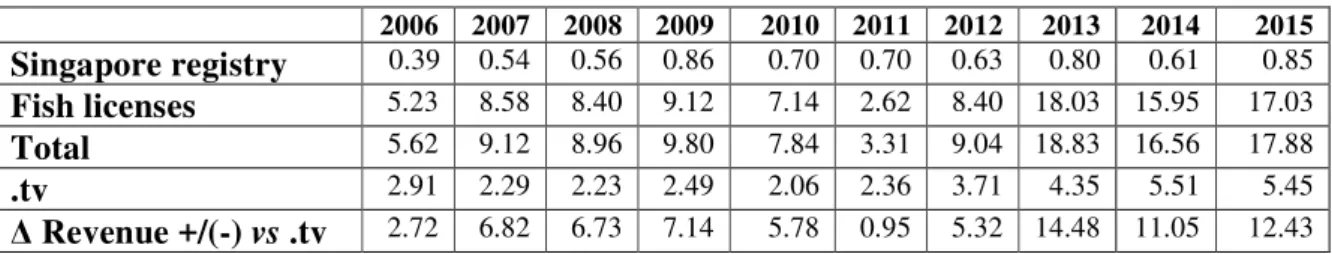
Baldacchino & Mellor (2015, p. 275) state that no other sovereignty-related revenue initiatives tried over the years have been as “…dramatic, durable, and lucrative as .tv.” This is mostly inaccurate. The authors also broadly describe Tuvalu’s overall external income landscape, which misleads on a few specifics (2015, p. 276). For example, government income from the Singapore-based ship registry21 and fish licenses (under bilateral and multilateral agreements) are important sources of government revenue, as shown in Table 3, with revenue from fish licenses consistently double that of .tv, and in some years triple .tv income. Like .tv, ship registry and fish license revenue are sovereignty-related.
Table 3: Select revenue sources (A$m).
2006 2007 2008 2009 2010 2011 2012 2013 2014 2015 Singapore registry 0.39 0.54 0.56 0.86 0.70 0.70 0.63 0.80 0.61 0.85
Fish licenses 5.23 8.58 8.40 9.12 7.14 2.62 8.40 18.03 15.95 17.03
Total 5.62 9.12 8.96 9.80 7.84 3.31 9.04 18.83 16.56 17.88
.tv 2.91 2.29 2.23 2.49 2.06 2.36 3.71 4.35 5.51 5.45
∆ Revenue +/(-) vs .tv 2.72 6.82 6.73 7.14 5.78 0.95 5.32 14.48 11.05 12.43
Sources: AusAID, 2005, Appendix 11, p. 3; Tuvalu Government (2006, 2007a, 2008-2012, 2013a, 2014-2015).
Notes: 2006 ship registry actual est. n/a. Est. based on average 2005+2007 actuals. 2007-10, 2012-13 and 2014 (ship registry) are revised actual estimates; 2011 are preliminary estimates, actuals not published; 2014 fish licenses and .tv estimates are actual; 2015 are approved budget estimates. All other data is approved actual estimates.
Preliminary/projected estimates are indicative of actual values (when revised). 2011 estimates had not been converted to actual estimates as of 2015 (Tuvalu Government, 2013a; 2014; 2015). For these specific budget lines, there is typically no significant variation between preliminary and actual estimates, even accounting for US$/A$ exchange rate variability/volatility, and other factors. Approved budget estimates (not actuals) can overestimate expected revenue as often as they underestimate it.22 It is true that income from
20
Howe & Ponton (1999) provided the most comprehensive – and only – review and analysis of the licensing agreement with Informaiton.ca during its first six months of operation. No other study of its type was conducted up to and including the eventual deal with VeriSign, Inc., nor has one been conducted in the intervening years. A legal assessment study of the draft agreement with Idealab was conducted at the request of the government by UN ESCAP, whose findings and recommendations were largely ignored (UN, 1999).
21
Run on behalf of the Tuvalu Government by Sovereign Ventures (SV) Pte Ltd. The SV ship registry launched in 2004.
22
fish licenses, though robust for ten consecutive years, is inherently uneven and unstable (fish catches naturally vary from year-to-year; tuna is a migratory species not confined within Tuvalu’s EEZ). (The new, so-called Vessel Day Scheme should result in lower income volatility from fish licenses since catch size is not a variable in the calculation. There is still variability in US$-A$ exchange rates and assigned fishing days to Tuvalu; but the main sources of variability will likely have been removed.) It is equally true that, over time, revenue from fish licenses (the largest source earned from the US Multi-Lateral Fisheries Treaty) has consistently outperformed income from .tv. Though both can be said to be the largest sources of annual government revenue/income, roughly as high as annual average TTF distributions to the CIF, annual fish license earnings have outperformed .tv every year since 1999, except 2000 and 2001 when Tuvalu received the two .tv windfall payouts. If factored out, recurrent fish license revenue has been significantly higher for 12 consecutive years, and 15 of the last 16; only in 2003 did fish license revenue fall below that from .tv.
From 1999 to 2014, income from .tv totaled A$104.4m (US$56.9m).23 Less 2000 and 2001 windfall revenue (US$22.5m), the total recurrent (quarterly) .tv income for the same period was A$63.1m (US$34.4m). Fish license revenue for the same period totaled A$131.4m, more than double .tv and 26% higher if the two windfalls are factored out (AusAID, 2005, Appendix 11, p. 3; Tuvalu Government, 2000-2006, 2007a, 2008-2012, 2013a, 2014-2015).
Annual cash grants from the Republic of China (Taiwan, ROC), used to underpin budgetary expenditure, also exceeds income from .tv, averaging A$5.1m per year since 2003 – .tv averaged A$3.1m. Donor grants are typically classified separately in fiscal accounts, not counted as domestic recurrent revenue or investment income but as external finance. For illustration, however, Table 4 shows the relative size of the ROC annual grant compared with .tv income.
Table 4: Annual ROC cash grants vs .tv income (A$m).
2003 ‘04 ’05 ’06 ’07 ’08 ’09 ’10 ’11 ’12 ’13 ’14 ROC grant 6.08 3.92 4.02 4.491 4.20 5.11 6.202 5.42 4.81 4.77 5.17 7.003
.tv 3.36 2.89 2.78 2.91 2.29 2.23 2.49 2.06 2.36 3.71 4.36 5.51
∆ ROC(+) vs .tv 2.72 1.04 1.24 1.58 1.92 2.88 3.72 3.35 2.45 1.06 0.81 1.48
Sources: AusAID, 2005, Appendix 11, p. 3; Tuvalu Govt, 2005-2015; ADB, 2007, p.180; TTFAC, 2006, p. 14; TTFAC, 2007, p. 11.
1
Not including a one-time ROC grant of A$2.6m for extra budgetary support (TTFAC, 2006, pp. 12-13).
2
Preliminary estimate; actual n/a.
3
Forecast estimate.
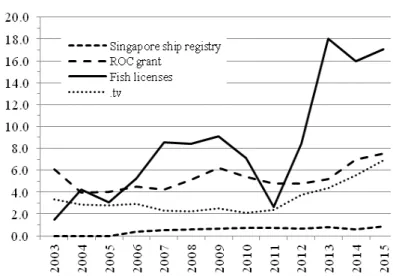
As the data clearly shows, other sources of sovereignty-related government finance are at least as durable as .tv, with the cash value of fish licenses and ROC grants consistently higher (see Figure 1). Aid-funded development grants are not usually classified as sovereignty-derived revenue; however, such grants are sovereignty-related, by definition, and like the yearly ROC grant useful for comparison.
control that can drive revenue downward, and by building in fiscal prudence. Actual revenue higher than the expected budget appropriation is the goal but not always the result. Forecasting is an inexact science.
23
Although the ROC grant and others like it are untied and generally goodwill-based, they could be characterized as anti-sovereignty, increasing direct cash dependence on foreign governments for financial support, separate and unrelated to normal project aid flows. Slippery slope or efficient welfare transfer is an interesting question.
Figure 1: Selected sources of revenue 2003-2015 (A$m).
Sources: AusAID, 2005, Appendix 11, p. 3; Tuvalu Govt, 2005-2006, 2007a, 2008-2012, 2013a, 2014-2015); ADB, 2007, p.180; TTFAC, 2006, p. 14; TTFAC, 2007, p. 11.
Note: 2015 are approved budget estimates or projections.
The alternative economic development discussion
Baldacchino & Mellor (2015, pp. 274-275) discuss examples of alternative paths of economic development that might be suitable for Tuvalu. Cited examples are:
[the] “small island tourist economy” model or SITE (McElroy, 2006), exemplified by the Maldives and its massive tourism development, and the “personnel attraction, resource management, overseas engagement, finance services, and transportation” model or PROFIT (Baldacchino, 2006), exemplified by Singapore and its repertoire of provisions that include a vast service industry plus niche manufacturing. The latter appears more likely to take off in countries that are otherwise devoid of conventional economic resource endowments.
“some supporting infrastructure investment”, this alone would barely scratch the surface of what is actually needed to make broad-based investment decisions. Similar uncomplicated hopes for tourism development were expressed by colonial administrators as far back as 1970 (and earlier) citing in honest, yet almost innocent, simplicity Funafuti’s then abundance of infrastructure, superb natural harbour (“probably the best in the Colony”), ample rainfall and adequate water storage, “[grass] airfield of international dimensions, a hotel [six rooms],” and electricity (GEIC, 1970). Fast forward and, despite these ‘abundant’ assets, which are much more robust today, tourism development still remains elusive.
Baldacchino & Mellor (2015) indicate that it might be possible to develop an export-led industry based on “specialist marine products, such as pearl farming, seaweed farming, and high-value seafood exports, such as fresh fish, crustaceans, and aquarium fish”. The history is not encouraging. These and numerous other marine-based ventures have been tried, failed, or had inconclusive results. The authors rightly note that, while various studies (and projects) have looked at the above opportunities, “nothing [yet] has materialized.” Of those tried, none has proven to be successful and for many different reasons. In Box 3 are examples of mostly failed attempts at developing marine-based exports. Nearly all require some level of foreign direct investment, but over the years no foreign investors have made formal financing commitments (except for sea cucumber harvesting24). Together the unsuccessful initiatives have many common threads that run through them, such as: poor shipping; air transport constraints; markets/consumers too distant; unprofitability; unlikely commercial prospects; lack of wide-scale ground support infrastructure; earnest but weak operations and management support; lack of sustained long-term effort, including a lack of ample and sustained investment backing.
(Two recent fishing joint ventures with Asian companies are not included in this discussion. The IMF [2014, pp. 4 &17] estimates they provide Balance of Payments support of about half of GDP. This accounting is highly questionable and hugely distorts Tuvalu’s real BOP. The joint ventures add little to the government’s bottom line. Average revenue in recent years is equal to 6% of average fish license revenue [≈A$900,000].)
Box 3: Marine-based export initiatives: 1970s-present (not inclusive).
•High-value seafood: Repeatedly tried, all attempts unsuccessful, not commercially viable.
•Frozen fish: Repeatedly tried, all attempts unsuccessful, not commercially viable.
•Gastropods, e.g. trochus shell farming: Broadly known to be a non-commercial
investment; sustained long-term development required; no interested long-term investors; pilot project failed.
•Sea cucumber or beche-de-mer: First tried commercially in 1979, periodically tried again, successful for a short time, small volume/high-value resource base harvested unsustainably and quickly exhausted.
•Aquarium fish: Not yet tried, no proven export potential, high export barriers, commercial prospects nil.
24
•Crustaceans, e.g., lobster, crabs: Not yet tried, surveys indicate resource too limited for commercial export.
•Seaweed farming: Pilot project tried but failed, no commercial export (or domestic) prospects.
•Pearl and clam farming; all bivalves: Very long development phase, trials underway (year 4) but no commercial prospects foreseen.
•Tuna jerky: Tried, shown to have some commercial promise as a niche export product, but failed; quality control issues, production rates too small, lack of sustained effort, investment returns too small.
•Deepsea fish, i.e., ruby, flame and yellowtail blue snappers, and black jacks: Tried in a small export market (Majuro, Marshall Islands), showed limited potential but failed.
•Outer island community fishing centres: Tried but failed; production expectations wildly over-inflated; insufficient support infrastructure; high costs; uncompetitive; zero exported tuna.
•Purse seine fishing: All attempts at building purse siene exports have failed.
•Decorative sea shells; sea shell jewelry: Ad-hoc trials: export markets small & saturated with local product; restricted market access (Fiji); high-value resource base mostly unknown.
•High-value coral (e.g., black coral); coral by-products (jewelry): Not yet tried, resource largely unknown, export potential unlikely except niche possibilities.
•National Fishing Corporation of Tuvalu (est. 1981): All export fishing initiatives
unsuccessful; high costs (O&M); high risk; uncompetitive; operations highly vulnerable to fluctuating export prices; dependent on large government subsidies (in the years it
operates).
Sources: Discussions with fisheries staff (August, 2015; Tuvalu Govt (1978, 1980b, 1984, 1988, 1992, 1995, 2005c); various other source material.
The authors also state that longer term, offshore production of oil and gas and mining seabed minerals might be attractive. I would add only if: (1) undersea hydrocarbons are discovered and in sufficiently large and economically recoverable quantities (none found to-date); and (2) valuable deep seabed minerals are found in quantities worth mining in waters in excess of 4,000 to 5,000 meters (none found to-date). Prospects for deep sea mining at depths below roughly 3,500m, with current costs and technology, face huge obstacles, even at relatively near-shore mining sites. Mining becomes increasingly more difficult, costly and uneconomic the deeper the mineral deposit. Though deep sea mining has vast potential, prospects in Tuvalu’s EEZ are poor. Two primary minerals – manganese and cobalt – are present in Tuvalu’s deep seabeds. Neither is abundant, deposits are low quality and highly scattered (SPC, 2012). Deep sea mining ventures in Tuvalu’s EEZ pose no realistic potential over the long-term.
initiative. It is due to a repetition of past mistakes, donor hubris, as well as the biggest mistake: being unrealistic about the challenges and costs that any marine-based Tuvalu export business must overcome to be successful. Repeating past mistakes, for one, is simply a function of forgetting history, or, its administrative cousin, a lack of institutional memory: an all-too-common and itself repeated pitfall of successive governments and aid donors alike.25
Is the entrepreneurship thesis plausible?
Baldacchino & Mellor’s central thesis is that state-guided entrepreneurship gave rise to the successful administration of .tv (the asset, not the overseas corporation). Evidence to support this – for example, from the behaviour of government officials and politicians – is hard to see, however seductive the entrepreneurship idea might be.
Baldacchino & Mellor (2015) write that luck, smarts and political savvy allowed Tuvalu to capitalize on the potential financial value of .tv. It is true that leasing the rights to manage and market the domain name to investors has resulted in a significant financial boost to the government, for which the country has clearly benefited. (Far less clear is their broader line of reasoning about .tv and Tuvalu’s enviable socioeconomic indicators, for example, mostly poverty free, literacy close to 100%, and so on.)
Baldacchino & Mellor (2015) place their stock in a variation of entrepreneurship called “governpreneurship”, enunciated by Hisrich and Al-Dabbagh (2012), who use the term to describe non-private sector entrepreneurship. This refers to a “combination of inventiveness, ingenuity, and entrepreneurial spirit adopted by governments – often with the guidance of seasoned and trusted senior public servants – to maximize their revenues from sources of wealth derived from their sovereign status” (Azzopardi, 2004; Pirotta et al., 2001). They cite jurisdiction (sovereignty) as a resource (Baldacchino & Milne, 2000) and of government sensibly deploying this resource creatively, even amid controversy. Examples of jurisdiction being exploited by small states include the usual assortment: ship registrations (the pejorative “flags of convenience”), passport sales, citizenship, and leasing phone lines. For varied reasons, these practices concern some people. .tv could well fall into this category, but mercifully it has not. Baldacchino & Mellor cite Crocombe (2007, pp. 163-168), who dismisses such “antics as ‘selling sovereignty and integrity’ as part of the kit of desperate measures taken by chronically vulnerable jurisdictions…”26 I agree here with Baldacchino & Mellor (2015): initiatives such as these are easily defensible. Tuvalu has few options to maximize revenue, certainly not from an expanding tax base resulting from conventional economic growth. Thus, governpreneurship was supposedly the means by which rents from .tv were maximized. Except for these brief summary references, I do not draw a distinction between entrepreneurship, governpreneurship, sovereign jurisdictions, and so on, but I recognize there are conceptual differences. (Some are quite narrow, and to some extent
25
This problem is more pervasive than one would think. Based on more than 20 years of first-hand observation, there is often a near willful avoidance by aid donors to learn from past experience. This includes the lessons of success, as well as failure.
26
rhetorical.) Instead, I focus solely on the role of government in managing the .tv asset and use entrepreneurship as a catch-all term (mostly).
Baldacchino & Mellor (2015) believe that state entrepreneurship is the probable reason behind the success of .tv (the asset, not the corporation). This seems unlikely. Entrepreneurial success in Tuvalu is rare, even adjusted for scale. Also a fragile commodity, lasting entrepreneurial success is rarer still. I can think of no examples of government-led entrepreneurial success. This includes the management of .tv. Such assets are valuable; they earn income; and they require government oversight. But to perform they demand only modest government awareness and administration, as is primarily the case with the largest government asset: the Tuvalu Trust Fund. Management of such assets does not spring from entrepreneurship, however it is defined.
Inheriting an asset provides a convenient analogy. For purposes of this discussion let us assume that the inherited asset has a potential (or paper) value, but no cash value. The inheritor, acting as trustee, has sole control of the asset. In time, the trustee floats the asset and broadly overseas its management, which is undertaken by others. As the asset grows, it produces a consistent dividend. The trustee’s work can thus be broadly characterized as successful. This does not suggest that the trustee is an entrepreneur, has entrepreneurial characteristics, or has the collective non-private characteristics of an entrepreneur (“governpreneurship”). One could say that the trustee provided responsible oversight, performed as hoped, and did no harm.
Tuvalu has been a reasonably good trustee of the .tv asset, returning a steady income and doing no apparent harm. The inheritance comparison captures fairly accurately the Tuvalu government’s oversight of .tv. Very little could be mistaken for entrepreneurship. Could the government have managed the .tv asset better? Perhaps yes, because there has been a lingering perception that it could have done more to maximize returns on the asset’s underlying value. Perhaps no, because the .tv model has unique characteristics involved with the domain name industry with no obvious benchmark or counter-factual alternative to test it; that is – some measure to see if asset returns could have been higher without perfect hindsight. But, if pressed, a compelling argument could be made for the former (without too much debate) had the government been able, willing or more aggressive in its investigation of .tv’s potential commercial value and not let itself be tied to standard commercial confidentiality and non-disclosure agreements with those it does business with. (Tuvalu does, after all, own the asset. Had it been sufficiently motivated, the government could have exercised much greater control over .tv). This meant that the Tuvalu government was unable (or unwilling) to test the market for others interested in managing and marketing .tv. The government has never seriously attempted to open up the administration of .tv to international bidding after the initial false – or failed – start, depending on one’s perspective, stemming from the 1998 licensing agreement, either pre-acquisition of The .tv Corporation by VeriSign, or post-acquisition when it recently had the chance.
offer, which from the start some foresaw as a fishing expedition by Information.ca. (By way of example, Information.ca’s first offer was US$25m. This suddenly – and some might say miraculously – doubled to US$50m a few months later when nothing known or substantive had changed about the market for .tv.) Tuvalu decided it had little choice but to work with Idealab and its investors and eventually accept whatever it decided were the best terms it could get. As the analysis shows, Tuvalu only recently surpassed the original US$50m offer in 2013 (in current non-inflation adjusted dollars) if the two early windfall payments are included. Tuvalu is still US$16m below the original offer, based on quarterly payments 16 years after the fact. By any measure, these are substantial sums of money (US$56.9m and US$34.4m, respectively); but they only amount to about US$5,400 or US$3,275 per capita over the same 16-year period, not exactly sums to put a dent in poverty reduction.
The importance of Tuvalu’s externally-derived revenues cannot be overstated. But issues remain. As far back as 1999, when .tv discussions were in full bloom, the Tuvalu Trust Fund Advisory Committee highlighted a few problems that still exist today, though perhaps not as pronounced as they were then,
The public service has limited in-house professional experience in dealing with complex commercial deals with overseas entrepreneurs; [and] there is a tendency for leaders (both political and administrative) to under-rate the benefits of engaging specialist commercial, legal and technical advice (TTFAC, 1999, p. 20).
In contrast, Baldacchino & Mellor (2015, p. 278) conclude that,
[T]he Tuvalu government really has little alternative to playing the smart governpreneur, maximizing its national revenues by exploiting to the fullest all possible sources of wealth derived from its sovereign status. Through a striking combination of happenstance, gamesmanship, and political initiative, as well as constructive cooperation among politicians, canny public servants, and visionary expatriates…”
This highly stylized characterization rings somewhat hollow, probably giving more credit than credit is due, and in several different directions, masking the real possibility that the .tv asset has been undersold. This does not discount the value of .tv and what the government has capitalized on, but it does broaden the discussion. Whether the .tv asset adds weight to the argument that “should Tuvalu find itself submerged with sea level rise, legal implications preclude the possibility of it ceasing to exist as a sovereign state” (Scholten, 2011, p. 3), this stretches the entire discussion far beyond the plausibility of state entrepreneurship and the likelihood of what .tv itself may well ultimately achieve.
Conclusion
Corporation to Versign – Tuvalu went through two changes in government and four Prime Ministers,27 creating unstable decision-making, continuity setbacks, and leadership issues.
All strategic business decisions (including those of investment, pricing, finance, marketing, management and administration) are in the sole control of The .tv Corporation and VeriSign, whose principal role is to maximize brand value for investors. Tuvalu’s role is narrowly restricted to maximizing its own income from The .tv Corporation through its licensing agreement. It has been able to do this only three times: during the brief phase The .tv Corporation was re-established within Idealab (late 1999/2000); when The .tv Corporation was sold to VeriSign in December 2001 (all key terms and conditions were heavily influenced by The .tv Corporation and its existing contractual links with VeriSign, with some government involvement largely steered through its US-based due-diligence attorneys, whose supposedly fire-walled advocacy could have been brought into question, but was not) and when the VeriSign contract was renegotiated in 2011. In February 2012, VeriSign renewed its contract to manage the .tv registry until December 31, 2021 (Berkens, M., 2012; ICANNWiki, 2015). To be sure, Tuvalu received better terms and conditions from Verisign’s request to prematurely reopen the contract, but negotiations were largely orchestrated by VeriSign. The new contract extends to 2021; the original contract was set to expire in 2016.
2021 will mark nearly a quarter century since Tuvalu last opened the administration of .tv to international bidding. This fact alone indicates Tuvalu’s administration of the .tv asset has been far more static than dynamic, which is not suggestive of success built on entrepreneurial vitality. Tuvalu sold its equity stake in The .tv Corporation to VeriSign as part of the 2001 deal for which it earned US$10m (Berkens, 2012). This equity consisted of 463,678 shares worth US$6.16m in Series B Preferred Stock and Common Stock (referred to as the “Net Merger Consideration”). Tuvalu has no equity in VeriSign. In the 2001 sale, Tuvalu lost its seat on The .tv Corporation Board as directed by VeriSign. In any event, Board seats on corporate subsidiaries are usually weak, in general rarely convene, and would not have given Tuvalu control or power over the management of .tv.
The premise that Tuvalu’s management of the .tv asset (not The .tv Corporation) is the result of successful state entrepreneurship is doubtful – some might even say whimsical. So, if state entrepreneurship is not the reason behind the success of .tv, what is the reason? One could argue the following are more likely explanations: first, simple administrative need and inertia, either by necessity or default (the path of least resistance); second, and relatedly, a ‘cannot miss’ opportunity from the start that required only nominal (and intermittent) government effort for the asset to perform well (nominal effort could be fairly described as day-to-day attention not required – even in the absence of technical expertise, seeming indifference involving complex technical advice, and so on); or third, some combination of one and two, plus other similar or related factors. Taken together, these reasons weigh against the belief that Tuvalu’s administration of .tv is a product of entrepreneurship. This includes the derivative governpreneurship, the different and more charitable state-driven type. Inventiveness, ingenuity and entrepreneurial spirit, if these qualities were ever present, are clearly outweighed by the government’s simple good fortune (.tv itself); the right intentions; the luxury of decision-making untied to performance (job-related), which is untied to short-term financial gain (profits); and, over time, its provision of basic but adequate oversight. Finally, perhaps above all, the government’s long-term staying power. If one can assign .tv