Fundação Getúlio Vargas
Escola de Administração de Empresas de São Paulo
Bruno Gorgulho Rodrigues
INCOME INEQUALITY AND HUMAN CAPITAL
DEVELOPMENT
2 FUNDAÇÃO GETÚLIO VARGAS
ESCOLA DE ADMINISTRAÇÃO DE EMPRESAS DE SÃO PAULO
BRUNO GORGULHO RODRIGUES
INCOME INEQUALITY AND HUMAN CAPITAL DEVELOPMENT
SÃO PAULO 2014
Dissertation presented to Escola de Administração de Empresas de São Paulo of Fundação Getúlio Vargas, as condition to obtain the Master title in Business Administration.
Field of Knowledge:
Inequality and Investments in Human Capital
3
Rodrigues, Bruno.
Income Inequality and Human Capital Development / Bruno Gorgulho Rodrigues. - 2014.
107 f.
Orientador: Julia A. S. Von Maltzan Pacheco
Dissertação (MPGI) - Escola de Administração de Empresas de São Paulo.
1. Capital humano. 2. Renda - Distribuição - Brasil - Indicadores. 3. Poupança. 4. Desenvolvimento econômico. I. Pacheco, Julia A. S. Von. II. Dissertação (MPGI) - Escola de Administração de Empresas de São Paulo. III. Título.
4
BRUNO GORGULHO RODRIGUES
INCOME INEQUALITY AND HUMAN CAPITAL DEVELOPMENT
Dissertation presented to Escola de
Administração de Empresas de São Paulo of Fundação Getúlio Vargas, as condition to obtain the Master title in Business Administration.
Approval date: ___/___/____.
Examination Board:
___________________________________ Prof. Dr. Julia von Maltzan Pacheco (EAESP – FGV)
___________________________________ Prof. Dr. Sergio Goldbaum (EAESP – FGV)
5
Abstract
Human Capital investments are essential for the economic development of a country. In Brazil, several sources point to the lack of qualified workforce as a cause of slower economic growth. This dissertation explores the theoretical linkages made from income inequality to economic performance. The empirical section focuses on one of the theories presented, the one on credit-market imperfections. According to this theory, imperfect credit credit-markets are poor resource allocators and do not allow for low income individuals to invest in their own human capital. In Brazil, there is a lack of empirical studies aimed at testing the channels through which inequality affects growth, therefore this research gains significance. The results presented here were drawn from family household survey – POF – undertaken by the IBGE. Data has evidenced that education investments grow as a percentage of the total budget with raises of income. Raises in income for very high income classes do not increase education spending. The data suggests the existence of a budget constraint for low and middle class Brazilians from all regions. It has been found strong evidence that low and middle income classes in Brazil have limited access to credit-markets. Therefore, there is evidence that redistribution would increase aggregate spending on education.
6
Resumo
Investimentos em capital humano são essenciais para o desenvolvimento econômico de um pais. No Brasil, diversas fontes apontam para a falta de mão de obra qualificada como sendo uma das causas de um fraco crescimento econômico. Esta dissertação explora as teorias que ligam desigualdade de renda com performance econômica. A parte empírica se foca em uma das teorias apresentadas, a de imperfeições no mercado de credito. De acordo com esta teoria, mercados de credito imperfeitos são fracos alocadores de recursos e não possibilitam que indivíduos de baixa renda invistam no próprio capital humano. No Brasil, há uma escassez de estudos empíricos focados em testar os canais através dos quais a desigualdade de renda afeta o crescimento, trazendo significância para esta dissertação. Os resultados apresentados aqui foram obtidos através da pesquisa familiar – POF – realizada pelo IBGE. Os dados mostram que investimentos em educação crescem como percentual do orçamento com o aumento da renda familiar. Aumentos de renda para classes de renda já elevadas não provocam igual aumento nas despesas educacionais. Os dados sugerem a existência de uma restrição orçamentária para Brasileiros de baixa e média renda independente da região. Foram encontradas fortes evidencias de que classes de baixa e média renda no Brasil tem acesso limitado ao mercado de credito. Portanto, existe evidencia de que redistribuição aumentaria o gasto agregado em educação.
7
Content
1. Introduction ... 13
1.1. Purpose of the thesis ...13
1.2. Chapter outline ...14
2. Theoretical framework ... 15
2.1. Fundamental aspects in the theory of inequality ...15
2.1.1. First studies ... 15
2.1.2. Defining measurement standards ... 16
2.1.3. From empirical to theoretical ... 19
2.2. How does inequality affects economic growth? ...22
2.2.1. Multiple factor theories ... 24
2.2.1.1. Social unrest ... 25
2.2.1.2. Political instability ... 26
2.2.1.3. Representative agent issue for democracies ... 27
2.2.1.4. Empirical evidences ... 29
2.2.2. Human Capital formation ... 31
2.2.2.1. Public infrastructure and institutions ... 31
2.2.2.2. Imperfections in credit markets constricting investments... 33
2.2.2.3. Path dependence – from parents to children ... 35
2.2.2.3.1. Fertility rates ... 36
2.2.2.3.2. Parental education level ... 37
2.2.2.3.3. Health, nutrition and basic conditions for human development ... 39
2.2.2.4. Empirical evidences ... 41
2.2.3. Fixed Capital formation ... 42
2.2.3.1. Average savings rates ... 43
2.2.3.2. Rent-seeking ... 44
2.2.3.3. Empirical evidences ... 45
2.3. Perspectives of inequality from Brazil ...47
2.3.1. Origins of inequality and historical dependence ... 47
2.3.2. Debates on the impacts of inequality on growth ... 48
2.3.2.1. Human Capital formation ... 51
2.3.2.2. Fixed Capital formation ... 53
2.4. Conclusions from the Literature review ...55
3. Research motive and value for current literature ... 56
4. Description of data collection ... 57
4.1. POF ...57
4.2. POF Microdata ...60
5. Method, data treatment and general features ... 61
Investment ... 61
Consumption ... 62
8
5.2. Treatment and general features of 2008 data ...67
6. Data analysis and results ... 70
6.1. Expenditure profile per income class in income percentage ...71
6.1.1. National analysis ... 71
6.1.2. Regional analysis ... 74
6.2. Variations of expenditure profile between income classes in income percentage ...79
6.2.1. National analysis ... 79
6.2.2. Regional analysis ... 82
6.3. Credit Market penetration across income classes ...87
6.3.1. National analysis ... 87
6.3.2. Regional analysis ... 93
7. Concluding remarks ... 99
9
List of Figures
Figure 1:The Lorenz Curve and The Gini Index – source:
http://people.stfx.ca/mgerriet/econ241/Gini%20coefficient%20-%20Wikipedia,%20the%20free%20encyclopedia.htm ... 17
Figure 2: Social Utility Curves (Source: Dolan, 1998, p. 45) ... 20
Figure 3: Channels through which inequality affects growth - source: Own illustration ... 23
Figure 4: The impact of initial wealth to future wealth. source: Galor and Zeira (1993), p. 41. .... 34
Figure 5: Fertility rates to different levels of parental human capital – source: Becker, Murphy and Tamura, 1990, pp. S31 ... 37
Figure 6: Human capital investments to different levels of parental human capital (Becker, Murphy and Tamura, 1990, pp. S31) ... 39
Figure 7: Ratio from frontier of inequality to Gini. - source: Risco, 2011, p.64 ... 50
Figure 8: Evolution of education in Brazil - de Souza (2012), pp. 10 ... 51
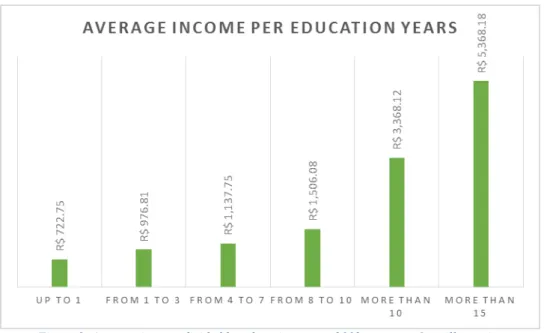
Figure 9: Average income divided by education years - source: Own illustration ... 64
Figure 10: Average education years divided by income classes - source: Own illustration ... 65
Figure 11: Income allocation - source: Own illustration ... 66
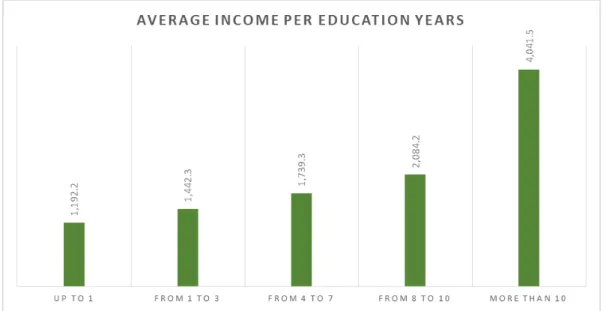
Figure 12: Average income (R$) divided by education years – source: Own illustration ... 67
Figure 13: Average education years divided by income classes – source: Own illustration ... 68
Figure 14: Expenditure and Income - source: Own illustration ... 69
Figure 15: Education expenditures as a percentage of income in diferente regions, 2008 - source: POF 2008, own elaboration ... 78
Figure 16: Variation in expenditure per income percentage between education classes - source: POF 2002, own elaboration ... 80
Figure 17: Variation in expenditure per income percentage between income classes - source: POF 2008, own elaboration ... 81
10
Figure 19: Variation in expenditure per income percentage between income classes /
Northeast - source: POF 2008, own elaboration ... 83
Figure 20: Variation in expenditure per income percentage between income classes /
Southeast - source: POF 2008, own elaboration ... 84
Figure 21: Variation in expenditure per income percentage between income classes / South
- source: POF 2008, own elaboration ... 85
Figure 22: Variation in expenditure per income percentage between income classes /
Midwest - source: POF 2008, own elaboration ... 86
Figure 23: Penetration of credit-markets per years of education, 2002 - source: POF 2002,
own elaboration ... 88
Figure 24: Penetration of credit-markets per years of education, 2008 - source: POF 2008,
own elaboration ... 89
Figure 25: Penetration of credit-markets per income class, 2002 - source: POF 2002, own
elaboration ... 90
Figure 26: Penetration of credit-markets per income class, 2008 - source: POF 2008, own
elaboration ... 91
Figure 27: Credit Card penetration per income class by region, 2002 - source: POF 2002,
own elaboration ... 93
Figure 28: Overdraft penetration per income class by region, 2002 - source: POF 2002, own
elaboration ... 94
Figure 29: Credit Card penetration per income class by region, 2008 - source: POF 2008,
own elaboration ... 95
Figure 30: Debit Card penetration per income class by region, 2008 - source: POF 2008,
own elaboration ... 96
Figure 31: Overdraft penetration per income class by region, 2008 - source: POF 2008, own
elaboration ... 97
Figure 32: Current Account penetration per income class by region, 2008 - source: POF
11
List of Tables
Table 1: General features of population expenditure and income 2002 - source: POF 2002,
own design ... 65
Table 2: General feature of expenditure and income – source: POF 2008, own design ... 69
Table 3: Expenses in income percentage, 2002 - source: POF 2002, own elaboration ... 72
Table 4: Expenses in income percentage, 2008 - source: POF 2008, own elaboration ... 73
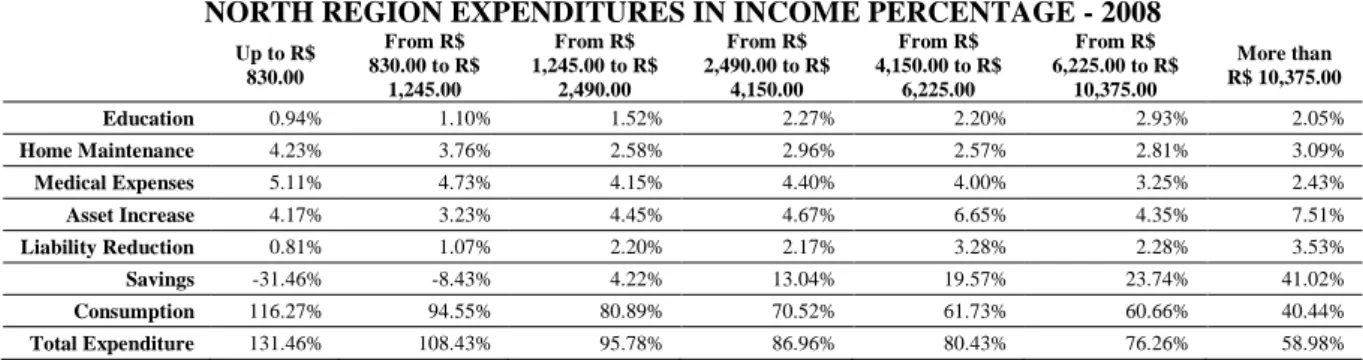
Table 5: Expenses in income percentage, 2008 / North region - source: POF 2008, own elaboration ... 74
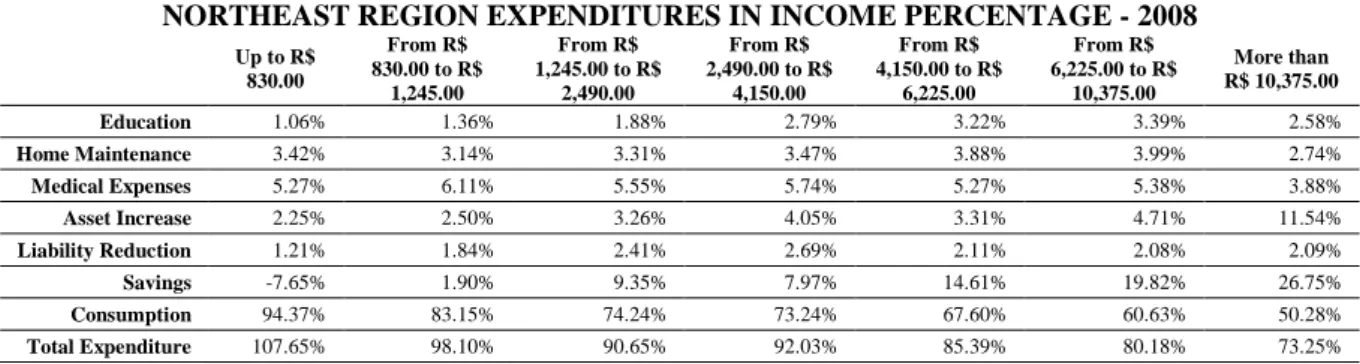
Table 6: Expenses in income percentage, 2008 / Northeast region - source: POF 2008, own elaboration ... 75
Table 7: Expenses in income percentage, 2008 / South region - source: POF 2008, own elaboration ... 76
Table 8: Expenses in income percentage, 2008 / Southeast region - source: POF 2008, own elaboration ... 76
Table 9: Expenses in income percentage, 2008 / Midwest region - source: POF 2008, own elaboration ... 77
Table 10: Correlations between financial tools, income and schooling - source: POF 2002, own elaboration ... 92
12
List of Abbreviations
GDP: Gross Domestic Product
GNP: Gross National Product
PNAD: Pesquisa Nacional por Amostra Domiciliar
POF: Pesquisa de Orçamento Familiar
IBGE: Instituto Brasileiro de Geografia Estatística
IPEA: Instituto de Pesquisa Econômica Aplicada
13 1. Introduction
Brazilian wealth and income inequality has its origins from the country`s conception in the 16th century. Distribution of wealth has been unbalanced much due to the colonial past and not much has succeeded in bringing balance to it. Despite the end of slavery in 1888, still nowadays there is strong polarization of both wealth and income (World Bank, 2012).
Many reasons might have caused the endurance of inequality over the centuries. Some hypothesis have been raised. Rent-seeking behaviour seems to be a plausible cause as Brazilian society appears to endorse benefits to specific groups. Path-dependence is another good hypothesis given the lack of social mobility present in Brazilian society. Institutions fail to bridge the gap and provide equal opportunities, reinforcing path-dependence. Local financial markets are able to host international capital, but one can say they are not fully efficient, presenting another impediment for lower income Brazilians to invest in themselves or their projects.
Brazilian levels of inequality are also present in most countries in Latin America. Therefore, the discussion over the impacts of inequality on economic development should be
of relevance to these economies as well. Despite some growth, Latin American countries fail to become developed in economic terms, income and wealth inequality might be one cause for the
underdevelopment.
According to data from World Bank, 2012, Brazil has the 13th most unequal income in the world ranked by the Gini index. Despite such inequality, Brazil experiences some economic prosperity with the 74th best GDP per capita (World Bank, 2012) – behind countries such as Costa Rica, Venezuela and Kazakhstan. If the theories reviewed in this dissertation are correct, such inequality might be harming economic development and it is of interest to have a good diagnosis on the topic.
1.1. Purpose of the thesis
This dissertation aims at bringing evidence to link Brazil with internationally accepted theories of inequality and growth. More specifically, the theory of credit-market imperfections seems to be relevant in the Brazilian context and should be verified using local data.
14 Empirical studies in Brazil commonly attempt a direct link from inequality to economic growth. This relation is hard to be obtained and does not provide a full picture. Testing for the channels through which inequality might affect GDP growth brings more specific information and improves the diagnosis. An improved analysis allows for public policy to be directed more efficiently and have better results.
Even though there are many Brazilian specificities that do not fit international literature, there is room to apply international models to Brazil. One of the reasons that make such approach of interest is that of verifying the convergence of diagnosis with other countries; similar problems might need comparable policies.
Furthermore, empirical studies in this field commonly use macroeconomic sources of data. This type of data can provide some insights, however, new theories link individual behaviour to aggregate output. Macro variables sometimes lack such information. This dissertation will use household survey, microeconomic data, in order to grasp evidences of the channels through which inequality harms the economy.
1.2.Chapter outline
The names chapter and section are used as synonyms perfectly exchangeable for the benefit of reducing word repetition during this dissertation.
15 2. Theoretical framework
The literature on income inequality has been divided into two parts. The first concerns fundamental aspects of inequality theory. The second concerns the mechanisms through which inequality affects economic growth. This division is relevant given two different approaches to the topic that have been present in different periods of time. Until the middle of the 20th century most studies were empirical and there was a lack of theories linking observed inequality with economic performance. Development theories started to come about from the 1950`s which also brought theories that attempt to explain causality to the debate.
This review starts with the fundamental works, since they are also crucial for the understanding of modern theories.
2.1.Fundamental aspects in the theory of inequality
Fundamental studies have set the ground in the field. Recent developments in the theory lie in the framework set by researchers such as Pareto, Gini and Lorenz. Furthermore, fundamental debates have occurred even after development theories started to discuss the mechanisms. John Rawls and others have promoted qualitative debates over social utility functions and social preferences in more recent times. The relevance of these works is on
increasing the understanding of some fundaments and general features of inequality which might be a matter of preferences, therefore, adjusting the focus of the debate.
2.1.1. First studies
First studies in the field of inequality are empirical and try to provide evidence that could give a perspective over the level of inequality. This topic begins to gain some predominance by the end of the 19th century. At that time data was scarce and there were no consensus on standards of measurement.
16 Frederick Hawley (Hawley, 1888) entered a debate with Atkinson over his conclusions. For the period of 1890`s they have performed several studies pointing out to imperfections on each other`s calculations of the distribution of the product in the USA. For the sake of exemplifying, some features found by Atkinson which were questioned by Hawley are 10% savings rate of income by capitalists as well as an issue of double counting in the estimation of national product. Their results are not as relevant to the literature in present times, on the other hand, their effort into estimating such distributional features gave birth to debate on the topic of inequality.
Another researcher who attempted to estimate the distribution of production was Vilfredo Pareto. His work has been more successful in providing overall features of inequality. His research is still influential nowadays not only for his attempts but also for his findings.
Pareto (1896) used data of tax payments from several countries such as Switzerland, Germany and Peru amongst others. This information was the closest to actual household data that one could find at that time. His data set allowed him to find that the distribution of income followed an 80-20 rule of thumb independently of country or size of the economy. This meant that about 20% of the population would generate/earn roughly around 80% of income.
Furthermore, such behavior should repeat within subclasses. For example within the 20% group that earns 80% of income, around 80% of their income would be generated/earned by 20% of those people.
Pareto`s findings are of such relevance that he began to define the next step into the theory of inequality and social preferences.
2.1.2. Defining measurement standards
First standards on the measurement of inequality came about due to their success in accurately portraying inequality. The first challenge for researchers, interested in the topic of inequality, was to obtain data that could tell something about the actual distribution of product. As it was explored on section 2.1.1. Pareto (1896) was able to provide substantial evidence of the distribution of income. With data in hands, debates over how to portray and measure that information started to come about.
17 His solution is to first arrange individuals by their income in order from lowest to highest income. Secondly aggregate income from the lowest to the n individual. (e.g.: the lowest income individual has income equal to 1, the second lowest has income equal to 2. Aggregate income at individual 1 equals 1 and aggregate income at individual 2 equals 3.). From this treated data Lorenz (1905) plots what has come to be known as the Lorenz curve. He always portrait both values in percentages of the total.
Lorenz`s formulation has the purpose of providing better visualization of most features of income inequality. Despite its success in revealing the main features of inequality in a single graphical representation, alternative methods have been studied focused in allowing for other features to be noted. Social mobility is an example that Lorenz`s formulation is incapable of identifying and that called for alternative methods.
Nevertheless, the Lorenz curve is widely used and the most relevant formulation so far. From its concept arises the most commonly used index of inequality – the Gini index.
Gini (1912) performs a study on variability. One of the many mathematical formulations developed in this study has later been used in order to create an index for inequality. The variability measured by the Gini index is between a curve of ideal distribution and the actual
distribution in a country. The ideal distribution is one where all individuals receive the same income. The actual distribution is given by the Lorenz curve.
Figure 1:The Lorenz Curve and The Gini Index – source: http://people.stfx.ca/mgerriet/econ241/Gini%20coefficient%20-%20Wikipedia,%20the%20free%20encyclopedia.htm
Figure 1 provides the graphical representation for the Lorenz curve as well as the Gini index. Population is shown as a percentage from the one with lowest income to that of highest
18 terms adding income up to the specific individual. This standard set out by Lorenz and Gini are relevant for the literature up to nowadays.
Such framework has established a standard on how to portray the data. The topic of standards of collection, however, has been perfecting ever since the work of Pareto (1986). Most standards had been established by the middle of the 20th century when data started to be collected by international development agencies.
The work by Kuznets (1955) is known as pioneer in presenting a theoretical relation between growth and inequality. His works is mostly known from the creation of the Kuznets hypothesis. Despite his main contribution to the literature be due to his hypothesis, his work has also provided insights in the standardization of data collection. He specified such rules of collection as part of his empirical work that resulted in his theory. These rules were already established by that time and it reflects standards of collection that were formed over the years by several researchers. He has set out the following rules:
(i) relevant income is family income to avoid people with zero income (dependents) or people with excessive income that would not correspond to actual spending features; (ii)measures should cover an entire country rather than segments of it;
(iii) income should be only for full-time employees not to complicate the picture with retired or students who would distort interpretations;
(iv) income should be defined as it is in the specific country – excluding income in capital gains, all received in kind, before and after taxes, etc - ;
(v) units must be grouped by “secular” levels of income, to avoid cycles or other temporal disruptions.
For the purposes of analyzing the Brazilian population definition (ii) might not be necessary. His intention is to aggregate all individuals that coexist in a single economic environment, however, there is evidence of regionalization in Brazil (present later in the literature).
Definition (iii) also might not fit for the Brazilian reality. Many workers, mainly low income, have more than one job in order to complement the salary which might be half-time. Furthermore, students or retired individuals do help complement income in households. This feature is also a critic to definition (i) that constraints the inclusion of complementary income by other family members.
19 Definition (v) makes more sense in the the time of Kuznets (1955). He is concerned with earnings that oscillate each year. This is a relevant mainly for agriculture related businesses which are dependent on weather conditions and other variations. This point`s importance is lessened when you take urban or hired individuals, not self-employed.
The Pesquisa de Orcamento Familiar (POF), household survey used in this dissertation, follows many of these specifications as they have become standards of data collection. For example, it uses the income of the person of reference and do not add complementary income. The empirical works mentioned so far have formed the backbone of the literature on income inequality. The standards reviewed here are also in the structure of recent literature.
Kuznets (1955) is a pioneer study in linking empirical data with some theory. He provides standards of collection in order to research on causes for observed shifts in inequality. By doing that, his work became groundbreaking in providing a link between empirical works and theoretical studies.
2.1.3. From empirical to theoretical
Theoretical studies came about from the empirical works developed mainly in the first
half of the 20th century. From this surge in theories we find two different goals. Some researchers tried to clarify the channels through which inequality and growth are related.
Meanwhile, others were concerned with the qualitative aspects of inequality.
Qualitative assessments over inequality have been coming about since Pareto (1896). His concept of Pareto optimum set out qualitative feature over an otherwise purely descriptive fact. All different qualitative concepts towards social preferences can be portrait as social utility curves. The classical works, influenced by philosophical ideologies of its times such as liberalism or utilitarianism, have emphasized on the quality of Pareto improvements. Social utilities, however, were never taken as consensual.
Social Utility curves indicate social preferences. This consideration is qualitative, not allowing for comparison of better or worse amongst societies – each one will have their own preference.
20 Dolan (1998) classifies these curves as: UR – Ralwsian, UC – Convex, UB – Utilitarian, UI – Concave. Rawlsian curve is derived from the max-min criterion mentioned in Rawls (1974). UC and UB are intermediary cases between extreme equality (UR) and extreme inequality (UI).
Figure 2: Social Utility Curves (Source: Dolan, 1998, p. 45)
Rawls (1974) has debated over the relevance of the max-min criterion as a solution for unfair asset and bargain power distribution. The max-min criterion is the social utility function representation of his concept of social fairness. He states that the max-min social utility curve means that “…the natural distribution of abilities is viewed in some respects as a collective
asset” (Rawls, 1974, p. 145). He is focused at balancing randomly inherited skills that would
create an unfair society. The max-min criterion transforms this unequal distribution of talents into a collective asset by forcing for the improvement of the well-being of the individual worse
off.
Rawls (1974) was so influential as to have, nowadays, his notion of social fairness
denominated as Rawlsian. The other forms of social utility have been drawn as a consequence of other economic fields that could provide a qualitative reasoning over the distribution of product. Curve UB, for example, derives from John Stuart Mills` utilitarianism which was developed before data on the distribution of income was available.
21 So far much has been debated about income inequality. Even the Rawlsian perspective takes mainly income into consideration. The notion of equality of opportunity, argued by Sen (1997), contends weather or not income inequality is too narrow of a concept.
Sen (1997) argues that the focus of the discussion on income inequality is misleading. He points that economic inequality is a broader concept which should be the focus of the discussion when concerning the well-being of citizens.
The difference between both concepts is in the surrounding environments of an individual. For example, one disabled person will have higher expenses just to perform the same regular activities as a healthy individual. In order to consider them as equal in terms of well-being it is necessary to take such inherent costs into consideration.
Sen (1997), pp. 385, describes 5 different types of contingencies that “…lead to systematic variations in the conversions of incomes into the distinct functionings we can achieve, and that affects the lifestyles we can enjoy."
Personal heterogeneities are natural differences in age, gender, disability or illnesses that makes people`s needs diverse, requiring different amounts of income to compensate for them.
Environmental diversities account for rainfalls, floods, temperature ranges, that account for different material needs and, therefore, have to be taken into account when comparing income.
Variations in social climate refers to the access to public security, health, education as well as the level of social interactions which can be interpreted as social capital. These social interactions provide a background from which material well-being is obtained and better social
climate makes it “cheaper” for the same goals to be obtained when compared to a worse social
climate.
Differences in relational perspectives are the various perspectives that individuals have over success depending on their society. Sen (1997) has given the example of poor individuals
in rich societies wishing they could “appear in public without shame”, which would require
more income. Meanwhile, individuals who are poorer in absolute terms but live in an overall poorer society do not suffer such shame and can achieve good social status and self-fulfillment with lower levels of income.
22 surrounded by transfers of money and consumption from one individual to another, similar to donations from one to another. Therefore, for both authors, household income denotes better the well-being of an individual than individual income would.
Sen`s (1997) considerations are of extreme relevance for developing countries such as Brazil. High levels of inequality, originated from historical reasons, have a way to reinforce themselves. The aspect of income and well-being, therefore, relates to more than just an economic analysis, it is part of a social analysis.
2.2.How does inequality affects economic growth?
Classical literature has developed a framework of measurement and collection which evolved from empirical studies. First theories on inequality were focused on the qualitative aspects of it. Especially since the 1980`s literature has been focused on explaining the channels through which inequality affects economic growth.
Many empirical studies have been performed trying to link inequality and growth directly. Their results are inconclusive with some articles pointing to positive effects and others to negative ones. This uncertain result about the direct link between inequality and growth has
fostered the debate about channels through which inequality might affect economic growth. Some of the effects of inequality seem to be beneficial for growth while others are not. Figure
23
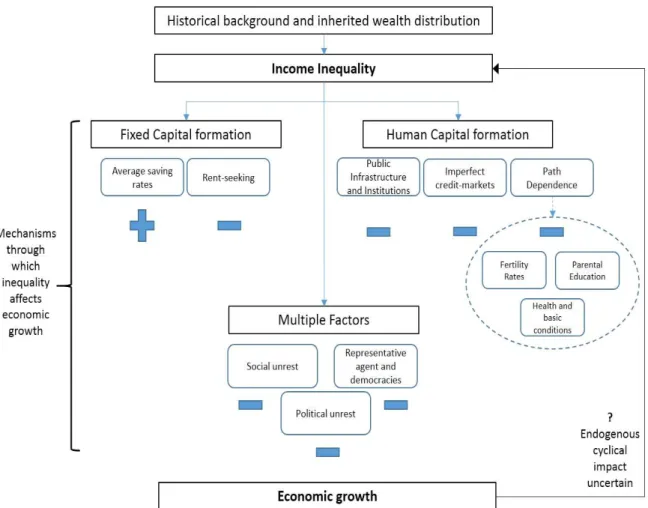
Figure 3: Channels through which inequality affects growth - source: Own illustration
The diagram in Figure 3 presents the channels according to the production factor each one influences. This form of organization follows the idea that GDP is a sub-product of capital and labor. Other factors that influence GDP would also be a consequence of capital and labor
– such as technology.
Channels such as social and political unrest, and the representative agent issue, end up pressuring both human and fixed capital development. Rent-seeking and average savings rates interfere with the formation of fixed capital. Imperfections in credit-markets, lack of public institutions and path dependence end up damaging human capital development. All of these factors independently influence economic performance in their own particular manner. All these channel are going to be reviewed in this section of the dissertation.
Other studies have organized the debate in alternative manners. Studies such as Barro (2000) and Thorbecke & Charumilind (2002) have laid out other frames for the literature on the channels from inequality to growth.
24 Sociopolitical Unrest and the fourth discusses the Saving Rates. His frame emphasizes on the similarities between political and social unrest placing them both under Sociopolitical unrest. It also places path dependence as a condition which can be surpassed when these other four channels are functioning well. For example, the lack of education from parents could be surpassed by good public policies (that follow the Political Economy debate) as well as perfect credit-markets.
Thorbecke & Charumilind (2002) perform their review according to the chronological order of the studies. They divide the debate into three main frameworks. The classical approach,
modern approaches and the “unified” approach.
The classical approach concerns the theory of savings rates which was established by Kaldor in 1956, being one of the first theoretical works on the field.
Modern approaches started to come about in the decades of 1980 and 1990. They concern theories of rent-seeking, political economy, imperfect credit-markets, etc.
What Thorbecke & Charumilind (2002) calls of “unified” approach was developed by Galor (2000) where he has set out a two-step characteristic to economic development. In the first step fixed capital is predominant for economic development and inequality would foster
growth. In the second step, more developed, human capital is the main engine for growth and inequality would harm economic growth.
These studies reveal different ways to organize current literature. They all encompass the same theories, revealing a consensus about which theories are relevant to the current debate. Furthermore, both studies (Barro, 2000, and Thorbecke & Charumilind, 2002) emphasize the relevance of the credit-market imperfections theory as one of the main channels through which inequality harms human capital investments.
So far, this overview has focused on theories about the channels that link inequality and growth. These theories are now going to be explored in details.
2.2.1. Multiple factor theories
Literature on the channels through which inequality affects economic growth has been divided according to affected production factors. Theories reviewed under this chapter develop a reasoning in which both human and fixed capital are affected.
25 Representative agent issue for democracies also deal with the impact of inequality in the political process. Differently from the surge of political unrest, here the shift in the electorate`s preferences occurs in the existing institutional framework while political unrest causes a disruption with existing institutions. In an unequal democracy the average voter, or the representative agent, tends to be poorer and his preferences might push democratic results for inefficient redistributive public policy.
This section will first go about political and social unrest theories emphasizing on their differences, thirdly the issues on representative agents are going to be explored.
2.2.1.1.Social unrest
Social unrest can be seen as the igniter of both political unrest and representative agent issue. Social unrest differs from political unrest when the instability it causes is not expressed under political dissatisfaction. It differs from the representative agent perspective when social frustration is not expressed through voting.
Several studies put both theories of social and political unrest together as they do not emphasize the distinct methods through which unrest affects existing institutions. Empirical
studies tend to differentiate depending on the variables chosen to measure instability.
The impact of instability in political decision making has been formalized in quantitative
models. Social unrest, however, is linked through a logical argument focused at the reduction in institutional security.
Alesina & Perotti (1993), p. 3, explain the different approaches to socio-political instability in two different existing paths in the literature. “The first one emphasizes executive
instability. The second one is based upon indicators of social unrest and political violence”. The
first one is defined as “the propensity to observe government changes”. The second “does not focus directly on executive changes. Socio-political instability is measured by constructing an
index which summarizes various variables capturing the phenomena of social unrest.”
Therefore, social unrest is treated more as a phenomena than a formal theory.
This dissertation denominates the first approach as political unrest and the second approach as social unrest.
Alesina & Perotti (1994), p. 362, explore the link between inequality and social unrest.
“A large group of impoverished citizens, facing a small and very rich group of well-off individuals, is likely to become dissatisfied with the existing socioeconomic status quo and
26 insurgence of instability. However, the logical argument seems to stand when faced with empirical testing.
Formal links between inequality, social unrest and economic growth are usually tested under the channel of political instability or representative agent. Sub-chapter 2.2.1.2. explores political instability and sub-chapter 2.2.1.3. representative agent issue.
2.2.1.2.Political instability
On the channel of political instability some formal theoretical linkages have been presented by Edwards & Tabellini (1991) and Alesina, Ozler, Roubini & Swagel (1992). Edwards & Tabellini (1991) have defined political instability as the probability of government in office to not remain in power on the next term. Their definition allow for instability to be present in working democracies.
An alternative definition provided by Alesina, Ozler, Roubini & Swagel (1992), p. 3, as
“… the propensity of a change in the executive, either by “constitutional” or “unconstitutional” means.”. Their definitions are very similar in the sense that political instability is defined by the chance of existing government to not remain in power. The main implications of such feature
are that public policy ends up short sighted and increases investment uncertainty.
Alesina, Ozler, Roubini & Swagel (1992) do not present the various arguments of this
channel in a formal model. They name three existing hypothesis. The first is that uncertain investment environment is formed in the presence of political instability. The second is the tendency for public policies to be either short sighted or disruptive in the presence of political instability. Those in power have incentives to make policies that will harm growth for future periods when other parties are likely to be empowered. The third argument focuses on the weakness of government when it is faced with instability about its political future. Such environment increases bargain power of lobbyists or other rent-seeking activities due to the weakness and uncertainty of ruling governments.
Rent-seeking theory will be revised independently since it affects mainly fixed capital formation. Its stronger impact is in private appropriation of public capital, endangering private property rights.
27 and causing inflation. Finally, they introduce a probability of continuity in the executive power in the next term.
Their model finds an unstable political system to lead to inefficient government. This instability leads the government to accept a more wasteful governing apparatus. An inefficient tax system leads to more seignorage which disrupts economic growth due to higher inflation and higher distortionary taxes.
Intuitive reasons for the decrease in the effectiveness of the tax system are, for example, that tax evasion may be welcome to those who disagree with current government. Furthermore, a legislative majority might also enforce an inefficient tax system in order to constrain the behavior of future governments.
Alesina & Perotti (1994) explore the link between growth and political instability through a review of other studies. They emphasize on the different formulations of political instability and reviews empirical articles according to their methodology. They find mainly two ways to perform tests on political instability.
The first method uses probit econometric models. These models have as dependent variable a binary response – in the case of political instability theory is commonly used the
occurrence of coups d`etat (governments being overthrown). Independent variables can be binary, discretionary or continuous. This way allows the use of all the social and political variables that would compose an index in their original form and relate them to a dependent variable of interest. There is no need to input weights that would require further framework or justification. The creation of an index is the second common formulation.
The second is through the development of an index. This proxy is constructed through the weighted grouping of several variables related to sociopolitical instability, such as riots, political demonstrations, assassinations or number of changes of executive in power. The formulations vary and the composition of the index (named Sociopolitical index – SPI) is up to the researcher.
SPIs are wide in their form and are very common for the measurement of social unrest. Some studies construct SPIs that encompasses both political and social unrest. As it was mentioned in section 2.2.1., there are many similarities between both theories.
2.2.1.3.Representative agent issue for democracies
28 as poor median voter theory. This name refers to the predominance of poor voters in a democracy which might lead to sub-optimal policy making in aggregate economic terms.
Voting preferences seek to maximize an individual`s own utility as defined in terms of consumption. Wealth and income patterns influences voting preferences. Theory points out that poor median voter would vote for redistributive policies which are distortionary and harmful for economic growth. Representative agent issue is when the representative agent in a society has incentives for policies that benefit him exclusively and harms the aggregate output. This theory resembles that of rent-seeking in the sense that inequality can form groups of individuals which struggle for private benefits in detriment of social well-being.
The main theoretical frameworks follow two different formulations.
Bertola (1991) develops a model where growth is set by the accumulation of physical
capital. There are two types of individuals, the “rentiers” and the “capitalists”. The former has
all income from labor, his income is prevenient from “non-accumulated” factors. The latter has all income from capital.
His model divides all individuals into two classes in order to analyze the dynamics of wealth accumulation by a part of society. This way, he uses utility functions to explain optimum
savings rates for each class and their consumption. In his model, “capitalists” save while “rentiers” do not. This dynamic happens to shape an unequal society where median and average
(or aggregate) voter have distinct interests.
Aggregate voter is a social representation of the preferences of the whole economy as if it was one single organism. The median voter represents the preference of an individual voter who is the most representative in number in that society.
In such dynamics Bertola (1991) finds that the median voter will demand for taxation
in capital incomes given the polarization between “rentiers” and “capitalists”. Such laws
damage property rights as well as distort free market economy (Thorbecke and Charumilind, 2002, pp. 10) harming economic growth.
29 In this formulation inequality affects the democratic process in a harmful way for economic development when the median voter is poorer than the average voter. The median and the average voter denominations used here have the same definitions as before. When median voter has lower income than the average voter, there will be predominance for redistributive policies. On the other hand, when median voter has higher income than the average voter, the tendency is for no redistributive policies.
Persson and Tabellini (1991) have included redistributive policies` costs in terms of the loss of efficiency translated into lower GDP growth. This feature ends up causing that societies with higher average income tend to increase the cost of redistributive policies and, therefore, discourage these policies. The equilibrium ends up considering the difference between average and median voter`s income as well as loss in efficiency that leads to lower GDP.
Both models find that inequality affects economic performance the most the wider the distance between average and median (or aggregate and median) is (with median being lower than average).
2.2.1.4.Empirical evidences
The three topics of this chapter – Social unrest, Political instability and Representative agent issue – deal with political problems that arise from the social unrest caused by high
inequality. It is important to verify what some empirical studies have found about such theories and hypothesis.
Alesina and Perotti (1993) tested the hypothesis of sociopolitical instability using data from 70 countries in the years between 1960 and 1985. They have grouped both social and political instability in the creation of an SPI (index). As discussed before, a usual method for empirical testing on Social unrest and Political instability is to form the index using both social and political variables. Their SPI is formed using the method of principal component, weighted sum of a selection of components.
Alesina and Perotti`s (1993) SPI is formed by the following components as described in their study. (i) Number of politically motivated assassinations. (ii) Number of people killed in conjunction with domestic mass violence. (iii) Number of successful coups d`etat in the selected period. (iv) Number of unsuccessful attempts of coups d`etat. (v) A dummy variable which is
“0” in democracies, “0.5” in semi-democracies and “1” in dictatorships.
30 their sample are Japan and Argentina. Japan presented a much lower level of instability compared to countries at the same development level in 1960, thirty years later “…this country
is one of the richest in the world” (Alesina and Perotti, 1993, p. 7). Argentina has the second
highest SPI in 1960 and has “…dropped several steps in the income ladder” (Alesina and
Perotti, 1993, p. 7).
While Alesina and Perotti (1993) finds that sociopolitical instability is related to lower growth, Edwards and Tabellini (1991) provide one possible linkage between political instability and growth.
Edwards and Tabellini (1991), using data from 71 countries between 1971 and 1982, found political instability to increase the use of seignorage. This mechanism is one of many through which instability affects growth. Their regression was not performed through the use of an index. Alternatively, they have regressed seignorage as GDP percentage against several independent variables. One of such variables captures the changes in the governing party. This is used as the proxy for political instability. They find instability to increase the use of seignorage.
On the theory of representative agent we find empirical evidence in the work of Alesina
and Rodrik (1994).
Alesina and Rodrik (1994) used two sets of samples between the years of 1960 to 1985
– one of OECD countries and another with OECD plus 24 developing countries. They regress as dependent variable the amount of redistributive taxation and test the effect of inequality (both income and wealth) as independent variable.
The variable used to represent the amount of redistributive taxation is capital taxation. They discuss the impossibility to accurately form a variable that captures all forms of redistributive taxation.
The variable used for income inequality is the Gini index available for all of the studied countries. For wealth inequality they use a sample of land distribution as a proxy.
They found both forms of inequality to impact positively the introduction and extent of redistributive policies here measured by capital taxation. Furthermore, land inequality has a bigger impact than income inequality. Growth is found to be negatively correlated to the introduction of such forms of taxation.
31 have found slightly different results. Nevertheless, the theories explored in this chapter find support in empirical studies.
2.2.2. Human Capital formation
This chapter goes about the channels through which inequality affects mainly the formation of human capital. Some channels have formal theories while others rely on logical reasoning and some empirical testing.
The theory on the impact of institutions to social development is not specific for the case of inequality. It does provide an explanation for some aspects of path dependence and imperfection in credit markets. Some of the causes of inequality could have their damaging effect reduced if institutions were in place.
The theory of credit-market imperfections is fairly recent. Its first formulations date from the end of the 1980`s. Nowadays, it is one of the most widely accepted theories on the negative impacts of inequality on economic development (Barro, 2000, Thorbecke and Charumilind, 2002). Much of the traditional argument about economic development and inequality relies on the assumption of perfect markets. However, when this assumption is
questioned it comes that some essential features of inequality, such as lack of collateral or income, become an entanglement to investment.
Factors that are reinforced from parent to children have been grouped under the chapter on path dependence. They encompass features that are characterized by a vicious cycle. Parents are sometimes incapable of providing an environment more suitable for the development of their children because they did not have that for themselves. These features end up reinforcing inequality and underdevelopment.
As mentioned earlier, institutions are an external factor that can interrupt the vicious cycles of path dependence or can bridge market inefficiencies. Therefore they are the first topic reviewed.
2.2.2.1.Public infrastructure and institutions
32
game”, meaning the set of commonly shared understandings or rules that will define payoffs
and individual results. The second is a part of the institutional framework, organizations act as players in the game of economic transactions. Some players, such as the government, introduce public infrastructure depending on the payoffs laid out by existing institutions. Therefore, the decision of investing in public infrastructure comes from the payoff set out by institutions.
North (1991) justify the need for institutions when wealth-maximizing individuals do not have full information or when cooperative games are not repeated or they have an end. Under these situations, individuals will not have the incentives to undertake productive activities in order to achieve wealth-maximizing goals. Therefore, institutions shape individual payoffs.
Institutions exist in formal and informal settings. Formal institutions are those formed by constitutions, laws, property rights. Informal ones are sanctions, taboos, customs, traditions and codes of conduct. (North, 1991, p. 97). Despite institutions being an external force to individual decision making, they are endogenous to a society. Such endogeneity makes it difficult for underdeveloped societies to depart from a sub-optimal institutional framework.
Sub-optimal institutional framework, in the sense of not providing incentives for
productive activity, will define payoffs that can result in household under investment. Human capital investments might arise naturally if all returns from human capital investment can be easily and surely acquired.
Therefore, good institutions shape individual decision making into productive activities. Furthermore, they shape the behaviour of public organizations which will affect income inequality and public infrastructure. Sen (1997) has focused on the notion of economic inequality and the impact that public institutions can have on it.
Departing from the institutional perspective of shaping individual payoffs, Sen (1997) debates what can be accurately denominated as equality. An accurate concept helps define the goal of public infrastructure. Therefore he aims at institutional changes towards economic equality. His definition has been explored in chapter 2.1.3., he states that individuals who present some physical or emotional handicap require extra income in order to make their existence equal to those who do not have them. These needs must be attended by institutions in order to provide equality in opportunity. Institutions must balance the payoffs so that governments can offer infrastructure in order to bridge such needs.
33 factor. Sen (1997) is concerned about how these exogenous factors should be directed by public institutions.
These theories, of institutions and public infrastructure, are debated at this moment because many of the channels which will be explored under this section argue on the concept of path dependence and poverty trap. Institutions and public infrastructure are exogenous factors that can take societies out of such trap. Therefore they are relevant as they provide a solution for diagnosed cases of path dependence.
2.2.2.2.Imperfections in credit markets constricting investments
The model by Galor and Zeira (1993) reviewed for this chapter receives especial attention to its mechanisms due to the focus of this dissertation on the theory of imperfect credit markets.
Efficient credit markets function as a resource allocator from savers to borrowers. They should find which investments can pay highest returns with lowest risks and make capital available. If financial markets work well, aggregate savings will be efficiently allocated allowing for low income individuals to invest even if they do not have savings. If, on the other
hand, they do not perform fully efficiently than important investments will not be funded. The work by Galor and Zeira (1993) is cited as the proponent of credit-market
imperfections theory (Thorbecke and Charumilind, 2002, Barro, 2000). Their definition of imperfect financial markets is anytime when there are differences between lender`s and borrower`s interest rate.
The reason for this assumption is because borrowers can evade loan payments by moving to other regions at a cost. Lenders can, also at a cost, enforce the debt payment. Such costs generate the discrepancy between lender`s interest rate and that of borrower`s. Lenders receive r and borrowers pay i, with i > r.
They have simplifying assumptions that could be worsened without damaging their conclusions. Their model allows for free access to international financial markets by any individual. There is no population growth, individuals have one offspring and one parent. They divide a lifetime in two generations and utility is drawn from own consumption and bequests left for one`s children. These simplifications do not harm their conclusions as all of them would most likely be less favorable in real life, backing their reasoning.
34 influence the cost and payoff of investing in becoming skilled or not. Their model finds thresholds dividing individuals in four different categories. These threshold is the basis for their theory.
In their model, they find initial wealth to influence investment decision making due to thresholds in behavior varying with initial wealth. This threshold is set out by an indivisibility of human capital investments and is the minimum amount possible to be invested. This indivisibility consists of some investments coming in unities, such as a book or tuition fees.
Two thresholds arise from the level of initial wealth. The lowest bound separates individuals who do not invest in human capital at all. This fact occurs because their initial wealth is too low to pay for borrowers` interest rate and still have higher final wealth with skilled labor`s wage – the utility in the final period of staying unskilled and landing at interest rate r is higher.
Between low and high threshold are located the individuals who borrow to invest in human capital. An intermediary point divides those who will succeed in leaving their offspring with more wealth than their parents and those who will leave their children with less wealth despite investing in human capital.
The third group above both thresholds have enough wealth to be lenders and invest in human capital.
Two assumptions in their model allow for Galor and Zeira (1993) to conclude that imperfect credit markets constrain human capital investments. The first is that some investments are indivisible. The second is that there is a natural cost to curb defaults (the reason why credit-markets are imperfect).
35 Figure 4 portraits the thresholds mentioned and sum up the conclusions in Galor and Zeira (1993). In the x axis is wealth at period t, in the y axis is wealth at period t+1. Wealth in future periods is a consequence of human capital investments. Therefore, figure 4 provides conclusions that are drawn from the theory of imperfect credit-markets and the dependence on initial wealth. For individuals with less wealth than f, the equilibrium wealth for his dynasty is
at 𝑋̃𝑛 and there is no investment in human capital. Individuals with wealth below g do invest in
human capital, however their dynasty end up at equilibrium point B with wealth 𝑋̃𝑛. Individuals
with wealth above g invest in education and find equilibrium at 𝑋̃𝑠. Point h marks where
marginal returns on human capital investment becomes decreasing, which allows wealth to converge at a maximum point (the value of h means the minimal unitary investment in human capital – therefore those with less wealth than this point need to borrow in order to invest).
Galor has later further improved the explanation provided by the channel of imperfect credit-markets. Galor (2000) has divided societies according to their developmental stage. He makes use of development theories which differentiate the need for fixed or human capital depending on existing GDP per capita. He states, based on previous empirical studies, that developing economies rely more on fixed capital and would benefit from inequality. Nevertheless, in order to complete the transition into developed a society requires widespread human capital and a strong middle class. His work, therefore, attempts to provide a joint view over the several channels discussed mainly in the 1980`s and 1990`s.
Despite further advancements, the original concept of the model is given at Galor and Zeira (1993). It is strongly defined by its two assumptions of (i) indivisibility of human capital investments and (ii) imperfect credit-markets. The nature of indivisibility of an investment will hardly be changed, therefore he aims the solution in bringing more efficiency to credit-markets or dividing wealth more equally.
Such wealth constraint generates path dependence and keeps dynasties at a poverty trap. Other concepts of path dependence are the subject of the next sub-chapters.
2.2.2.3.Path dependence – from parents to children
Path dependence theories deal with the concept of poverty trap. In their understanding,
36 Path dependence theories reinforce the relevance of the introduction of exogenous factors to the development of individuals. Theories such as imperfect credit-markets and the institutional theory refer to exogenous factors shaping the environment so that individuals can escape the poverty trap.
2.2.2.3.1. Fertility rates
Perotti (1996), in his review of the literature on the fertility rates argument, relates fertility theory with that of imperfect credit-markets. In a simple way, imperfect credit-market theory states that lower income individuals do not have full access to credit and, therefore, forego human capital investments. Fertility rates theory would have a very similar effect as the one described above due to restrictions on the number of dependents. If in a given household total human capital expenditures is constrained by the budget, than controlling for the number of children will make for higher education expenditures per dweller. Quoting Perotti (1996),
pp. 153, “In an optimizing model, investment in education and fertility would be strictly
connected because they can be interpreted as two alternative uses of the parents` human capital: the former, in the quality of the immediate descendants; the latter, in their quantity”.
For the argument on fertility rates it is important to investigate two theoretical frameworks that link fertility to a process of rational decision making.
The one developed in Becker and Barro (1988) defines a dynastic utility function – with the assumption of the existence of altruism from parents to their children. Their analysis is based on decision making which takes into account the individual`s own consumption levels as well as his successors`. The decision of how many children does a couple want to have is taken by the tradeoff between costs of raising the child versus expected consumption levels of that child. The costs are divided amongst direct costs and opportunity costs. Direct costs tend to be somehow indifferent to the parents` own level of human capital since they consist of living expenses. Opportunity costs, on the other hand, vary – being higher for more educated parents whose time is assumed to be worth more money due to better paid jobs.
37 also, uncertainties related to future income, mortality, etc. Below, Figure 5 reveals how fertility responds to human capital of the parents for a given scenario:
Figure 5: Fertility rates to different levels of parental human capital – source: Becker, Murphy and Tamura, 1990, pp. S31
Figure 5 reveals high fertility rates for parents with low human capital. This feature, if taken along with the budget constraint on household investments, reduces human capital investment per dweller. This graph is the result of the theoretical model, the gap in the middle is caused by the discontinuity between societies in a poverty trap and developed ones – they follow different equations when dynasties are capable of, by themselves, invest and obtain returns that increase their wealth unlimitedly.
In other words, fertility rates theory relates parental human capital to the decision of having children. This theory formulates that the tradeoff for low educated parents is higher by having more children, this fact ends up reducing human capital investments per child. This trend reinforces a poverty trap which bounds children`s human capital to that of their parents – generating path dependence.
2.2.2.3.2. Parental education level
An individual start forming its own human capital from early ages. In the period from childhood to adulthood the amount invested depends on decisions from parents or responsible adults. Parental educational level is one out of several reasons why a child does not receive enough investments in its own human capital. In a family where adults have very little education themselves, there might be a transmission of parental conditions to their offspring – causing path dependence.
38 and consumption. Becker and Barro`s (1988) model is the basis for the one developed by Becker, Murphy and Tamura (1990), the main difference is that the latter takes individual utility functions with parent altruism, while the former takes a dynastic utility function. Becker, Murphy and Tamura (1990) provide more insight on the effect of parental education levels and will, therefore, be used to exemplify this channel.
Becker, Murphy and Tamura (1990) set up a dynastic model with the main goal of analyzing trends on fertility rates and human capital investments. One of their main assumptions is of parental altruism towards their offspring. This assumption explains parental decision to forego own consumption in order to invest in their offspring. Altruism per child decreases with the increase of children per family.
Another crucial assumption is that human capital investments present increasing return rates. They justify that new knowledge benefits from old stocks of education, making it easier to acquire more human capital. Marginal returns are decreasing in very high levels of human
capital. A completing relevant assumption is that investment in education “…uses relatively
more human capital per unit of output than the consumption, child rearing, and physical capital sectors do.” (Becker, Murphy and Tamura, 1990, p. S15). This means that human capital
investments are relatively more expensive than the alternatives.
Both assumptions on human capital investments create two equilibrium points. One with high human capital and another with low, there is no equilibrium with average human capital. This indicates that individuals either continuously invest in education in an attempt to reach high levels or they do not invest in it.
39
Figure 6: Human capital investments to different levels of parental human capital (Becker, Murphy and Tamura, 1990, pp. S31)
Figure 5 reveals the model`s expected human capital investment per child dependent on parental human capital. For a range of low parental human capital there is no incentive, according to their model, for investment in human capital to occur. Only from a certain level of parental education that an amount, inferior to parent`s own human capital, starts to be invested. In this section, the intergenerational model will find its equilibrium at 0 human capital investment since the parents invest less than their own human capital. The break in the middle represents the discontinuity caused by the double equilibrium found by Becker, Murphy and Tamura (1990). From that amount of parental human capital investment on child`s education is
bigger than parent`s own level. Therefore, intergenerational equilibrium leads to highest human capital investment possible.
The results obtained in Figure 5 are independent of other specifications. This model has as fundamental aspect parental human capital. This feature will than determine wages, fertility rates, consumption and investment decisions.
This channel portraits how rational individuals with low levels of education might have incentives to not invest in human capital even if they are altruistic and responsible.
2.2.2.3.3. Health, nutrition and basic conditions for human development
40 Health conditions significantly affect overall economic performance. The impact of health indicators on productive activities is not exposed in formal theories. Logical arguments link those indicators to specific impacts on economic performance – both individual and aggregate. Bhargava, Jamison, Lau and Murray (2001) have grouped the main arguments present in the literature.
One indicator commonly used in the literature is adult survival rate for a period of 5 years. The relevance of such indicator lies on the impact caused by the loss of the human capital gathered in that adult if he dies. In the individual perspective, the dependents of this individual have a significant decrease in expected income which will redefine investment and consumption with a limited budget constraint. Taking the aggregate perspective, this individual had gathered human capital over the course of a lifetime. Such capital is required for the economy to grow and is necessary for the introduction of new technologies which generate economic growth. Besides, his death causes the loss of whatever he produced.
Child mortality is one possible indicator of general health conditions that surround the development of an infant. Such conditions affect the individual capacity to perform his work effectively, several diseases leave the individual handicapped and unable to perform manual
labor. Furthermore, poor nutrition lead to lower learning capability and reduces returns to human capital investment in that individual.
Life expectancy is the broadest indicator mentioned in Bhargava, Jamison, Lau and Murray (2001). It encompasses both adult survival rate and child mortality. It, however, loses explanatory power by disregarding the conditions in which individuals live. Bhargava, Jamison, Lau and Murray (2001), p. 8, give an example on how such indicators do not give all
information required to understand the impact on production: “For example, suppose that due
to poor childhood nutrition, ability of individuals to perform productive tasks diminishes at an early age but, because of easy access to medical care, life expectancy is high. Then productivity loss will be underestimated if life expectancy was used as the sole indicator of health.”