ACPD
10, 26705–26750, 2010Ground-based remote sensing of
volcanic ash
J. Gasteiger et al.
Title Page
Abstract Introduction
Conclusions References
Tables Figures
◭ ◮
◭ ◮
Back Close
Full Screen / Esc
Printer-friendly Version Interactive Discussion
Discussion
P
a
per
|
Dis
cussion
P
a
per
|
Discussion
P
a
per
|
Discussio
n
P
a
per
|
Atmos. Chem. Phys. Discuss., 10, 26705–26750, 2010 www.atmos-chem-phys-discuss.net/10/26705/2010/ doi:10.5194/acpd-10-26705-2010
© Author(s) 2010. CC Attribution 3.0 License.
Atmospheric Chemistry and Physics Discussions
This discussion paper is/has been under review for the journal Atmospheric Chemistry and Physics (ACP). Please refer to the corresponding final paper in ACP if available.
Volcanic ash from Iceland over Munich:
mass concentration retrieved from
ground-based remote sensing
measurements
J. Gasteiger, S. Groß, V. Freudenthaler, and M. Wiegner
Meteorologisches Institut, Ludwig-Maximilians-Universit ¨at, M ¨unchen, Germany
Received: 5 October 2010 – Accepted: 1 November 2010 – Published: 8 November 2010
Correspondence to: J. Gasteiger ([email protected])
ACPD
10, 26705–26750, 2010Ground-based remote sensing of
volcanic ash
J. Gasteiger et al.
Title Page
Abstract Introduction
Conclusions References
Tables Figures
◭ ◮
◭ ◮
Back Close
Full Screen / Esc
Printer-friendly Version Interactive Discussion
Discussion
P
a
per
|
Dis
cussion
P
a
per
|
Discussion
P
a
per
|
Discussio
n
P
a
per
|
Abstract
Volcanic ash plumes, emitted by the Eyjafjallaj ¨okull volcano (Iceland) in spring 2010, were observed by the lidar systems MULIS and POLIS in Maisach (near Munich, Ger-many), and by a CIMEL Sun photometer and a JenOptik ceilometer in Munich. We retrieve mass concentrations of volcanic ash from the lidar measurements; spectral
5
optical properties, i.e. extinction coefficients, backscatter coefficients, and linear depo-larization ratios, are used as input for an inversion. The inversion algorithm searches for model aerosol ensembles with optical properties that agree with the measured val-ues within their uncertainty ranges. The non-sphericity of ash particles is considered by assuming spheroids. Optical particle properties are calculated using the T-matrix
10
method supplemented by the geometric optics approach. The lidar inversion is applied to observations of the pure volcanic ash plume in the morning of 17 April 2010. We find 1.45 g m−2for the ratio between the mass concentration and the extinction coefficient at
λ=532 nm, assuming an ash density of 2.6 g cm−3.The uncertainty range for this ratio is from 0.9 g m−2to 2.3 g m−2. At the peak of the ash concentration over Maisach the
15
extinction coefficient at λ=532 nm was 0.75 km−1 (1-h-average), which corresponds to a maximum mass concentration of 1.1 mg m−3 (0.65 to 1.7 mg m−3). We compare the lidar inversion results to results from an independent approach using sky radiance measurements of the CIMEL in the aureole of the Sun. We find good agreement.
1 Introduction
20
Aerosol particles from volcanic eruptions can have strong impact on the radiation bud-get of the Earth’s atmosphere. Therefore, as soon as the lidar technology became mature in the 1970’s, stratospheric volcanic aerosols over Central Europe have been observed, including aerosols from the major eruptions of El Chich ´on and Pinatubo (J ¨ager, 2005). More recently Mattis et al. (2010) reported on multi-wavelength Raman
25
ACPD
10, 26705–26750, 2010Ground-based remote sensing of
volcanic ash
J. Gasteiger et al.
Title Page
Abstract Introduction
Conclusions References
Tables Figures
◭ ◮
◭ ◮
Back Close
Full Screen / Esc
Printer-friendly Version Interactive Discussion
Discussion
P
a
per
|
Dis
cussion
P
a
per
|
Discussion
P
a
per
|
Discussio
n
P
a
per
|
of different volcanoes. Although the concentration of stratospheric aerosols is usually very low, they can have notable impact on global climate, because of their large scale dispersion and their long residence times which is in the order of months or few years. In contrast, the residence time of volcanic aerosols in the troposphere is only in the order of several days and its spatial distribution can be quite inhomogeneous, so that
5
the assessment of their radiative effects is much more complicated. During the erup-tion of the Eyjafjallaj ¨okull volcano (Iceland) in spring 2010, tropospheric ash plumes were advected to large areas in Europe, which offered a unique opportunity for aerosol science and remote sensing, in particular because, since the start of aerosol lidar ob-servations, this was the first eruption with considerable effects for Europe. Although the
10
Eyjafjallaj ¨okull eruption emitted only small amounts of volcanic ash compared to ma-jor volcanic eruptions in history, quite soon after the eruption, a further aspect beyond meteorology became apparent: The ash particles significantly influenced air traffic in Europe: As a measure of precaution, air traffic was closed in regions with volcanic ash concentrations exceeding certain thresholds (Gertisser, 2010) as it was known that
15
volcanic ash can affect flight safety (e.g., Pieri et al., 2002). However, in the course of the eruption, a lack of operational measurements of mass concentrations was ap-parent. Nonetheless, the European Aerosol Research Lidar Network (EARLINET, e.g., B ¨osenberg et al., 2003) showed the potential of detecting volcanic ash plumes by net-works of active remote sensing instruments (Sanderson, 2010). Reports concerning
20
the dispersion of the plume were provided to the Volcanic Ash Advisory Centers on a hourly to daily basis.
For the assessment of flight safety impacts, the distinction between ash and non-ash particles is necessary. Non-ash particles of volcanic origin are usually liquid parti-cles, predominantly originating from condensation of volcanic gases. Ash particles
25
ACPD
10, 26705–26750, 2010Ground-based remote sensing of
volcanic ash
J. Gasteiger et al.
Title Page
Abstract Introduction
Conclusions References
Tables Figures
◭ ◮
◭ ◮
Back Close
Full Screen / Esc
Printer-friendly Version Interactive Discussion
Discussion
P
a
per
|
Dis
cussion
P
a
per
|
Discussion
P
a
per
|
Discussio
n
P
a
per
|
remote sensing measurements of ash plumes, optical properties of ash particles are needed. Measurements of scattering matrices of samples of volcanic ash from dif-ferent volcanoes were presented by Mu ˜noz et al. (2004), but for the interpretation of multi-wavelength lidar measurements, optical properties from numerical simulations are necessary, to cover the backscatter direction and the lidar-specific wavelengths, as
5
well as the variability of aerosol properties.
Volcanic ash plumes from Eyjafjallaj ¨okull over the EARLINET station in Maisach (near Munich) were observed by the lidar systems MULIS and POLIS. Measurements started before the predicted arrival of the ash plume on 16 April 2010. Using these lidar systems a comprehensive set of optical properties of the volcanic ash was
de-10
rived. These optical aerosol properties include the backscatter coefficient at three wavelengths, as well as the extinction coefficient and the linear depolarization ratio at two wavelengths.
The aim of this paper is to derive microphysical properties of the ash from these lidar measurements, considering the non-sphericity of the ash particles in the retrieval.
15
Special emphasis is on the mass concentration, because it is a critical parameter for flight safety. The optical characterization and the temporal development of the volcanic ash plumes over Maisach is the topic of a separate study (Groß et al., 2010). Continu-ous lidar measurements show that the maximum of the Eyjafjallaj ¨okull ash plume over Maisach in terms of backscatter coefficient occurred in the morning of 17 April 2010,
20
thus the focus of this paper is on that date. It should be emphasized that in-situ mea-surements of the mass concentrations are not available for 17 April. The first airborne in-situ measurements over Germany were provided only on 19 April (Schumann et al., 2010b). Thus, the inversion of lidar data is the only option to retrieve mass concentra-tions in the German airspace for this most relevant stage of the Eyjafjallaj ¨okull episode.
25
ACPD
10, 26705–26750, 2010Ground-based remote sensing of
volcanic ash
J. Gasteiger et al.
Title Page
Abstract Introduction
Conclusions References
Tables Figures
◭ ◮
◭ ◮
Back Close
Full Screen / Esc
Printer-friendly Version Interactive Discussion
Discussion
P
a
per
|
Dis
cussion
P
a
per
|
Discussion
P
a
per
|
Discussio
n
P
a
per
|
measurements of a ceilometer prove the similarity of vertical and temporal aerosol distributions in Munich and Maisach (25 km distance).
The paper is organized as follows: First we give an overview of the Eyjafjallaj ¨okull activity and the meteorological situation. In Sect. 3 we describe our lidar systems and our approach for the inversion of mass concentrations from lidar data. The inversion is
5
applied to lidar measurements of 17 April. The next section is devoted to the consis-tency check of the lidar inversion results by using Sun photometer measurements. The paper ends with a summary of the findings and conclusions.
2 Volcanic activity and meteorological situation
The eruption of the Eyjafjallaj ¨okull volcano started on 20 March 2010 (Gertisser, 2010).
10
The first phase was characterized by an effusive eruption that produced lava flows on the ground and only minor emissions into the atmosphere. On 14 April an explosive eruption of the volcano started. It started beneath a glacier, which intensified its ex-plosivity because water vapor was produced by the interaction of hot volcanic material with ice. The ash plumes reached heights of about 8 km, thus mainly stayed within
15
the troposphere. The explosive eruption continued with varying intensity for over one month.
The wind field advected volcanic ash to parts of Central Europe. Volcanic ash reached northern Germany in the night from 15 to 16 April (Flentje et al., 2010; Ans-mann et al., 2010) and first traces of ash over Maisach were detected by MULIS at
20
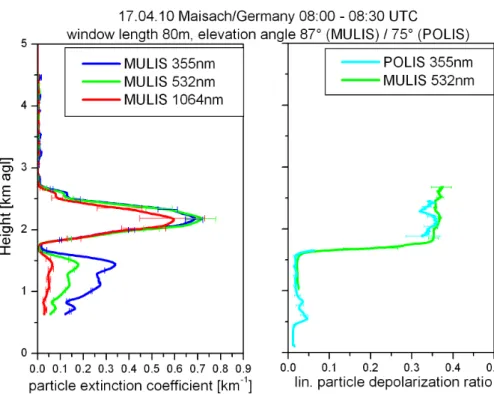
about 17:00 UTC on 16 April between 5 km and 7 km above ground (Fig. 1). The maxi-mum of the ash layer over Maisach, in terms of backscatter coefficient, was observed between 6:00 UTC and 9:00 UTC on 17 April in a height of 2.0–2.4 km. The ash layer was separated from the boundary layer aerosols until the afternoon of 17 April, when mixing of both aerosol types was observed.
25
ACPD
10, 26705–26750, 2010Ground-based remote sensing of
volcanic ash
J. Gasteiger et al.
Title Page
Abstract Introduction
Conclusions References
Tables Figures
◭ ◮
◭ ◮
Back Close
Full Screen / Esc
Printer-friendly Version Interactive Discussion
Discussion
P
a
per
|
Dis
cussion
P
a
per
|
Discussion
P
a
per
|
Discussio
n
P
a
per
|
the volcano to the measurement site took approximately 45 to 50 h. Radiosondes of the German Weather Service (DWD) measured relative humidities in the ash layer in the range from 16% to 41% at 00:00 UTC and 12:00 UTC over Oberschleißheim (ap-prox. 22 km east of Maisach, 11 km north of Munich), indicating that the particles in the observed layer were dry.
5
3 Retrieval of mass concentration from lidar
This section describes the lidar systems, the forward simulation methods, and the lidar inversion approach, which we use for the retrieval of mass concentrations. Finally, the retrieval is applied to lidar measurements of the volcanic ash layer over Maisach at about 2:00 UTC on 17 April 2010.
10
3.1 Lidar systems
We performed range-resolved measurements of aerosol properties with two lidar sys-tems: MULIS (multi-wavelength lidar system, e.g., Freudenthaler et al., 2009) and POLIS (portable lidar system, e.g., Groß et al., 2008). MULIS is a Raman- and depolarization-lidar including channels for elastic backscattering at 355 nm, 532 nm,
15
and 1064 nm, and corresponding Raman channels for the determination of the extinc-tion coefficient at 355 nm and 532 nm. The linear depolarization ratio of particles is derived at 532 nm. POLIS is a small low-power two-channel lidar for Raman or depo-larization measurements at 355 nm. As a consequence, combining the measurements from both lidars provides depolarization ratios at two wavelengths. The optical design
20
ACPD
10, 26705–26750, 2010Ground-based remote sensing of
volcanic ash
J. Gasteiger et al.
Title Page
Abstract Introduction
Conclusions References
Tables Figures
◭ ◮
◭ ◮
Back Close
Full Screen / Esc
Printer-friendly Version Interactive Discussion
Discussion
P
a
per
|
Dis
cussion
P
a
per
|
Discussion
P
a
per
|
Discussio
n
P
a
per
|
3.2 Modeling of optical properties of spheroids
For the inversion of lidar data we assume that ash particles are spheroids. Spheroids originate from rotation of ellipses about one of their axes. Rotation about the minor axis creates an oblate spheroid, whereas rotation about the major axis results in a prolate spheroid. One parameter, the aspect ratioǫ′, is sufficient for the characterization of the
5
shape of an oblate or a prolate spheroid. The aspect ratioǫ′ is defined as the ratio of the longest to the shortest axis of the spheroid, which implies thatǫ′is always equal or larger than 1. Spheroids withǫ′=1 are spheres.
Throughout this paper, the radius r of particles is specified by the cross-section-equivalent radiusrc,
10
rc= s
Cgeo
π . (1)
Cgeo is the orientation-averaged geometric cross sectional area of a particle. We use
r=rcas the parameter for the particle size, because, for particles larger than the wave-length, their cross section is more relevant for the extinction of light than their volume. Note, that the volume-equivalent radiusrvof a particle with volumeV
15
rv=
3
r 3V
4π (2)
can only be calculated fromrc, if the radius conversion factorξvc is known:
ξvc=
rv
rc =
3
s 3√π
4
3 √
V
q
Cgeo
(3)
In case of spheres ξvc is equal to 1 and it decreases with increasing particle non-sphericity. The radius conversion factorξvc depends only on the shape of a particle,
ACPD
10, 26705–26750, 2010Ground-based remote sensing of
volcanic ash
J. Gasteiger et al.
Title Page
Abstract Introduction
Conclusions References
Tables Figures
◭ ◮
◭ ◮
Back Close
Full Screen / Esc
Printer-friendly Version Interactive Discussion
Discussion
P
a
per
|
Dis
cussion
P
a
per
|
Discussion
P
a
per
|
Discussio
n
P
a
per
|
which means that isotropic scaling of a particle does not changeξvc. For spheroids, analytical equations forξvcare available (e.g., Ginoux, 2003).
As we assume non-spherical particles in the inversion, Mie theory cannot be applied. The computation of optical properties of non-spherical particles, however, is very de-manding with respect to computational time compared to the Mie theory. To facilitate
5
fast simulations of optical properties of aerosol ensembles, we store the optical proper-ties of a large number of single randomly-oriented spheroids in a database. For each particle in the database all relevant optical parameters are stored: The extinction ef-ficiencyqext=Cext/(πr
2
c), the scattering efficiencyqsca=Csca/(πr 2
c), and six elements (Fij) of the scattering matrix F(θ), which depend on the scattering angle θ, i.e., the
10
angle between incident and scattered beam. The scattering matrix F(θ) is stored in terms of expansion coefficients that allow the determination of F(θ) at any scattering angleθ (Mishchenko and Travis, 1998). The properties of spheroids are stored on a grid of different particle size parametersx=2πr/λ, refractive indicesm=mr+mi, and aspect ratiosǫ′. Table 1 shows the grid points of the scattering database. For the
cal-15
culation of optical properties of single spheroids the extended-precision version of the T-matrix code from Mishchenko and Travis (1998) is used. The size parameterx that can be handled by the T-matrix code has, for numerical reasons, an upper limit, which depends onǫ′andm. For parameter ranges that are not covered by the T-matrix code, a combination of a conventional geometric optics code from Macke and Mishchenko
20
(1996) and an improved geometric optics code from Yang and Liou (1997) is used: The extinction efficiencyqextand scattering efficiencyqscaare taken from Yang’s code. Due to better reliability in the lidar-relevant backscattering direction, the scattering ma-trix F(θ) is taken from Macke’s code. From the geometric optics code no expansion coefficients are available, thus we storeF(θ) for a grid of 571 scattering anglesθ. The
25
ACPD
10, 26705–26750, 2010Ground-based remote sensing of
volcanic ash
J. Gasteiger et al.
Title Page
Abstract Introduction
Conclusions References
Tables Figures
◭ ◮
◭ ◮
Back Close
Full Screen / Esc
Printer-friendly Version Interactive Discussion
Discussion
P
a
per
|
Dis
cussion
P
a
per
|
Discussion
P
a
per
|
Discussio
n
P
a
per
|
The extinction coefficientαcan be expressed by
α= rmax
Z
rmin
πr2qext(r)n(r)dr. (4)
n(r)=d N/dr is the particle number density per radius interval. As mentioned above, we user=rc. The range fromrmin tormax (integration limits omitted hereafter) should cover all relevant particle sizes. qext(r) also depends on wavelengthλ, refractive index
5
m, and particle shape. Refractive indices are linearly interpolated between the grid points of the database, and the aspect ratios in the database are weighted according to the actual aspect ratio distribution. Analogously toα, the backscatter coefficientβis
β=
Z
πr2qsca(r)F11(r,180◦)n(r)dr. (5)
F11is the 1,1-element of the scattering matrixF, which is also known as the phase
func-10
tion. The linear depolarization ratioδl, which is the ratio between cross-polarized and co-polarized lidar signals (e.g., Mishchenko and Hovenier, 1995), can be calculated by
δl= R
πr2qsca(r) F11(r,180◦)−F22(r,180◦)
n(r)dr
R
πr2q
sca(r)(F11(r,180◦)+F22(r,180◦))n(r)dr
. (6)
F22 is the 2,2-element of the scattering matrix F. αλ, βλ, and δl,λ denote the optical
properties at wavelengthλin nm.
15
The mass concentrationM is calculated by
M=4π
3 ρξ 3 vc
Z
r3n(r)dr. (7)
ρ is the mass density of the aerosol particles, and the cube of the shape-dependent radius conversion factorξ3vc(Eq. 3) is averaged over all particle shapes in the ensem-ble, assuming that particle shape is size-independent. For the mass densityρof the
ACPD
10, 26705–26750, 2010Ground-based remote sensing of
volcanic ash
J. Gasteiger et al.
Title Page
Abstract Introduction
Conclusions References
Tables Figures
◭ ◮
◭ ◮
Back Close
Full Screen / Esc
Printer-friendly Version Interactive Discussion
Discussion
P
a
per
|
Dis
cussion
P
a
per
|
Discussion
P
a
per
|
Discussio
n
P
a
per
|
ash particles we assume 2.6 g cm−3, which is the same as the density of mineral dust given in the OPAC-database (Hess et al., 1998); to our knowledge, there are no in-dications that the density of volcanic ash particles is systematically different from the density of mineral dust particles. For the conversion of extinction coefficients to mass concentrations we use the mass-extinction conversion factorη,
5
η=Mα. (8)
Note, thatηis the inverse of the mass extinction coefficient. We calculate the effective radiusreffof an ensemble as
reff= R
r3n(r)dr
R
r2n(r)dr. (9)
reffis defined in terms of cross-section-equivalent radii because we user=rc
through-10
out this paper. The term (ξ3vcreff) is equal to an alternative definition for the effective radius (3V/4A, e.g., Schumann et al., 2010a). Using the mean extinction efficiencyqext, which is given by
qext= R
qext(r)r 2
n(r)dr
R
r2n(r)dr , (10)
we can derive a relation betweenηandreff,
15
η= 4
3qext
ACPD
10, 26705–26750, 2010Ground-based remote sensing of
volcanic ash
J. Gasteiger et al.
Title Page
Abstract Introduction
Conclusions References
Tables Figures
◭ ◮
◭ ◮
Back Close
Full Screen / Esc
Printer-friendly Version Interactive Discussion
Discussion
P
a
per
|
Dis
cussion
P
a
per
|
Discussion
P
a
per
|
Discussio
n
P
a
per
|
3.3 Inversion approach
Modeling of optical properties of aerosol ensembles with known microphysical prop-erties is a forward problem. Forward problems have unique solutions and are solved on the basis of physical theories, e.g., the T-matrix method for scattering of light by spheroids. Conversely, in case of inverse problems, one tries to find physical
prop-5
erties of a system by using information from observations of the system. In the case under consideration, only a limited number of optical aerosol properties are available to find the microphysical properties of the observed aerosol. As, in general, many aerosol ensembles exist that are compatible with the measurements, the solution of the inverse problem is a distribution of compatible aerosol ensembles.
10
The approach for the inversion of lidar data that we use in this paper is an exam-ple for Bayesian inference (Mosegaard and Tarantola, 2002; Tarantola, 2006). To our knowledge, an Bayesian approach has been used for inversion of lidar data only by Herman et al. (2008). We retrieve microphysical aerosol properties by repeated for-ward calculations of model aerosol ensembles with varying microphysical properties
15
(see below) and by comparison of their optical properties with the optical properties from the lidar measurements. In the first step only intensive properties are retrieved, thus we consider an aerosol ensemble as compatible with the lidar measurements, if all linear depolarization ratios (δl,355 andδl,532) and all ratios between available exten-sive properties (α355,α532,β355,β532, andβ1064) are within the uncertainty ranges of
20
the corresponding values from the lidar measurements. The result of the inversion is a distribution of compatible aerosol ensembles. Any property of interest, for example the mass-extinction conversion factorη, can be derived from this distribution of ensembles. As a consequence, the solution for the property of interest is also a distribution. In this paper, the medians of the distributions, i.e. the values separating the distributions into
25
ACPD
10, 26705–26750, 2010Ground-based remote sensing of
volcanic ash
J. Gasteiger et al.
Title Page Abstract Introduction Conclusions References Tables Figures ◭ ◮ ◭ ◮ Back Close
Full Screen / Esc
Printer-friendly Version Interactive Discussion Discussion P a per | Dis cussion P a per | Discussion P a per | Discussio n P a per |
Model aerosol ensembles are specified by parameters for their microphysical prop-erties. In this paper, the size distribution n(r)/N0 of an ensemble is a normalized mono-modal log-normal distribution
n(r)
N0
=d N
dr
1
N0
=√ 1
2πlnσ rexp
"
−
lnr
−lnr0
√
2lnσ
2#
(12)
which is specified by the modal radiusr0 and the width σ of the mode. The size
dis-5
tribution is normalized by the particle number densityN0= R
n(r)dr, as only intensive properties are retrieved in the first step. The size of a non-spherical particle is speci-fied by the cross-section-equivalent radiusrc. The model aerosol ensembles cover a range fromrmin=20 nm tormax=20 µm. The wavelength-independent refractive index is given by a real partmrand an imaginary partmi. The shape of the particles of an
en-10
semble is specified by five parameters: Parameterζdescribes the relative frequency of prolate spheroids; this implies the frequency of oblate spheroids to be (1-ζ). µpandσp
specify the aspect ratio distributionfp(ǫ′) (adapted from Kandler et al., 2009) of prolate
spheroids:
fp(ǫ′)=
1 q
2πσp(ǫ′−1) exp
−
ln ǫ′−1−µp √
2σp
!2
(13)
15
µo and σo are the corresponding parameters for the aspect ratio distributionfo(ǫ′) of oblate spheroids, which is independent offp(ǫ′). We do not allow narrow aspect ratio distributions (σp/o<0.5), because wide aspect ratio distributions are necessary for
re-alistic simulations of optical properties (see e.g., Mishchenko et al., 1997). The second step of the approach provides extensive properties, e.g., the mass concentrationM.
20
They are calculated using the absolute values of the extinction coefficient from the lidar measurements.
ACPD
10, 26705–26750, 2010Ground-based remote sensing of
volcanic ash
J. Gasteiger et al.
Title Page
Abstract Introduction
Conclusions References
Tables Figures
◭ ◮
◭ ◮
Back Close
Full Screen / Esc
Printer-friendly Version Interactive Discussion
Discussion
P
a
per
|
Dis
cussion
P
a
per
|
Discussion
P
a
per
|
Discussio
n
P
a
per
|
Twister pseudo random number generator (MT19937). The sampling is continued un-til a sufficient number of compatible aerosol ensembles is found. Whereas for a first estimate of the microphysical properties 100 ensembles may be enough, for smooth distributions of retrieved parameters significantly more ensembles are necessary. On one core of an Intel Xeon 5130 processor, about 5000 ensembles per second are
mod-5
eled, but the computational speed of the retrieval also depends on the probability to find compatible ensembles. For the wide ranges given in Table 2 the ratio of compatible en-sembles to all enen-sembles is only about 1:200 000. As a consequence, if all four cores of the processor are used, about 360 compatible ensembles per hour are found.
3.4 Application to measurements of 17 April
10
We apply this inversion approach to optical data from the lidar measurements of vol-canic ash in about 3 km over Maisach at around 2:00 UTC on 17 April 2010 (see Fig. 1). Vertical profiles of the extinction coefficient α and backscatter coefficient β of the aerosol particles atλ=355 nm and 532 nm were derived using the Raman approach (Ansmann et al., 1992). Vertical profiles of the other optical parameters, i.e. the linear
15
depolarization ratioδlatλ=355 nm and 532 nm, andβ atλ=1064 nm, were derived using the approaches described by Freudenthaler et al. (2009) and Fernald (1984), respectively. To increase the signal-to-noise ratio, temporal averages from 1:30 UTC to 2:40 UTC were considered. As input for the inversion, we use optical parameters of the ash particles averaged over a layer of 400 m vertical extent, centered at the maximum
20
of the backscatter coefficientβ at 2.88 km above ground. The optical data and their uncertainties are summarized in Table 3. The uncertainty is given here as the sum of the stochastic and the systematic uncertainty (Groß et al., 2010). As mentioned above, Table 2 shows the ranges of microphysical parameters for the aerosol ensembles that are considered for the Monte Carlo sampling of the inversion. Thus, the data in Table 2
25
and 3 serve as input for the inversion.
ACPD
10, 26705–26750, 2010Ground-based remote sensing of
volcanic ash
J. Gasteiger et al.
Title Page
Abstract Introduction
Conclusions References
Tables Figures
◭ ◮
◭ ◮
Back Close
Full Screen / Esc
Printer-friendly Version Interactive Discussion
Discussion
P
a
per
|
Dis
cussion
P
a
per
|
Discussion
P
a
per
|
Discussio
n
P
a
per
|
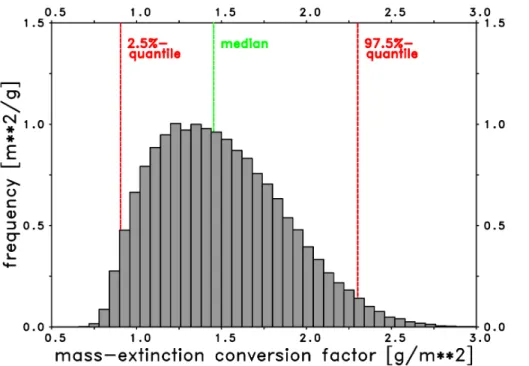
λ=532 nm is shown in Fig. 2. 100 000 compatible aerosol ensembles are evaluated. We find a median mass-extinction conversion factorηof 1.45 g m−2(green line). 95% of the compatible ensembles are in the range (0.9··2.3 g m−2) (red lines). The application of thisηto the extinction coefficientα(Table 3) from around 2:00 UTC results in a mass concentrationM of 0.54 mg m−3(0.3··0.9 mg m−3).
5
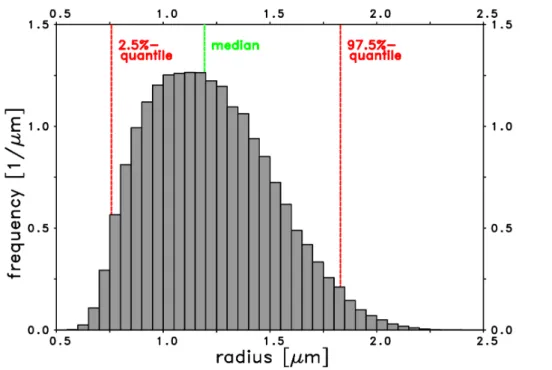
We also calculate the cross-section-equivalent effective radius reff of the ash parti-cles, because it is also of interest due to its proportionality toη(Eq. 11). The frequency distribution forreffis shown in Fig. 3. The effective radiusreffis 1.2 µm (0.75··1.83 µm). The lidar measurements suggest that there was no change of intensive properties of the ash particles from 2:00 UTC to 8:00 UTC. We apply the mass-extinction conversion
10
factorηalso at 8:00 UTC, when no Raman measurements were available. At that time, the maximum of the ash-related extinction coefficientα with values around 0.75 km−1 (Fig. 4) was observed in about 2.2 km, averaged over one hour and 80 m in the vertical. Applying η to these measurements, we find a mass concentration M of 1.1 mg m−3 (0.65··1.7 mg m−3) for the maximum of the ash plume over Maisach. If we consider
15
the optical depth of the ash layerτ=0.34 atλ=532 nm (from 1.7 km to 2.7 km above ground), the ash load over Maisach was 0.5 g m−2(0.3··0.8 g m−2).
3.5 Discussion of results from the lidar inversion
As mentioned above, several assumptions were applied for the optical modeling of the aerosol ensembles in the context of the inversion, e.g., assumptions on spectral
20
changes of the refractive indexm, on particle shape, and on the form of the size dis-tributions. These assumptions can potentially bias the results of the inversion. E.g., the retrieved real part of the refractive index of 1.43 (1.35··1.50) is smaller than the typical refractive index of ash, which is 1.50 or higher (e.g., Patterson et al., 1983). We expect, based on forward calculations of irregularly-shaped particles (not shown), that
25
ACPD
10, 26705–26750, 2010Ground-based remote sensing of
volcanic ash
J. Gasteiger et al.
Title Page
Abstract Introduction
Conclusions References
Tables Figures
◭ ◮
◭ ◮
Back Close
Full Screen / Esc
Printer-friendly Version Interactive Discussion
Discussion
P
a
per
|
Dis
cussion
P
a
per
|
Discussion
P
a
per
|
Discussio
n
P
a
per
|
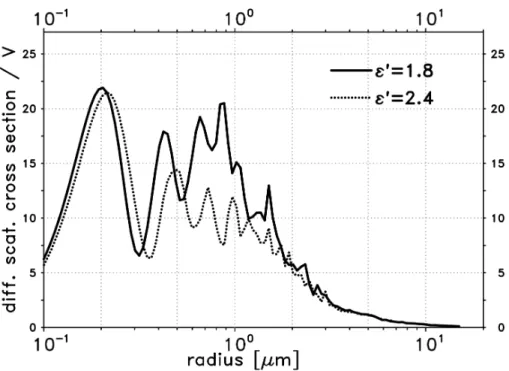
backscattering cross sections per particle volume for prolate spheroids with two aspect ratios, i.e.ǫ′=1.8 andǫ′=2.4. The figure is for λ=1064 nm, which is the maximum wavelength of our lidars, and a refractive index ofm=1.48+0.0043i, which is within the range of the retrieved refractive index. The intensity backscattered by a particle is proportional to its differential backscattering cross section. For particles with radii
5
r >1 µm, the backscattered intensity per particle volume decreases with size, which is immediately clear from Fig. 5. This is consistent with findings for spherical particles, e.g., from M ¨uller and Quenzel (1985). For particles with r=3 µm the backscattered intensity per particle volume is only 15%–25% of the corresponding value for particles withr=1 µm. This implies that, if particles withr&3 µm significantly contribute to the
10
total volume, the retrievedM could be underestimated.
Despite of these shortcomings, the retrieved mass-extinction conversion factorηis in the same range as the estimate from Ansmann et al. (2010). They assumed thatη
for mineral dust from OPAC (Hess et al., 1998) is applicable to volcanic ash. However, to increase the confidence about ηfrom the lidar inversion, independent studies are
15
required. For that we used information from sky radiance measurements in the aureole of the Sun, which are descibed in the following section.
4 Consistency check
The presence of micrometer- and super-micrometer-sized aerosol particles in the at-mosphere causes a bright zone around the solar disc, which is known as the aureole
20
of the Sun. The aureole is a result of diffraction of sunlight by the particles. The angu-lar width of the main diffraction peak, which is around the forward scattering direction
θ=0◦, primarily depends on the ratio between particle size and wavelength (van de Hulst, 1981). The exploitation of sky radiancesLin the aureole to retrieve the size of aerosol particles has a long tradition, e.g., Thomalla and Quenzel (1982), Nakajima
25
ACPD
10, 26705–26750, 2010Ground-based remote sensing of
volcanic ash
J. Gasteiger et al.
Title Page
Abstract Introduction
Conclusions References
Tables Figures
◭ ◮
◭ ◮
Back Close
Full Screen / Esc
Printer-friendly Version Interactive Discussion
Discussion
P
a
per
|
Dis
cussion
P
a
per
|
Discussion
P
a
per
|
Discussio
n
P
a
per
|
brevity: it is meant as the angular difference between the direction of the Sun and the direction of observation in the principle plane (above the Sun). We use this approach primarily for a consistency check of the effective radius of the ash particles which was derived from the lidar inversion (see Fig. 3). A benefit of the radiances in the aureole is that they are more sensitive to larger particles than the lidar signals, thus the
pres-5
ence of large particles can be investigated in more detail (see Sect. 4.4). Because of the relationship between particle size (in terms ofreff) and the mass-extinction conver-sion factorη(see Eq. 11), sky radiances in the aureole can indirectly be used for an estimate ofηalso.
The approach for our consistency check is independent from the lidar retrieval of the
10
previous section. The basic idea for the consistency check is to calculate sky radiances for two scattering angles by means of a radiative transfer model, and to compare the modeled ratio to the ratio from the measurements. If they agree, we get a solution for reff and η of the ash particles that is consistent with the photometer data. The solutions are compared to the results from the lidar retrieval. For the sky radiance
15
simulations we consider the vertical aerosol distribution from the lidar measurements and the uncertainty of the aerosol properties.
4.1 Instrumentation and data
An automatic CIMEL CE-318 Sun photometer is installed on the roof of the Meteoro-logical Institute of the Ludwig-Maximilans-Universit ¨at in downtown Munich (48.148◦N,
20
11.573◦E, 539 m a.s.l.). It is part of AERONET, which is a global network of Sun pho-tometers for the characterization of aerosols (Holben et al., 1998). The photometer measures the direct solar irradiances at several wavelengths which allows the deter-mination of the spectral optical depth of aerosols. Furthermore, CIMEL measures sky radiances L at several wavelengths in the almucantar and the principle plane, i.e. a
25
ACPD
10, 26705–26750, 2010Ground-based remote sensing of
volcanic ash
J. Gasteiger et al.
Title Page
Abstract Introduction
Conclusions References
Tables Figures
◭ ◮
◭ ◮
Back Close
Full Screen / Esc
Printer-friendly Version Interactive Discussion
Discussion
P
a
per
|
Dis
cussion
P
a
per
|
Discussion
P
a
per
|
Discussio
n
P
a
per
|
For the consistency check we consider the CIMEL principle-plane measurement of sky radiances from 17 April 2010 at 8:22 UTC. The solar zenith angle was 51.8◦. For our investigation we calculate the ratio of L at scattering angles of 4◦ and 3◦, i.e.,
L(4◦)/L(3◦), at λ=1020 nm. Henceforward this ratio is referred to as Λ. The largest wavelength of the CIMEL is best suited for our purposes, because it is less affected by
5
the boundary layer aerosol than shorter wavelengths. This is obvious from the 1064 nm extinction coefficient profile as shown in Fig. 4.
Next to the CIMEL, a JenOptik CHM15kx ceilometer is continuously monitoring the vertical aerosol distribution at λ=1064 nm over Munich (Wiegner, 2010). Measure-ments of the ceilometer (not shown) and MULIS (Fig. 1) reveal very similar
verti-10
cal and temporal distributions of the aerosol layers over both sites in the morning of 17 April 2010. Thus, we assume that the same ash type, in terms of intensive proper-ties asηorreff, was present over both sites, so that it is justified to use sky radiance measurements in Munich for a consistency check of the retrieval from lidar measure-ments in Maisach.
15
4.2 Radiative transfer calculations
For modeling sky radiances we used the software package libRadtran (Mayer and Kylling, 2005). The Monte Carlo code MYSTIC (Mayer, 2009) was used to solve the radiative transfer equation because it allows accurate calculations of the aureole even for strongly peaked phase functions.
20
To perform the sky radiance simulations, the knowledge of the atmospheric parame-ters, in particular the characteristics of the aerosols as a function of height, is required. In this context, the pronounced two layer structure with the planetary boundary layer (below 1.7 km) and the elevated ash layer (from 1.7 km to 2.7 km) as known from MULIS measurements in Maisach around 8:00 UTC is considered (see Fig. 4). Above 2.7 km,
25
ACPD
10, 26705–26750, 2010Ground-based remote sensing of
volcanic ash
J. Gasteiger et al.
Title Page
Abstract Introduction
Conclusions References
Tables Figures
◭ ◮
◭ ◮
Back Close
Full Screen / Esc
Printer-friendly Version Interactive Discussion
Discussion
P
a
per
|
Dis
cussion
P
a
per
|
Discussion
P
a
per
|
Discussio
n
P
a
per
|
For the characterization of the boundary layer we assume spherical particles, be-cause low linear depolarization ratios δl were derived from the lidar measurements. The values for the refractive index and the width of the size distributions cover the range of tropospheric aerosols typical for Munich. The effective radiusreffof the bound-ary layer aerosol particles was estimated from the wavelength-dependence of theα
-5
profiles of the aerosols.
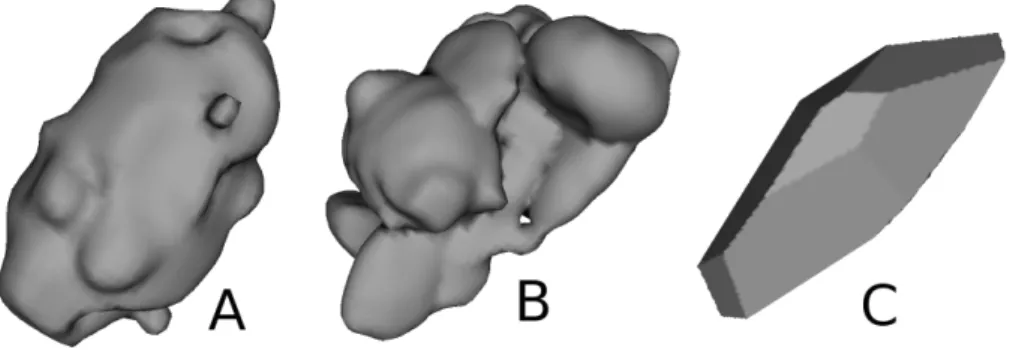
To investigate the relevance of the shape of the ash particles for the sky radiances, spheres (as the most simple case) and irregular morphologies as shown in Fig. 6 were investigated. The morphologies include a prolate spheroid with surface deformations according to the Gardner series (Gardner, 1984) and aspect ratioǫ′=1.8 (shape A),
10
an aggregate particle (shape B), and a sharp-edged particle (shape C). For the cre-ation of these model particles we use the volume modeling language Hyperfun (Valery et al., 1999). The single scattering properties are calculated using the discrete dipole approximation. For that we use the ADDA-code (Yurkin et al., 2007) with the “filtered coupled dipole” option and 11 dipoles per wavelength. As computation time
signifi-15
cantly increases with the size parameterx, we have to limit our calculations tox≤20.8, which corresponds to r≤3.4 µm atλ=1020 nm. Particles withr >3.4 µm are assumed to be spheroids (Dubovik et al., 2006). For the refractive index we consider a wide range, i.e. a real part mr between 1.5 and 1.6 and an imaginary part mi between 0 and 0.01. These values are expected to cover the uncertainty about the refractive
in-20
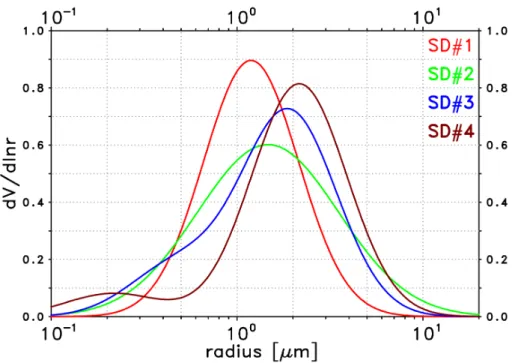
dex of ash atλ=1020 nm (e.g., Patterson et al., 1983). The size distributions of the ash layer particles are defined by their effective radius and their form. They include six cross-section-equivalent effective radii reff and four forms (SD#1–SD#4); they are shown forreff=1 µm as volume distributionsd V(r)/dlnr in Fig. 7. The forms include a narrow mono-modal distribution (σ=1.8; SD#1), a wide mono-modal case (σ=2.4;
25
ACPD
10, 26705–26750, 2010Ground-based remote sensing of
volcanic ash
J. Gasteiger et al.
Title Page
Abstract Introduction
Conclusions References
Tables Figures
◭ ◮
◭ ◮
Back Close
Full Screen / Esc
Printer-friendly Version Interactive Discussion
Discussion
P
a
per
|
Dis
cussion
P
a
per
|
Discussion
P
a
per
|
Discussio
n
P
a
per
|
different forms of size distributions andreff are expected to cover the range of realistic size distributions for ash particles. SD#1 is considered as the lower limit with respect to the width of the size distribution, because volcanic ash particles typically have a wide range of sizes (e.g., Mather et al., 2003; Schumann et al., 2010b). In all simulations, particles up tor=40 µm are accounted for.
5
Finally, the vertical profile of the extinction coefficientα of the aerosol has to be de-fined. We do not apply the high-resolution profiles from the lidar measurements (Fig. 4), but assume height-independent extinction coefficients in each of the two aerosol lay-ers. The extinction coefficients of the aerosol are calculated from the optical depths and the vertical extents of the layers. From the lidar measurements at 1064 nm we find
10
0.07 for the optical depth of the lower layer and 0.27 for the ash layer. We assume an uncertainty of 20%, and simulate one case with an optical depth of 0.056 for the lower layer and 0.324 for the ash layer and another case with 0.084 for the lower layer and 0.216 for the ash layer. It is worth mentioning that the aerosol optical depth from the lidar and the CIMEL radiometer agree quite well; they are 0.34 and 0.31, respectively.
15
As a result, we perform radiative transfer calculations with a total of 12 288 parameter-combinations to account for the uncertainty of the aerosol properties.
4.3 Comparison of measured and simulated radiances
From the CIMEL measurements we find Λ =L(4◦)/L(3◦)=0.856 atλ=1020 nm. We assume an uncertainty of±0.007 forΛwhich corresponds to an uncertainty of±0.05◦
20
for the angular distance between theL(3◦)- and theL(4◦)-measurement. 0.05◦is given by Holben et al. (1998) as the pointing precision of the Sun photometer.
In Fig. 8 simulatedΛare plotted over the effective radiusreff (in µm) of the ash. The results of all radiative transfer simulations in comparison to the measurement (horizon-tal lines) are shown. The colors are explained in the figure caption and indicate the
25
ACPD
10, 26705–26750, 2010Ground-based remote sensing of
volcanic ash
J. Gasteiger et al.
Title Page
Abstract Introduction
Conclusions References
Tables Figures
◭ ◮
◭ ◮
Back Close
Full Screen / Esc
Printer-friendly Version Interactive Discussion
Discussion
P
a
per
|
Dis
cussion
P
a
per
|
Discussion
P
a
per
|
Discussio
n
P
a
per
|
Black dotted lines show the resulting uncertainty range from all simulations with non-spherical ash particles.
Figure 8 shows that in general Λ decreases with reff of the ash particles. For SD#1 (red color) we find, e.g., 0.932≤Λ≤0.944 with an average ofΛ =0.937, when
reff=0.8 µm, but only 0.680≤Λ≤0.711 for reff=3.0 µm. For the other forms of size
5
distributions, Λ is smaller, in particular, if bi-modal size distributions are considered (blue and brown color). The sensitivity ofΛto changes of the form of the particle size distribution is typically of the order of 0.1, when SD#1 and SD#4 are compared. For a given size distribution of the ash particles, the sensitivity ofΛ to changes of the other aerosol properties is quite low. In the hypothetical case of spherical ash particles (grey
10
color),Λis only slightly larger than in the cases with non-spherical ash.
The results show that agreement of the modeled and measured Λ is possible for 0.75 µm≤reff≤1.7 µm. These findings are in good agreement with the retrieval based on the lidar measurements as shown in Fig. 3.
In Fig. 9 Λ is plotted as a function of the mass-extinction conversion factor η at
15
λ=532 nm. As a consequence, each colored bar from Fig. 8 splits into at least three bars according to shape A, B and C. The reason is that according to Eq. 11,ηnot only depends on reff but also on shape-dependent parameters ξ3vc and qext. Thus, Fig. 9 was selected to illustrate the influence of the particle shape. E.g., forreff=2.0 µm and SD#1 (Λ≈0.80, red bar in Fig. 8) we get values of η=2.52 g m−2, η=2.16 g m−2, or
20
η=2.19 g m−2, depending on whether particle shape A, B or C is assumed. In case of spherical ash, the conversion factor would be considerably larger withη=3.02 g m−2 (grey bar).
For mass-extinction conversion factors η between 0.9 g m−2 and 2.0 g m−2 agree-ment between simulated and measuredΛis found, as can seen from the black dotted
25
ACPD
10, 26705–26750, 2010Ground-based remote sensing of
volcanic ash
J. Gasteiger et al.
Title Page
Abstract Introduction
Conclusions References
Tables Figures
◭ ◮
◭ ◮
Back Close
Full Screen / Esc
Printer-friendly Version Interactive Discussion
Discussion
P
a
per
|
Dis
cussion
P
a
per
|
Discussion
P
a
per
|
Discussio
n
P
a
per
|
4.4 Discussion of results using sky radiances
In the previous section we have found that 0.75 µm ≤reff≤ 1.7 µm fits the aureole measurements. For a better understanding of this finding we want to briefly discuss a few of the underlying physical principles.
The discussion of Λ is facilitated if we use single scattering properties of the ash
5
particles, i.e. the ratio of their phase functionΛ11=F11(4◦)/F11(3◦), as an approximation forΛ. This approach is possible because the radiances in the aureole are dominated by single forward scattering; in all simulations|Λ−Λ11|<0.17×(1−Λ). E.g., for the simulatedΛthat agrees with the measurement (0.856±0.007), the difference|Λ-Λ11| is always smaller than 0.02. Thus, we can useΛ11 for further discussions.
10
First, we investigate the dependence of the forward scattering of a particle on its size. In Fig. 10 normalized phase functionsF11(θ)/F11(3◦) at λ=1020 nm are shown. For particles with radii of 1 µm the phase functionF11is almost constant in the forward scattering direction, i.e. forθ <6◦the ratioF11(θ)/F11(3◦) is close to 1. With increasing particle size, the angular dependence ofF11increases and the ratioΛ11decreases. For
15
particle sizes of aboutr=2.6 µm,Λ11 is 0.856 which is consistent withΛderived from the CIMEL measurements (cross in Fig. 10). For larger particles the ratioΛ11 is sig-nificantly smaller, e.g., forr=4 µmΛ11=0.66, and forr=8 µm we getΛ11=0.21. That is a clear indication that the observed volcanic ash over Munich was not dominated by particles in that size range.
20
To investigate the shape dependence of the diffraction peak, in Fig. 10 normalized phase functions of prolate spheroids (ǫ′=1.8, solid lines) and of spheres with the same cross-section-equivalent radiusrc (dotted lines) are compared. Figure 10 shows that the shape dependence of the main diffraction peak is much weaker than its depen-dence on particle size. The main difference is that for non-spherical particles the
25
ACPD
10, 26705–26750, 2010Ground-based remote sensing of
volcanic ash
J. Gasteiger et al.
Title Page
Abstract Introduction
Conclusions References
Tables Figures
◭ ◮
◭ ◮
Back Close
Full Screen / Esc
Printer-friendly Version Interactive Discussion
Discussion
P
a
per
|
Dis
cussion
P
a
per
|
Discussion
P
a
per
|
Discussio
n
P
a
per
|
For atmospheric aerosols the scattering contributions of particles of different sizes have to be weighted according to their size distribution. Figure 11 shows differential scattering cross sections per particle volume, i.e.Csca×F11(θ)/V, atθ=3◦ (solid) and
θ=4◦(dashed) as a function of particle radius. Weighting of these curves with one of the particle volume distributions shown in Fig. 7 allows the calculation ofΛ11 for that
5
volume distribution. According to Fig. 11 primarily the volume in particles with radii from approximately 0.3 µm to 10 µm contributes to scattering at θ=3◦. In the range from 2 µm to 10 µm the sensitivity of Λ11 to particle volume is much higher than for the lidar retrieval, which is immediately clear from comparison of Figs. 5 and 11. But for particles with r >10 µm, the ratio Λ11 is virtually insensitive. However, there are
10
no indications from independent measurements or from transport modeling, that such particles were present over Munich during the case under investigation.
Table 5 shows the effective radiireffthat are consistent with the CIMEL measurement for the different forms of the size distributions (SD#1 to SD#4). The reff are derived from Fig. 8 as the intercepts of the dotted lines with the measuredΛ-value (horizontal
15
line). It can be seen that the effective radiireff that are in agreement with the radiance measurements depend on the forms of the size distribution; largerreff are necessary for narrow size distributions (SD#1) than for wide size distributions (e.g. SD#2). For the compatiblereff, Table 5 also shows the relative volume in particles with radii larger than certain radii. We find that the volume in particles withr >2.5 µm is approximately
20
25% of the total volume, nearly independent of the assumed size distribution. The uncertainty range for that value, as a result of the uncertainty of the aerosol parameters (Table 4) and the measurement uncertainty, is from 20% to 34%.
As mentioned, the shape dependence of η(Fig. 9) is a result of the proportionality between the mass-extinction conversion factorηand the cube of the shape-dependent
25
ACPD
10, 26705–26750, 2010Ground-based remote sensing of
volcanic ash
J. Gasteiger et al.
Title Page
Abstract Introduction
Conclusions References
Tables Figures
◭ ◮
◭ ◮
Back Close
Full Screen / Esc
Printer-friendly Version Interactive Discussion
Discussion
P
a
per
|
Dis
cussion
P
a
per
|
Discussion
P
a
per
|
Discussio
n
P
a
per
|
the observations. For vesicular ash particlesξ3vc would be even smaller than 0.5, and a significant overestimation of the mass would occur if vesicularity of the ash was not considered. Electron microscopy images of ash particles provide valuable information for an estimation ofξvc3. The samples for the ash plume from Eyjafjallaj ¨okull (Schu-mann et al., 2010b) indicate that most of the particles were non-vesicular, thus we are
5
confident that theξ3vcof our model particles (Fig. 6) are not unrealistic.
5 Summary and conclusions
The volcanic ash plumes from Eyjafjallaj ¨okull in spring 2010 over Europe provide an excellent opportunity for characterizing aerosol particles, testing scattering theory, and improving remote sensing techniques. However, the volcanic event also had an
im-10
mediate and strong impact on transportation and economy as the mass concentration
M of volcanic ash is relevant for flight safety. Thus, advances of the methods for the determination of this parameter are urgently required.
In this paper, we investigated the possibility to retrieve the mass concentration of volcanic ash from lidar measurements by means of microphysical inversion. As input,
15
a set of quality-controlled optical properties of the ash layer was available from lidar measurements, i.e. extinction coefficients, backscatter coefficients, and linear depo-larization ratios at different wavelengths. The non-sphericity of the ash particles was explicitly considered in the retrieval by spheroids.
For the ash plume of 17 April 2010 over Munich/Maisach we found from our lidar
re-20
trieval a median of 1.45 g m−2for the mass-extinction conversion factorηatλ=532 nm. The uncertainty range (95% of the retrieval solutions) was (0.9··2.3 g m−2). Due to the limited information content of the lidar data, the uncertainty of the inversion results was quite large. For the maximum of the ash plume over Maisach, which occurred in the morning of 17 April 2010, the lidar retrieval suggested a mass concentrationM of
25
ACPD
10, 26705–26750, 2010Ground-based remote sensing of
volcanic ash
J. Gasteiger et al.
Title Page
Abstract Introduction
Conclusions References
Tables Figures
◭ ◮
◭ ◮
Back Close
Full Screen / Esc
Printer-friendly Version Interactive Discussion
Discussion
P
a
per
|
Dis
cussion
P
a
per
|
Discussion
P
a
per
|
Discussio
n
P
a
per
|
M might be slightly higher than the one-hour-average, we conclude that the maximum mass concentration over Maisach was close to but probably not above 2 mg m−3, which is currently considered as the upper limit for “areas of low contamination” (International Civil Aviation Organization, 2010).
To provide more confidence in our results, we use co-located sky radiance
measure-5
ments as an independent data-set. From the exploitation of spectral sky radiances at two scattering angles we found a range forηfrom 0.9 to 2.0 g m−2. This confirms our retrieved mass concentrations from the lidar data, in particular, as the sensitivity to large particles is larger compared to the retrieval based on lidar measurements.
The sky radiance measurements indicate that approximately 75% of the mass was
10
in ash particles with cross-section-equivalent radii smaller than 2.5 µm. The presence of particles with radii larger than 10 µm cannot be excluded by the radiance measure-ments. However, the absence of significant numbers of large particles is confirmed by in-situ measurements (Schumann et al., 2010b) and transport modeling. E.g., Ginoux (2003) found that the gravitational settling velocity is in the order of 100 m h−1 for
par-15
ticles with radiir=10 µm. By taking into account the much smaller settling velocity of the dominating micrometer-sized particles, it can be expect that the volume of particles with radii larger than 10 µm in the ash layer over Munich was negligible.
An increase of the accuracy of the retrieval of M can be expected from thorough and synergistic exploration of all available information from lidar and Sun
photome-20
ter measurements, e.g., including sky radiances at all measurement wavelengths and scattering angles. Benefits could also be expected from further improvements of the aerosol models, and from observations at longer wavelengths, as they increase the sensitivity to large particles. The consideration of the non-sphericity of the ash par-ticles is necessary for at least two reasons: First, the relevant optical properties are
25
ACPD
10, 26705–26750, 2010Ground-based remote sensing of
volcanic ash
J. Gasteiger et al.
Title Page
Abstract Introduction
Conclusions References
Tables Figures
◭ ◮
◭ ◮
Back Close
Full Screen / Esc
Printer-friendly Version Interactive Discussion
Discussion
P
a
per
|
Dis
cussion
P
a
per
|
Discussion
P
a
per
|
Discussio
n
P
a
per
|
is retrieved correctly. In that sense, spheres can provide an upper limit of the mass density, the “worst case”.
In summary, we want to emphasize that lidar measurements of the linear depolariza-tion ratio are essential to distinguish volcanic ash layers from other aerosol types. To assess the mass concentrationM of ash layers, the knowledge of the extinction
coef-5
ficientα and the mass-extinction conversion factorηis necessary. Consequently, so-phisticated lidar-systems (Raman lidar or HSRL, polarization channels) including pre-cise calibration techniques for depolarization ratios are required. For the near-realtime provision ofMas a function of height and time, values forηcannot be determined indi-vidually in due time. One rather has to rely on a climatology ofη, certainly depending
10
on the transport time and adequate parameters that can describe the eruption type. This climatology could be established by a combination of in-situ and remote sensing measurements or, as we showed in this paper, by inversion of optical data retrieved from a combination of lidar and Sun photometer. To get the spatial distribution of an ash plume and to monitor its dispersion, for example on continental scale, the operation
15
of a network of lidars such as EARLINET is recommended. EARLINET-stations might act as super-sites to calibrate secondary networks of ceilometers that are currently implemented by national weather services.
Acknowledgements. The financial support for the improvement of the EARLINET infrastruc-ture by the European Commission under grant RICA-025991 is gratefully acknowledged. This
20
ACPD
10, 26705–26750, 2010Ground-based remote sensing of
volcanic ash
J. Gasteiger et al.
Title Page
Abstract Introduction
Conclusions References
Tables Figures
◭ ◮
◭ ◮
Back Close
Full Screen / Esc
Printer-friendly Version Interactive Discussion
Discussion
P
a
per
|
Dis
cussion
P
a
per
|
Discussion
P
a
per
|
Discussio
n
P
a
per
|
References
Ansmann, A., Wandinger, U., Riebesell, M., Weitkamp, C., and Michaelis, W.: Independent measurement of extinction and backscatter profiles in cirrus clouds by using a combined Ra-man elastic-backscatter lidar, Appl. Opt., 31, 7113, doi:10.1364/AO.31.007113, 1992. 26717 Ansmann, A., Tesche, M., Groß, S., Freudenthaler, V., Seifert, P., Hiebsch, A., Schmidt,
5
J., Wandinger, U., Mattis, I., M ¨uller, D., and Wiegner, M.: The 16 April 2010 ma-jor volcanic ash plume over central Europe: EARLINET lidar and AERONET photome-ter observations at Leipzig and Munich, Germany, Geophys. Res. Lett., 37, L13810, doi:10.1029/2010GL043809, 2010. 26709, 26719
B ¨osenberg, J., Matthias, V., Amodeo, A., et. al.: EARLINET: A European Aerosol Research
Li-10
dar Network to Establish an Aerosol Climatology, Max-Planck-Institut Report No. 348, Ham-burg, 2003. 26707
Draxler, R. R. and Rolph, G. D.: HYSPLIT (HYbrid Single-Particle Lagrangian Integrated Tra-jectory) Model access via NOAA ARL READY Website, available at: http://ready.arl.noaa. gov/HYSPLIT.php, NOAA Air Resources Laboratory, Silver Spring, MD, 2010. 26709
15
Dubovik, O., Sinyuk, A., Lapyonok, T., Holben, B. N., Mishchenko, M., Yang, P., Eck, T. F., Volten, H., Mu ˜noz, O., Veihelmann, B., van der Zande, W. J., Leon, J., Sorokin, M., and Slutsker, I.: Application of spheroid models to account for aerosol particle nonsphericity in remote sensing of desert dust, J. Geophys. Res., 111, D11208, doi:10.1029/2005JD006619, 2006. 26719, 26722
20
Fernald, F. G.: Analysis of atmospheric lidar observations: some comments, Appl. Opt., 23, 652–653, doi:10.1364/AO.23.000652, 1984. 26717
Flentje, H., Claude, H., Elste, T., Gilge, S., K ¨ohler, U., Plass-D ¨ulmer, C., Steinbrecht, W., Thomas, W., Werner, A., and Fricke, W.: The Eyjafjallaj ¨okull eruption in April 2010 - detection of volcanic plume using in-situ measurements, ozone sondes and lidar-ceilometer profiles,
25
Atmos. Chem. Phys., 10, 10085–10092, doi:10.5194/acp-10-10085-2010, 2010. 26709 Freudenthaler, V., Esselborn, M., Wiegner, M., Heese, B., Tesche, M., Ansmann, A., M ¨uller,
D., Althausen, D., Wirth, M., Fix, A., Ehret, G., Knippertz, P., Toledano, C., Gasteiger, J., Garhammar, M., and Seefeldner, M.: Depolarizationratio profiling at several wavelengths in pure Saharan dust during SAMUM 2006, Tellus B, 61, 165–179,
doi:10.1111/j.1600-30
0889.2008.00396.x, 2009. 26710, 26717
ACPD
10, 26705–26750, 2010Ground-based remote sensing of
volcanic ash
J. Gasteiger et al.
Title Page
Abstract Introduction
Conclusions References
Tables Figures
◭ ◮
◭ ◮
Back Close
Full Screen / Esc
Printer-friendly Version Interactive Discussion
Discussion
P
a
per
|
Dis
cussion
P
a
per
|
Discussion
P
a
per
|
Discussio
n
P
a
per
|
the 11th annual conference on Computer graphics and interactive techniques, 11–20, 1984. 26722
Gertisser, R.: Eyjafjallaj ¨okull volcano causes widespread disruption of European air traffic, Geology Today, 26, 94–95, doi:10.1111/j.1365-2451.2010.00757.x, 2010. 26707, 26709 Ginoux, P.: Effects of nonsphericity on mineral dust modeling, J. Geophys. Res., 108, 4052,
5
doi:10.1029/2002JD002516, 2003. 26712, 26728
Groß, S., Freudenthaler, V., Toledano, C., Seefeldner, M., and Wiegner, M.: Mini-lidar measure-ments of particle depolarization and Raman scattering of Saharan-dust and biomass burning at 355 nm during SAMUM 2, Proc. of 24th International Laser Radar Conference, Boulder, USA, 23–27 June 2008, S04P-10, 2008. 26710
10
Groß, S., Freudenthaler, V., Gasteiger, J., Schnell, F., and Wiegner, M.: Characterization of the Eyjafjallaj ¨okull ash-plume by means of Lidar measurements over the Munich EARLINET-site, Spie Conference, Toulouse, France, 20–23 September 2010, Paper 7832-20, 2010. 26708, 26717
Herman, B. R., Gross, B., Moshary, F., and Ahmed, S.: Bayesian assessment of uncertainty
15
in aerosol size distributions and index of refraction retrieved from multiwavelength lidar mea-surements, Appl. Opt., 47, 1617–1627, doi:10.1364/AO.47.001617, 2008. 26715
Hess, M., Koepke, P., and Schult, I.: Optical Properties of Aerosols and Clouds:
The Software Package OPA, B. Am. Meteor. Soc., 79, 831–844, doi:10.1175/1520-0477(1998)079¡0831:OPOAAC¿2.0.CO;2, 1998. 26714, 26719
20
Holben, B. N., Eck, T. F., Slutsker, I., Tanr, D., Buis, J. P., Setzer, A., Vermote, E., Reagan, J. A., Kaufman, Y. J., Nakajima, T., Lavenu, F., Jankowiak, I., and Smirnov, A.: AERONET – A Federated Instrument Network and Data Archive for Aerosol Characterization, Remote Sens. Environ., 66, 1–16, doi:10.1016/S0034-4257(98)00031-5, 1998. 26720, 26723 International Civil Aviation Organization: EUR DOC 019 – Volcanic Ash Contingency Plan
25
EUR and NAT Regions (1st Edition), available at: http://www.paris.icao.int/documents open/ show file.php?id=334, 2010. 26728
J ¨ager, H.: Long-term record of lidar observations of the stratospheric aerosol layer at Garmisch-Partenkirchen, J. Geophys. Res., 110, D08106, doi:10.1029/2004JD005506, 2005. 26706 Kandler, K., Sch ¨utz, L., Deutscher, C., Ebert, M., Hofmann, H., J ¨ackel, S., Jaenicke, R.,
Knip-30