ENHANCED WINTER HARDINESS IN COMMON VETCH (VICIA SATIVA L.) FOR
AUTUMN-SOWING IN THE CENTRAL HIGHLANDS OF TURKEY
1
*H. Kansur FIRINCIOĞLU,
1Eraslan ERBEKTAŞ,
2Levent DOĞRUYOL,
2Sabahaddin ÜNAL and
2Ömer
MENTEŞ
1Retired research fellow, the Pasture and Forage, Department Central Research Institute for Field Crops, Ankara, Turkey. 2The Pasture and Forage Department, Central Research Institute for the Field Crops, Yenimahalle, Ankara, Turkey
* Corresponding author: Postal address: 2. cadde, 34-4, Bahcelievler/Ankara, TURKEY, E-mail address:huseyin@tr.net Manuscript received: August 12, 2008; Reviewed: September 3, 2009; Accepted for publication: October 21, 2009
ABSTRACT
In central Turkey, common vetch is planted in spring, but frequent droughts cause crop failures. Autumn-sown vetch has more yield potential; but then winter killing is a major problem. Therefore, winter hardiness is a central requirement for successful vetch production. This study comprised two phases. First, eighteen lines out of 164 accessions were selected for their superiority, primarily for winter hardiness and earliness in 1999/00. Second, the selected lines along two local checks (var. SarıElçi and cv. KaraElçi) were evaluated for yield performances in multi-year trials established in autumn and spring from 2000 to 2003. Autumn-sown vetch displayed 14.9% greater yield potential than spring vetch. As winter mortality decreased, seed yield increased in two cold environments (r2=0.41 and r2=0.54). The two
genotypes (L-1430 and L-1548) showed the greatest stability across six environments, while L-581 and L-1544 were the best lines for autumn sowing. In conclusion, the level of variation found in the base populations did clearly show potential for further development, and multi-environment trials singled out the V. sativa genotypes with enhanced winter hardiness.
INTRODUCTION
Increased feed requirements for an expanding Turkish livestock population necessitate the introduction of forage legumes into crop rotations [12]. Common vetch (Vicia sativa ssp. sativa), a major annual forage legume in Turkey, is grown over the largest area, some 320.000 ha [24]. The bulk of the crop is cultivated in Central Highlands of Turkey (CHT), mostly for straw and seed [5, 9], and grain vetch is used as a supplementary concentrate feed when stock are housed indoors in winter [4, 10].
The success or failure of growing annual forage legume species in harsh environments like CHT is largely dependent on the degree of resistance to biotic and abiotic stress [11]. In such arid environments, freezing temperatures in winter, low and inconsistent distribution of annual rainfall, and high temperatures at maturity are all important abiotic stress factors. In CHT, common vetch is traditionally sown in spring, but frequent droughts cause crop failures. Earlier studies showed that autumn-sown vetches had more yield potential than spring vetch [11]. However, winter killing is a major problem [3]; for example, cold tolerance is a central requirement for establishing cool season annual forage legumes in the medium to high elevation areas in West Asia and North Africa [2]. Therefore, successful agricultural production in continental Mediterranean highland environments can only be achieved if the major constraints of low temperatures and seasonal drought can be either overcome or avoided [15].
The importance of the use of genetic resources to enhance genetic potential of the crop and in alleviating biotic and abiotic stress has been well recognized [23]. To improve winter hardiness and adaptation in common vetch, it is imperative to know the magnitude of genotypic variability present, as this will provide the basis for efficient selection. If phenotypic observations are based on adequately large samples and the visible traits measured show significant differences among populations, they can provide a reasonable representation of overall genetic performance [13].
The evidence currently available indicates the autumn-sown common vetch with sufficient winter hardiness would improve adaptation and increase yield potential. Depending on cold intensity and crop susceptibility, the winter effect may range partial forage damage, causing small yield losses, to complete death resulting in total crop failure [20]. Studies of winter hardiness on common vetch in Turkey is very limited, although other legumes have been investigated in more detail. In common vetch, relationships between relative cold tolerance and morphological and physiological traits of
seeds or seedling may become pronounced at different growing and harvesting regimes [3]. Cold hardiness was associated with better germination, emergence and smaller seedling and slower growth in field pea (Pisum sativum L.) [22]. In lentil (Lens culinaris Medik.), the inheritance patterns of winter hardiness appeared to be quantitative on the basis of frequency distributions and the lack of discrete segregation classes [14], and an effective field screening method was considered a prerequisite to select for winter hardy material, both in segregating and exotic germplasm [16]. Selecting for yield, however, is complex: weather conditions are unpredictable and drastically varying within and between years. The interactions occur as the result of differential responses by genotypes to different environments [21]. Therefore, analysis of genotype-environment interactions (GxE) is important in determining adaptation and yield stability. On the basis of available germplasm, it should be possible to develop common vetch cultivars with sufficient winter hardiness. Breeding for such a purpose, therefore, the trials described here were designed to: (1) evaluate and select the superior genotypes for sufficient winter hardiness and seed yield, (2) determine the nature of G x E interaction, and (3) study the nature of adaptation.
MATERIAL AND METHODS
Experimental material and management
The adaptation and variety performance tests were established in a completely randomized block design with four replicates. For all sowings, the previous crop was a cereal. Plots were 1.5 m wide (consisting of 6 rows, 25 cm apart) by 5 m long, and were sown by hand into drills. Seed rate was calculated as density of 300 seeds per square meter. A dose of 100 kg/ha of composite fertilizer, Di-Ammonium Phosphate (DAP-18 and 43%), was applied into experimental plots during sowing. Weeds were controlled soon after planting by a pre-emergence herbicide (Linurex) and in spring by hoeing.
Soil and climatic conditions
The experimental site has clay-loam soil with high lime content, low organic matter, is slightly alkaline and is poor in phosphorous and nitrogen but it has adequate potassium.
Monthly average, minimum and maximum temperatures and monthly total rainfall for each year, obtained from the local Weather Station in Ankara, are illustrated in Figure 1. The long-term (1982–2006) average annual rainfall was 397 mm (Fig. 1a). While monthly average minimum temperatures were below zero from December to March), total monthly rainfall was highest in April and May. The annual rainfall of 2000/01 and 2002/03 seasons was 23 and 22 % less than these of long-term average respectively (Fig. 4c,e). In this region, spring rain (March to June) is critical for plant growth. There was a drought in spring of 2002/03, which received 36 % less rainfall than the long-term average. In the line selection year (1999/00), precipitation was near normal (4.5% more than long-term), particularly in winter months (Fig. 1b). In the first test season (2000/01), the winter was very mild, whereas in the second season (2001/02), the winter was quite cold, and January monthly average minimum temperature approached -10 0C (Fig. 1d). The third
(2002/03) and fourth (2003/04) cropping seasons were cold enough for evaluating winter hardiness.
Measurements
In line selection phase, for the 164 accessions, the three plant characters evaluated in accession rows were: (1) winter mortality estimated by scoring on a 1–9 scale soon after winter: 1.0-3.0= resistant, no visible symptom of permanent damage in row, 3.1-6.0 = tolerant, some foliar injury and up to 25% plant killings, 6.1-9.0 = susceptible, severe foliar damage and up to 100% plant killings; (2) the days-to-flowering, the number of days from sowing to flowering date (the date on which flower emerged on 50% of the plants in a row); and (3) days-to-harvesting, the number of days from sowing to seed harvest. The following two traits were measured on six randomly selected plants from each accession at full maturity: (4)
the stem length (cm), length of the main stem from crown to stem tip; (5) number of pods per plant. For the seed harvest, all plants in a row were harvested to determine (6) the standing biomass (g/row), (7) the seed mass (g/ row), and (8) 1000-seed weight (g).
In the multi-year yield trials, winter mortality score were estimated as in the line selection. Severe winter killings occurred in plots in 2001/02 and most of the plants were killed so only winter-killing scores were recorded and assessed in this season. In each plot, the 6.0 m2 area (i.e.
six rows; 1.5 m wide, 4 m long) was harvested by hand at full maturity (i.e. when pods near ground become brownish and seeds were hard), and following thrashing the acquired seed was weighed and recorded as the seed yield for that plot.
Data management and statistical procedure
To determine the differences between the 18 selected lines and 164 accessions, a t-test was performed for those measured plant characters. In addition, comparisons were made by generating the frequency histograms, with normal curves superimposed, and by using descriptive statistics of mean and coefficient of variation (CV). Due to differences in sowing time and climate over the years, each yield trial was considered as an individual environment, giving to the six environments: i.e. four autumn (Ea1, Ea2, Ea3 and Ea4) and two spring plantings (Es5 and Es6). To seek possible interactions, combined analysis of variance was performed. Means were separated by using Student’s t.
Regression analysis were performed between seed yields in two environments (Ea3 and Ea4) and mean winter mortality scores of those two environments in order to display the cold effect of these two test years on genotypes.
The two stability parameters described by Finlay and Wilkonsin (1963) )[8], Eberth and Russel (1966) [7] were calculated: (1) the regression coefficient (b) is a linear regression of genotype mean yield on the average of all genotypes and its significance was determined using the Student’s t-test [25], and (2) the mean square deviation from the regression (S2d). Coefficient of determination
(r2) was computed from linear regression analysis of each
genotype [19]. Analysis of variance components [7] was also computed for seed yield when stability parameters were estimated.
The analysis for the descriptive statistics, t-test, and regression analysis were performed in Minitab version 14.0, and J.M.P 5.01 of SAS institute was employed for the analysis of variance and mean separations.
Line selection
Figure 2 illustrates the frequency distributions of eight plant metric characteristics with normal curves superimposed, drawn separately for the 18 selected lines and 164 accessions (base lines). The cold winter of 1999/00 cropping season made it a good test for winter hardiness (Fig. 1b). Winter mortality score was significantly 32% less in selected lines than in base lines (P<0.001). Moreover, on average the selections flowered and matured 5.6 and 5.1 days earlier than base lines did respectively (P<0.001). Coefficients of variation for all characters were smaller in selected lines than in base
lines. Though they statistically possessed similar stem length and number of pods per plant, the selections had significantly higher standing biomass (35% more), seed mass (38% more) and 1000-seed weight (28% more) than did baselines (P<0.001). Because these 18 lines were superior for winter hardiness, earliness, biomass and seed mass, they were selected and taken to the multi-year trials for further tests for adaptation and yield performances.
Adaptation and variety performance
Winter mortality and seed yield
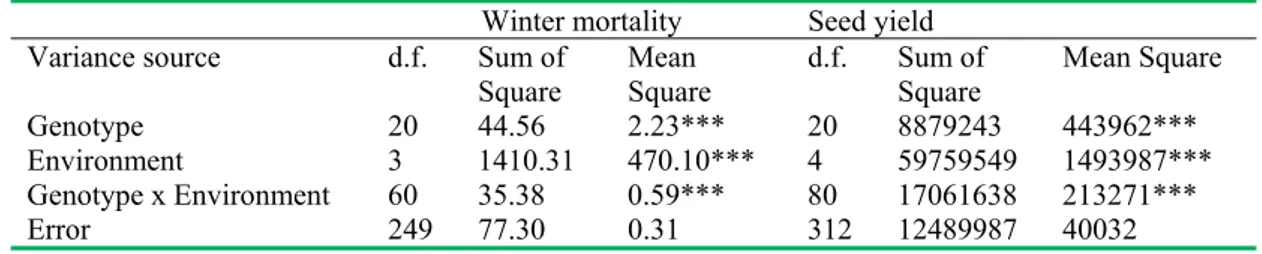
Variance components for winter mortality score and seed
yield from combined analysis of twenty-one genotypes of common vetch grown at five environments were presented in Table 1. For both winter mortality score and seed yield, there were highly significant differences between genotypes, environments and genotype x environment interactions (P<0.001) (Table 1)
On average, across the environments winter mortality (Table 2) score ranged from 3.00 in Ea1 (i.e. very mild winter in 2000/01) to 8.65 in Ea2 (i.e. severe
winter in 2001/02). All genotypes had the same winter mortality score (3.00) in Ea1, while almost all plants in the experimental plots died as the result of freezing temperatures during the winter of Ea2. The Ea3 (2002/03) and Ea4 (2003/04) were appropriate test environments for winter mortality, which clearly displayed the range of winter hardiness among the studied genotypes. In Ea3 the three genotypes (L-1500, L-1540 and L-1544) had the lowest mortality (5.25) together, while in Ea4
Table 1. Variance components for winter mortality score and seed yield from combined analysis of variance for the 21 genotypes of common vetch (Vicia sativa).
Winter mortality Seed yield
Variance source d.f. Sum of
Square MeanSquare d.f. Sum of Square Mean Square
Genotype 20 44.56 2.23*** 20 8879243 443962***
Environment 3 1410.31 470.10*** 4 59759549 1493987***
Genotype x Environment 60 35.38 0.59*** 80 17061638 213271***
Error 249 77.30 0.31 312 12489987 40032
***: significant at P< 0.001.
Table 2. Winter mortality scores (1-9) of the 21 genotypes in the yield trials established in autumns ( Ea1, Ea2, Ea3 and Ea4) at Ikizce Research Farm
of the CRIFC, Ankara
Genotype 2000/01 2001/02 2002/03 2003/04
Mean
Ea1 Ea2 Ea3 Ea4
L-1430 3.00 8.00 de 6.50 bcd 6.63 def 6.03 fgh
L-1431 3.00 8.25 cd 6.50 bcd 6.88 bcde 6.16 defg
L-1439 3.00 8.50 bc 6.25 bcd 6.88 bcde 6.16 defg
L-1442 3.00 9.00 a 6.75 abc 7.25 bcd 6.50 bcd
L-1453 3.00 9.00 a 7.50 ab 7.50 ab 6.75 ab
L-1469 3.00 8.75 ab 7.00 abc 6.88 bcde 6.41 bcdef
L-1475 3.00 9.00 a 7.00 abc 7.00 bcd 6.50 bcd
L-1477 3.00 9.00 a 6.75 abc 7.13 bcd
6.47 bcde
L-1500 3.00 8.25 cd 5.25 d 6.25 efg 5.69 hi
L-1501 3.00 9.00 a 6.25 bcd 7.00 bcd 6.31 cdef
L-1503 3.00 9.00 a 6.00 cd 7.00 bcd 6.25 cdef
L-1526 3.00 9.00 a 6.25 bcd 7.00 bcd 6.31 cdef
L-1540 3.00 9.00 a 5.25 d 6.00 fg 5.81 ghi
L-1543 3.00 9.00 a 6.00 cd 7.25 bcd 6.31 cdef
L-1544 3.00 7.75 e 5.25 d 5.75 g 5.44 i
L-1548 3.00 8.25 cd 6.50 bcd 6.88 bcde
6.16 defg
L-1551 3.00 8.00 de 6.50 bcd 6.75 cde 6.06 efgh
L-292/1 3.00 9.00 a 7.00 abc 7.38 abc 6.59 abc
L-581 3.00 8.00 de 6.00 cd 6.00 fg 5.75 ghi
KaraElci 3.00 9.00 a 8.00 a 8.00 a 7.00 a
SarElci 3.00 9.00 a 7.25 abc 7.13 bcd 6.59 abc
Figure 2 Frequency distributions of the eight plant metric characters, with normal curves superimposed: significant difference between means (X) of the selected lines (n=18) and base lines (n=164 accessions), and coefficient of variation (CV %) for (a) winter hardiness, (b) days-to-flowering, (c) days-to-harvesting, (d) stem length, (e) number
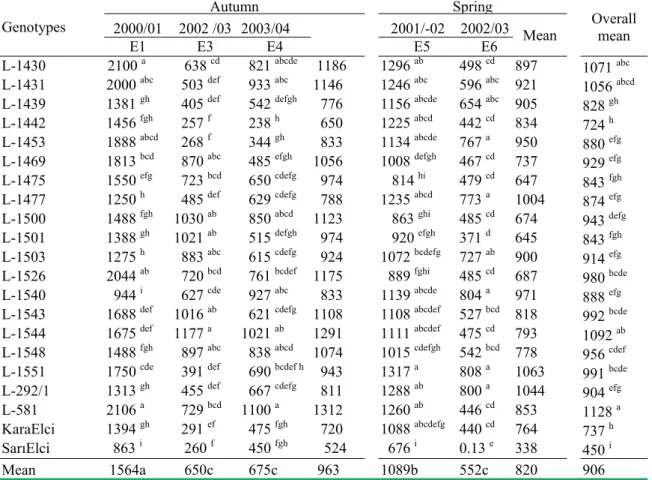
Table 3. Seed yield (kg ha-1) of the 21 genotypes in the yield trials established in autumn (Ea1, Ea3 and
Ea4) and spring (E5 and E6) at Ikizce Research Farm of the CRIFC, Ankara.
Genotypes 2000/01 2002 /03 2003/04 Autumn 2001/-02 2002/03 MeanSpring Overall mean
E1 E3 E4 E5 E6
L-1430 2100 a 638 cd 821 abcde 1186 1296 ab 498 cd 897
1071 abc
L-1431 2000 abc 503 def 933 abc 1146 1246 abc 596 abc 921 1056 abcd
L-1439 1381 gh 405 def 542 defgh 776 1156 abcde 654 abc 905 828 gh
L-1442 1456 fgh 257 f 238 h 650 1225 abcd 442 cd 834 724 h
L-1453 1888 abcd 268 f 344 gh 833 1134 abcde 767 a 950 880 efg
L-1469 1813 bcd 870 abc 485 efgh 1056 1008 defgh 467 cd 737 929 efg
L-1475 1550 efg 723 bcd 650 cdefg 974 814 hi 479 cd 647 843 fgh
L-1477 1250 h 485 def 629 cdefg 788 1235 abcd 773 a 1004
874 efg
L-1500 1488 fgh 1030 ab 850 abcd 1123 863 ghi 485 cd 674
943 defg
L-1501 1388 gh 1021 ab 515 defgh 974 920 efgh 371 d 645 843 fgh
L-1503 1275 h 883 abc 615 cdefg 924 1072 bcdefg 727 ab 900 914 efg
L-1526 2044 ab 720 bcd 761 bcdef 1175 889 fghi 485 cd 687 980 bcde
L-1540 944 i 627 cde 927 abc 833 1139 abcde 804 a 971 888 efg
L-1543 1688 def 1016 ab 621 cdefg 1108 1108 abcdef 527 bcd 818 992 bcde
L-1544 1675 def 1177 a 1021 ab 1291 1111 abcdef 475 cd 793 1092 ab
L-1548 1488 fgh 897 abc 838 abcd 1074 1015 cdefgh 542 bcd 778
956 cdef
L-1551 1750 cde 391 def 690 bcdef h 943 1317 a 808 a 1063
991 bcde
L-292/1 1313 gh 455 def 667 cdefg 811 1288 ab 800 a 1044 904 efg
L-581 2106 a 729 bcd 1100 a 1312 1260 ab 446 cd 853 1128 a
KaraElci 1394 gh 291 ef 475 fgh 720 1088 abcdefg 440 cd 764 737 h
SarElci 863 i 260 f 450 fgh 524 676 i 0.13 e 338 450 i
Mean 1564a 650c 675c 963 1089b 552c 820 906 Means followed by the same letter are not significantly different
L-1544 possessed the lowest mortality score, which was followed by the accessions L-581 (6.00), L-1540 (6.00) and L-1500 (6.25). In overall environments, the three accessions (L-1544, L-581 and L-1500) acquired the least mortality scores (5.44, 5.69 and 5.81), whereas the two local checks (SarıElçi and KaraElçi) produced the highest mortality scores (6.59 and 7.00), respectively. The average seed yield (Table 3) varied between 1564 kg/ha in Ea1 ( following the mild winter in 2000/01) and 552 kg/ha in Es6 ( following the drought in late spring of 2002/03). For the autumn plantings, the accessions (L-581 and L-1430) produced the greatest seed yields (2106 and 2100 kg/ha) in Ea1, while in Ea3 and Ea4 L-1544 and L-581 did the best (1177 and 1100 kg/ha), respectively. For the spring sowings, L-1551 possessed the highest seed yields in Es5 (1317 kg/ha) and in Es6 (808 kg/ha). Over the environments, L-581produced the greatest seed yield (1128 kg/ha), and followed by L-1544 (1092 kg/ha), whereas local check SarıElçi acquired the lowest seed yield (450 kg/ha).
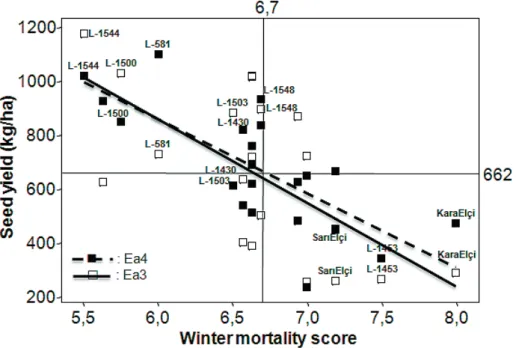
Relations of the seed yield with winter mortality
Mean winter mortality scores of 21 genotypes in two cold environments (Ea3 and Ea4) were linearly associated with the seed yields: Ea3 (P<0.01 and r2=0.41), Ea4 (P<0.001
and r2=0.54) (Fig. 3). Furthermore, in conjunction with
these relations in both cold years among 21 genotypes, three accessions (L-581, L-1500 and L-1544) scored as the superior lines in winter survival, were located on upper part of the regression lines (i.e. highest seed yielding), while two checks (cv. KaraElçi and var. SarıElçi) gathered on the right bottom quarter (i.e. lowest seed yielding) (Fig. 3). In addition, linear regression lines of these two cold environments appeared to be very similar (Fig. 3).
Genotype adaptation
Genotype-Figure 3. Relations between mean winter mortality score (1-9) and seed yields (kg/ha) of the 21 genotypes in two environments (Ea3 (): Y=2738-313.1X, r2=0.41, P<0.01; Ea4 (): Y=2504-274.1X, r2=0.54, P<0.
Table 4. Analysis of variance estimated over stability parameters for seed yield
Source of variation df Mean Square
Genotype (G) 20 110993**
Environments (E) (linear) 1 14901914**
Environment (E) + (Gx E) 84 228634**
G x E (linear) 20 83309*
Pooled deviation (residual) 63 41861**
Pooled error 315 10313
*, **: significant at P< 0.05, 0.01, respectively. Error mean square was divided by the number of replications (4) since the error sum of square estimated over replications.
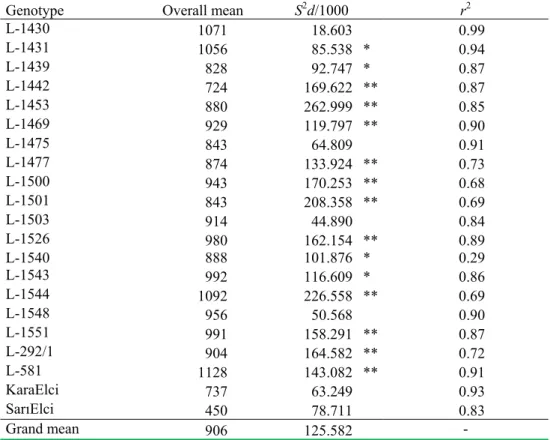
environment (linear) interactions and deviation around the regression lines were significantly different (P<0.05), P<0.01 respectively) (Table 4). Estimates of stability parameters (S2d and r2) for overall seed mean (Table 5)
show a large variation in coefficient of determination (r2),
ranging from 0.29 to 0.99. Linear responses to changes in environment (b) ranged from 0.24 to 1.53 (Fig. 4). Regression coefficients (b) of the three lines (1442, L-1503 and L-1540) showed significant differences from 1.0, whereas ten genotypes had an average stability (regression coefficient did not differ significantly from 1.0) with seed yield above the grand mean (Fig. 4). Among these ten genotypes, lines L-1430 and L-1548 possessed S2d values not significantly different from zero
(Table 4).
The four genotypes (L-1430, L-581, L-1431 and L-1526) with the greatest regression coefficient and mean seed
yield appeared in the right upper quarter of the scattered plot, whereas the accessions L-1544, L-1548 and L-1500 with low mean regression coefficients and above average seed yield were placed in the right lower quarter (Fig. 4). The var. SarıElçi mapped towards the end of left lower quarter with coefficient less than 1.0 and far below mean seed yield, whilst cv. KaraElçi had above average coefficient, but below mean yield (Fig. 4).
DISCUSSION
Figure 4. The relationship between the regression coefficient of individual seed yields on mean environment yields (b) of the 21 genotypes of common vetch. Estimates of (b) were significantly different from 1.0 (P<0.05) only for those entries indicated by . The brake-lines indicate confidence limits for mean seed yield (906 ± 67.95) and for
regression coefficient (1.00 ± 0.16).
the vetch germplasm for winter hardiness, maturity and biomass. In comparison with the base populations, selections substantially improved the winter survival and consequent yield.
Basically breeding for winter hardiness is a breeding for adaptation, and as the winter conditions vary considerably even within and between years, new cultivars should possess tolerance to the various winter stress factors. Test for cold hardiness in multi-environment trials seems to give the best indication of overall wintering ability for vetch genotypes. Subsequently, a few environments can be appropriate for detection of superior genotypes. In different test winters, specific components may be critical for survival [18]. In the winter of 2001/02 freeze-thaw cycles in early spring, and prolonged freezing temperatures were the main causes for winter mortality. In autumn-sowings, three accessions (L-1500, L-1544 and L-581) had the lowest winter mortality scores (i.e. tolerant), which was significantly less than that of checks (cv. KaraElçi and var. SarıElçi). Twenty-one genotypes responded to increased rainfall and mild winter temperature in 2000/01 (Ea1), with an overall increase in seed yield of 38% compared with overall mean of autumn plantings. Autumn-sown vetch showed 15% greater potential for seed yield than spring vetch (Table 3). Early flowering can permit a long grain-filling time during which photosynthetic components remain green;
in consequence, it improves grain filling. This early flowering and podding combined with vigorous early growth resulted rapid canopy development and dry matter production [26], which laid the potential for a larger total biomass and higher seed yield. Therefore, selection for more rapid crop growth in spring is likely to increase the common vetch yield.
Table 5. Estimates of stability parameters (S2d and r2) for the seed yield of the 21
genotypes of common vetch based on the five environments
Genotype Overall mean S2d/1000 r2
L-1430 1071 18.603 0.99
L-1431 1056 85.538 * 0.94
L-1439 828 92.747 * 0.87
L-1442 724 169.622 ** 0.87
L-1453 880 262.999 ** 0.85
L-1469 929 119.797 ** 0.90
L-1475 843 64.809 0.91
L-1477 874 133.924 ** 0.73
L-1500 943 170.253 ** 0.68
L-1501 843 208.358 ** 0.69
L-1503 914 44.890 0.84
L-1526 980 162.154 ** 0.89
L-1540 888 101.876 * 0.29
L-1543 992 116.609 * 0.86
L-1544 1092 226.558 ** 0.69
L-1548 956 50.568 0.90
L-1551 991 158.291 ** 0.87
L-292/1 904 164.582 ** 0.72
L-581 1128 143.082 ** 0.91
KaraElci 737 63.249 0.93
SarElci 450 78.711 0.83
Grand mean 906 125.582
-Estimates of S2d were significantly different from 0.0, and *, **: significant at P<0.05, 0.01, respectively.
yield (Table 3). Therefore, it has appeared that winter hardiness and earliness are important traits for sustained seed yield for autumn-sown vetch in CHT.
Among twenty-one genotypes, as winter mortality decreased, seed yield increased in two cold environments (Ea3 and Ea4) (r2=0.41 and r2=0.54) (Fig. 3). These
consistent results in both environments indicate that the variation in winter mortality and related seed yields of 21 vetch genotypes occurred due to the genotypic rather than environmental differences.
Eberhart and Russel (1966) [7] suggested that an ideal genotype is one which has the highest yield over a broad range of environments, a regression coefficient (b) value of 1.0 and deviation mean square (S2d) of zero. Langer
et al (1979) [17] reported that the regression coefficient is a measure of response to varying environments and the mean square deviation from linear regression is a true measure of production stability. For seed yield, the research results showed that the G x E interaction component is a linear function of the environmental means (Table 4). Therefore, it is possible to judge the stability of 21 genotypes using definition, and to consider
their mean performances. Accordingly, two genotypes (L-1430 and L-1548) across all environments were the most stable (their regression coefficients did not differ significantly from 1.0) with above average seed yield and low S2d values (insignificant from zero) (Table 4). These
can be considered the most widely adapted genotypes, their selection for further use is therefore desirable. Two local checks (cv. KaraElçi and var. SariElçi) were found to be stable (low S2d values), but their yield were
low. Two genotypes (L- L-1540 and L-1442) with yield less than the grand mean, and b values significantly different from 1.0, were relatively better adapted to poor environments (Fig. 4). Large variation in the regression coefficients indicated the genotypes responded differently to environments. For example, three genotypes (L-581, L-1500 and L-1544) had the best winter survival and highest seed yield in two cold environments (Ea3 and Ea4). Thus, we concluded that the accessions L-1430 and L-1548 are the most stable across six environments, while two genotypes L-581 and L-1544 are the best for autumn sown vetch in the CHT.
enhanced adaptation: (1) selection within the vetch germplasm with a wide spectrum of phenotypic variation was an effective tool in identifying lines for use in autumn plantings; (2) the linear decline in winter survival indicates that these two cold environments imposed the same effect on winter survival.
In conclusion, our results have demonstrated the central role of rainfall and temperature on yield. In this type of stress environments ‘winter hardiness’ was defined in terms of yield under stress as it reflects the yield potential, and positive relation of winter survival with seed yield is a clear indication of that genetic enhancement. Furthermore, we believe that genetic selection continues to be the primary mechanism by which we increase yield and stress tolerance. Eventually, however, empirical selection will give decreasing returns. Therefore, for more precise definition of target traits and more directed breeding, further studies on winter-hardy vetch lines are necessary to analyze physiological, biochemical, and genetic mechanisms controlling hardening process and dormancy in autumn, survival in winter and re-growth in early spring.
ACKNOWLEDGEMENTS
This study was funded from the core budget of the Central Research Institute for the Field Crops. The authors thank Mr. Hasan Uzunoğlu for excellent field assistance and Dr Henry Thomas for helpful comments on the manuscript, Dr. Surrenda P.S. Beniwal for providing vetch germplasm, and Dr Hüseyin Tosun and Dr Aydan Ottekin for administrative support.
REFERENCES
[1] Abd El Moneim A.M., Agronomic potential of three vetches (Vicia spp.) under rainfed conditions, J. Agronomy and Crop Science. (1993) 170: 113-120.
[2] Abd El Moneim A.M., Cocks P.S., Adaptation and yield stability of selected lines of Lathyrus spp. under rainfed conditions in West Asia, Euphytica (1993) 6689-97.
[3] Açıkgöz E., Parameters of cold tolerance in common vetch, Euphytica (1982) 31: 997-1001.
[4] Açıkgöz E., Katkat A.V., Ömeroğlu S., Okan B., Mineral elements and amino acid concentrations in field pea and common vetch herbages and seeds, J. Agronomy & Crop Science (1985)155: 179-185.
[5] Açıkgöz E., Annual forage legumes in the arid and semi-arid regions of Turkry, in: Beck D.P., Materon L.A. (Eds.), Nitrogen Fixation by Legumes in Mediterranean Agriculture, Martinus Nijhoff Publishers, 1988, pp.
47-54.
[6] Annicchaiarico P., Pecetti L., Morpho-physiological traits to complement grain yield selection under semi-arid Mediterranean conditions in each of the drum wheat types mediterraneum typicum and syriacum, Euphytica (1995) 86:191-198.
[7] Eberhart S.A., Russell W.A., Stability parameters for comparing varieties, Crop Science (1966) 6:36-40.
[8] Finlay W.K., Wilkonsin G.N., The analysis of adaptation in plant breeding programmes, Australian Journal of Agricultural Research (1963) 14:742-754.
[9] Fırıncıoğlu H.K., Vetch production in Turkey, Grain Legumes. (2006) 47:20-21.
[10] Fırıncıoğlu H.K., Christiansen S., Lamont E.J., Unal S., Peskircioglu M., Beniwal S.P.S., Village, farm, and pasture resource assessment in planning a forage, livestock, and range improvement project for the central highlands of Turkey, in: Haddad, N., Tutwiller, R., Thomson, E.., (Eds.), The Proceedings of the Regional Symposium on Integrated Crop-Livestock Systems in the Dry Areas of West Asia and North Africa, Amman, JORDAN, 1997, pp.39-50.
[11] Fırıncıoğlu H.K., Karagüllü N., Unal S., El-Moneim A.M.A., Beniwal S.P.S., Improving Feed Legumes for the Central Highlands of Turkey, in: Haddad N., Tutwiler R., Thomson E., (Eds.), Proceedings of The Regional Symposium on Integrated Crop-Livestock Integration Systems in the Dry Areas of West Asia and North Africa, Amman, Jordan, 1997, pp.214-232.
[12] Fırıncıoğlu H.K., Tate M., Ünal S., Doğruyol L., Özcan İ., A selection strategy for low toxin vetches, Turk. J Agric For. (2007) 31:303-311.
[13] Humpreys M.O., A genetic approach to the multivariate differentiation of perennial ryegrass (Lolium perenne L.) cultivars, Heredity (1991) 66:437-443.
[14]Kahraman A., Küsmenoğlu I., Aydin N., Aydoğan A., Erskine W., Muehlbauer F.J., Genetics of winter hardiness in 10 lentil inbred line populations, Crop. Sci. (2004) 44:5-12.
[15] Keatinge J.D.H., Asghar A., Khan B.R., Moneim A.M.A.E., Ahmad S., Germplasm evaluation of annual sown forage legumes under environmental conditions marginal for crop growth in the Highlands of West Asia, J. Agronomy & Crop Science (1991) 166:48-57.
December, Antalya, Turkey, 1995, pp. 63-71.
[17] Langer S., Frey K.J., Baily T., Association among productivity and stability indices in oat varieties, Euphytica (1979) 28:17-24.
[18] Palta J.P., Bamberg J.B., Chen T., Vega S.E., Weib L.S., Karlsson B.H., Understanding genetic control of freezing resistance using potato species as a model system, in: Li P.H., Chen T.H.H. (Eds.), Plant cold hardiness-molecular biology, biochemistry and physiology. Plenum Press, Newyork, 1997, p. 67-76.
[19] Pinthus, M.J., Estimates of genotypic value: a proposed method, Euphytica (1973) 22:345-351.
[20] Ratinam M., Abd-El Moneim A.M., Saxena M.C., Variations in sugar content and dry matter distribution in roots and their associations with frost tolerance in certain forage legume species, J. Agronomy & Crop Science, (1994) 173:345-353.
[21] Sabancı C.O. Stability parameters and methods for analysis, Anadolu J of A.A.R.I. 1997, 7(1):75-90
[22] Sıncık M., Bilgili U., Uzun A., Açıkgöz E., Effect of low temperatures on the germination of different field pea genotypes, Seed Sci. & Technol (2004) 32:331-339.
[23] Singh K.B., Chickpea breeding, in: Saxena M.C., Singh K.B. (Eds.), The Chickpea, C.A.B. International Wallingford, UK., 1987, pp.127-162.
[24]SIS. Statistic Yearbook. State Statistic Institute of the Turkish Republic, Ankara. Turkey, 2006.
[25] Steel G.D. and Torrie J.H., Principals and Procedures of Statistics with Special Reference to biological Science, New York, McGraw Hill. 1960.
[25] Thomson B.D., Siddique K.H.M., Barr M.D., Wilson J.M., Grain legume species in low rainfall Mediterranean-type environments I. Phenology and seed yield, Field Crops Research (1997) 54:173-187.