Submitted10 August 2016 Accepted 8 November 2016 Published8 December 2016
Corresponding author Matthew B. Sullivan, [email protected]
Academic editor Tanja Woyke
Additional Information and Declarations can be found on page 11
DOI10.7717/peerj.2777
Copyright 2016 Roux et al.
Distributed under
Creative Commons CC-BY 4.0
OPEN ACCESS
Towards quantitative viromics for both
double-stranded and single-stranded
DNA viruses
Simon Roux1, Natalie E. Solonenko1, Vinh T. Dang2, Bonnie T. Poulos3, Sarah
M. Schwenck3, Dawn B. Goldsmith4, Maureen L. Coleman5, Mya Breitbart4and
Matthew B. Sullivan1,6
1Department of Microbiology, The Ohio State University, Columbus, OH, United States 2Department of Microbiology, Ha Long University, Uong Bi, Quang Ninh, Vietnam
3Department of Ecology and Evolutionary Biology, University of Arizona, Tucson, AZ, United States 4College of Marine Science, University of South Florida, St. Petersburg, FL, United States
5Department of the Geophysical Sciences, University of Chicago, Chicago, IL, United States
6Department of Civil, Environmental and Geodetic Engineering, The Ohio State University, Columbus, OH,
United States
ABSTRACT
Background. Viruses strongly influence microbial population dynamics and ecosystem functions. However, our ability to quantitatively evaluate those viral impacts is limited to the few cultivated viruses and double-stranded DNA (dsDNA) viral genomes captured in quantitative viral metagenomes (viromes). This leaves the ecology of non-dsDNA viruses nearly unknown, including single-stranded DNA (ssDNA) viruses that have been frequently observed in viromes, but not quantified due to amplification biases in sequencing library preparations (Multiple Displacement Amplification, Linker Amplification or Tagmentation).
Methods. Here we designed mock viral communities including both ssDNA and
dsDNA viruses to evaluate the capability of a sequencing library preparation approach including an Adaptase step prior to Linker Amplification for quantitative amplification of both dsDNA and ssDNA templates. We then surveyed aquatic samples to provide first estimates of the abundance of ssDNA viruses.
Results. Mock community experiments confirmed the biased nature of existing library preparation methods for ssDNA templates (either largely enriched or selected against) and showed that the protocol using Adaptase plus Linker Amplification yielded viromes that were±1.8-fold quantitative for ssDNA and dsDNA viruses. Application of this protocol to community virus DNA from three freshwater and three marine samples revealed that ssDNA viruses as a whole represent only a minor fraction (<5%)
of DNA virus communities, though individual ssDNA genomes, both eukaryote-infecting Circular Rep-Encoding Single-Stranded DNA (CRESS-DNA) viruses and bacteriophages from theMicroviridaefamily, can be among the most abundant viral genomes in a sample.
Discussion. Together these findings provide empirical data for a new virome library preparation protocol, and a first estimate of ssDNA virus abundance in aquatic systems.
SubjectsEcology, Genomics, Microbiology, Virology
INTRODUCTION
It is now increasingly clear that microorganisms play a central role in all of Earth’s ecosystems and processes. In every biome—from the human gut to the oceans, soils, and extreme environments that challenge life to succeed—microbes drive the nutrient and energy transformations that fuel these ecosystems (Falkowski, Fenchel & Delong, 2008;
Sommer & Bäckhed, 2013). Microbial diversity was first revealed through universal marker genes studies (Pace, 1997), and has now advanced to genome-level characterizations helping revise our understanding of the microbial tree of life (Rinke et al., 2013;Hug et al., 2016), as well as elucidate the ecological and evolutionary roles of lesser-studied microbial lineages (Wrighton et al., 2012;Castelle et al., 2013;Brown et al., 2015).
Recent technical and theoretical advances are now also revealing that these microbial roles are modulated by co-occurring and co-evolving viruses (Weitz, 2015;O’Malley, 2016). Viruses are the most abundant biological entities on Earth, and have profound impacts on their microbial hosts through mortality, horizontal gene transfer and metabolic reprogramming (Fuhrman, 1999;Suttle, 2007;Rohwer & Thurber, 2009). Since most microbes and viruses remain uncultivated and viruses do not harbor a universal marker gene, community-level surveys of viruses typically rely on laboratory culture or reference-independent methods such as viral metagenomics (a.k.a. viromics). These studies have provided a view of viral diversity that complements knowledge obtained from isolate collections, and revealed new viral groups, evolutionary patterns, and virus-host interactions in multiple systems (Edwards & Rohwer, 2005;Mokili, Rohwer & Dutilh, 2012;
Fancello, Raoult & Desnues, 2012;Brum & Sullivan, 2015).
Because natural community samples typically yield limiting input DNA, multiple displacement amplification (MDA) or whole genome amplification (WGA) are commonly used prior to sequencing library preparation in viromics studies (Edwards & Rohwer, 2005;Brum & Sullivan, 2015). While these MDA viromes routinely uncover new viruses (Angly et al., 2006;Angly et al., 2009;Wegley et al., 2007; Kim et al., 2008; Willner et al., 2009;Ng et al., 2009;Rosario et al., 2009;Rosario, Duffy & Breitbart, 2009;López-Bueno et al., 2009;Roux et al., 2012a;Roux et al., 2012b;Labonté & Suttle, 2013a;Labonté & Suttle, 2013b;Zawar-Reza et al., 2014;Quaiser et al., 2015;Dayaram et al., 2016;Male et al., 2016;
Steel et al., 2016), the MDA step selects for small circular ssDNA templates, and unevenly amplifies linear genome fragments even when pooling independent reactions (Yilmaz, Allgaier & Hugenholtz, 2010;Kim & Bae, 2011;Marine et al., 2014). The alternative linker amplification (LA) or tagmentation (TAG) methods are quantitative (±1.5-fold) for dsDNA viruses, even from low input samples (100 femtograms, Duhaime et al., 2012) but strongly select against ssDNA templates (Kim & Bae, 2011). This leaves researchers to choose between quantitatively studying dsDNA viruses alone or pursuing questions constrained to discovery rather than ecology if interested in both ssDNA and dsDNA viruses.
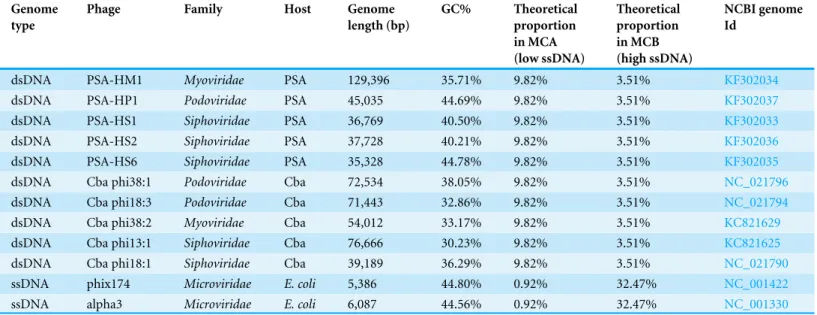
Table 1 Characteristics of phage genomes included in the mock communities.
Genome type
Phage Family Host Genome
length (bp)
GC% Theoretical
proportion in MCA (low ssDNA)
Theoretical proportion in MCB (high ssDNA)
NCBI genome Id
dsDNA PSA-HM1 Myoviridae PSA 129,396 35.71% 9.82% 3.51% KF302034
dsDNA PSA-HP1 Podoviridae PSA 45,035 44.69% 9.82% 3.51% KF302037
dsDNA PSA-HS1 Siphoviridae PSA 36,769 40.50% 9.82% 3.51% KF302033
dsDNA PSA-HS2 Siphoviridae PSA 37,728 40.21% 9.82% 3.51% KF302036
dsDNA PSA-HS6 Siphoviridae PSA 35,328 44.78% 9.82% 3.51% KF302035
dsDNA Cba phi38:1 Podoviridae Cba 72,534 38.05% 9.82% 3.51% NC_021796
dsDNA Cba phi18:3 Podoviridae Cba 71,443 32.86% 9.82% 3.51% NC_021794
dsDNA Cba phi38:2 Myoviridae Cba 54,012 33.17% 9.82% 3.51% KC821629
dsDNA Cba phi13:1 Siphoviridae Cba 76,666 30.23% 9.82% 3.51% KC821625
dsDNA Cba phi18:1 Siphoviridae Cba 39,189 36.29% 9.82% 3.51% NC_021790
ssDNA phix174 Microviridae E. coli 5,386 44.80% 0.92% 32.47% NC_001422
ssDNA alpha3 Microviridae E. coli 6,087 44.56% 0.92% 32.47% NC_001330
Notes.
PSA,Pseudoalteromonas; Cba,Cellulophaga baltica;E. coli,Escherichia coli.
named A-LA for Adaptase-Linker Amplification, alongside two existing protocols (MDA and TAG) for their ability to quantitatively amplify ssDNA and dsDNA viruses from two mock viral communities. Then, we apply the methods to aquatic samples known to harbor ssDNA viruses and estimate the relative abundance of ssDNA viruses.
MATERIAL & METHODS
Mock community generation
The ten dsDNA phages included in the mock communities were grown on
PseudoalteromonasorCellulophaga baltica(Table 1,Duhaime et al., 2011;Holmfeldt et al., 2013). These were selected to represent the three main families of dsDNA bacteriophages (Myoviridae,Podoviridae, andSiphoviridae), a range of genome length (35–130 kb) and GC% (30–45%). The two ssDNA phages included were phiX174 and alpha 3, representing two distinct clades in the well-characterized Microvirusgenus (from theMicroviridae
family), both grown onEscherichia coli(Rokyta et al., 2006).
For each mix, DNA was extracted with the QIAamp DNA Mini Kit (Qiagen 51304). Triplicate viromes were generated using DNA extracted from these two mock communities with three different sequencing library protocols (A-LA, TAG and MDA). This experimental design allowed us to evaluate the potential influence of both the DNA extraction step (same bias across all methods, as the same pool of DNA was used as input for all methods in MCA and MCB samples) and the DNA amplification step (different biases between methods) at three different levels: (i) the relative proportion of ssDNA vs dsDNA viruses, (ii) the relative proportion of individual genomes within ssDNA and dsDNA virus communities, and (iii) the coverage variation within a genome. The MDA library was generated using the GE HealthCare GenomiPhi v2 DNA Amplification Kit followed by NexteraXT DNA Library Preparation Kit, the TAG library using the standard NexteraXT DNA Library Preparation Kit, and the A-LA library with the Swift 1S Plus DNA Library Kit for Illumina. All samples were sequenced on the Illumina MiSeq platform.
Mock community viromes: read quality control, assembly, and annotation
Within dsDNA viruses, the influence of mock community (A or B), library preparation method (MDA, TAG, A-LA), and genome on relative abundance (which should theoretically be 10% for every genome) was investigated with Kruskal–Wallis tests. Each genome’s relative abundance was compared between A-LA and TAG libraries using a Wilcoxon two-sided test (Fig. S2). Similarly, statistically different ranges of coverage variations for each genome between the different library preparation methods were assessed with Wilcoxon two-sided tests (Fig. S3). All plots and tests were conducted with the R software (R Core Team, 2016) and the ggplot2 module (Wickham, 2016).
Environmental virome sampling and processing
For freshwater lakes, three integrated water column samples were taken in April 2013 in Lake Superior (SU08M), Lake Erie (ER15M), and Lake Michigan (MI41M). Samples from three different depths (a ‘‘surface’’ sample at∼2 m for all lakes, an ‘‘intermediate’’ sample at 30 m for Lake Erie, 100 m for Lake Michigan and Superior, and a ‘‘deep’’ sample at 53 m for Lake Erie, 249 m for Lake Michigan, and 282 m for Lake Superior) were combined, since the lakes were not stratified at the time of the sampling. For each lake, 33 to 45L of water were 0.22µm-filtered and viruses were concentrated from the filtrate using iron
chloride flocculation (John et al., 2011) followed by storage at 4 ◦C. One seawater sample
originates from the Tara Oceans expedition collection (sample T102S) and was processed as previously described (Pesant et al., 2015). Briefly, 20 L of seawater were 0.22µm-filtered,
and viruses were concentrated from the filtrate using iron chloride flocculation (John et al., 2011) followed by storage at 4 ◦C. In both cases, after resuspension in ascorbic-EDTA buffer (0.1 M EDTA, 0.2 M Mg, 0.2 M ascorbic acid, pH 6.0), viral particles were concentrated using Amicon Ultra 100 kDa centrifugal devices (Millipore), treated with DNase I (100 U/mL) followed by the addition of 0.1 M EDTA and 0.1 M EGTA to halt enzyme activity, and extracted with the QIAamp DNA Mini Kit (Qiagen 51304). The two remaining water samples were collected from 0 m and 100 m depths at the Bermuda Atlantic Time-series Study site in March 2011, where approximately 180L of seawater were concentrated using a 100kDa tangential flow filter, 0.22µm-filtered, PEG precipitated, cesium chloride
purified, and DNA was extracted using formamide (Goldsmith et al., 2015). All samples were sequenced on an Illumina MiSeq platform at the University of Arizona Genetics Core.
Environmental viromes read quality control, assembly, and identification of viral contigs
identified as a prophage). Another pipeline was applied to identify smaller viral contigs (<5 kb), which can be missed by VirSorter according to simulations (Roux et al., 2015): sequences with no significant BLAST hit (bit score > 50 ande-value < 10−3) against RefSeqVirus (i.e., no viral gene) and one significant hit (score > 50) against PFAM (i.e., one ‘‘known’’ gene) were considered as cellular and thus excluded (with the exception of ‘‘viral’’ PFAM domain, i.e., PFAM domains with the keyword ‘‘viral,’’ ‘‘phage,’’ ‘‘capsid,’’ ‘‘virion,’’ ‘‘terminase,’’ ‘‘tail,’’ or ‘‘portal’’). This allowed us to keep in the dataset both sequences similar to known viruses, and sequences entirely new (i.e., all uncharacterized genes), which in a virome are most likely viral.
Annotation of viral contigs from environmental viromes
QC’d reads from individual libraries were then mapped back to the contigs with Bowtie 2 (- -non-deterministic option, default options otherwise, (Langmead & Salzberg, 2012)) to evaluate the relative abundance of each sequence with each preparation method: contigs were considered detected in a library when≥50% of the contig was covered, and the contig relative abundance was calculated from the contig average coverage normalized by the number of bp sequenced in the library. Contig affiliation was based on best BLAST hit against RefSeqVirus (thresholds: bit score > 50 ande-value < 10−3). Contigs with best BLAST hits to only ssDNA or dsDNA viruses were considered ssDNA or dsDNA viruses respectively, while the genome type of contigs with no hits or mixed affiliations (i.e., hits to both ssDNA and dsDNA reference genomes) was predicted based on their coverage in the different libraries: contigs detected in TAG libraries were considered dsDNA, while contigs only detected in MDA and/or A-LA were predicted as ssDNA. In order to take into account the fact that dsDNA genomes will provide twice as many templates than ssDNA genomes per single virus in A-LA and MDA viromes (because the first step of the protocol is dsDNA denaturation), the coverage of all affiliated and predicted dsDNA contigs was divided by 2, so that the relative proportion of contigs are approaching the relative proportion of viral particles in the sample.
Scripts and datasets availability
All scripts and datasets used in this study are available on iVirus (CyVerse, http: //mirrors.iplantcollaborative.org/browse/iplant/home/shared/iVirus/DNA_Viromes_ library_comparison), as well ashttps://bitbucket.org/MAVERICLab/dna_viromes_library_ comparison(for scripts).
RESULTS & DISCUSSION
Mock community benchmarking for ssDNA and dsDNA genomic amplification
Two mock communities containing a minority (MCA) or majority (MCB) of ssDNA viruses were established from 2 ssDNA and 10 dsDNA viruses (Supplemental Information,
0 25 50 75 100 P rop ort ion (%) alpha3 phix174 Cba phi13:1 Cba phi18:1 Cba phi18:3 Cba phi38:1 PSA HM4
PSA HP1 PSA HS2 PSA HS6 Cba phi38:2 PSA HS9 ssDNA dsDNA
E 1 2 1 2 1 2 3
MDA TAG A-LA A-LA
E 1 2 3 1 2 3 1 2 3 TAG MDA
Mock Community A (low ssDNA) Mock Community B (high ssDNA)
A B 0 10 20 P rop ort ion A -L A (%) 30 Pearson Correlation: r = 0.75 p-value < 10-5
0 10 20
Proportion TAG (%) Relative abundance of viruses within dsDNA viral communities
ssDNA
ssDNA
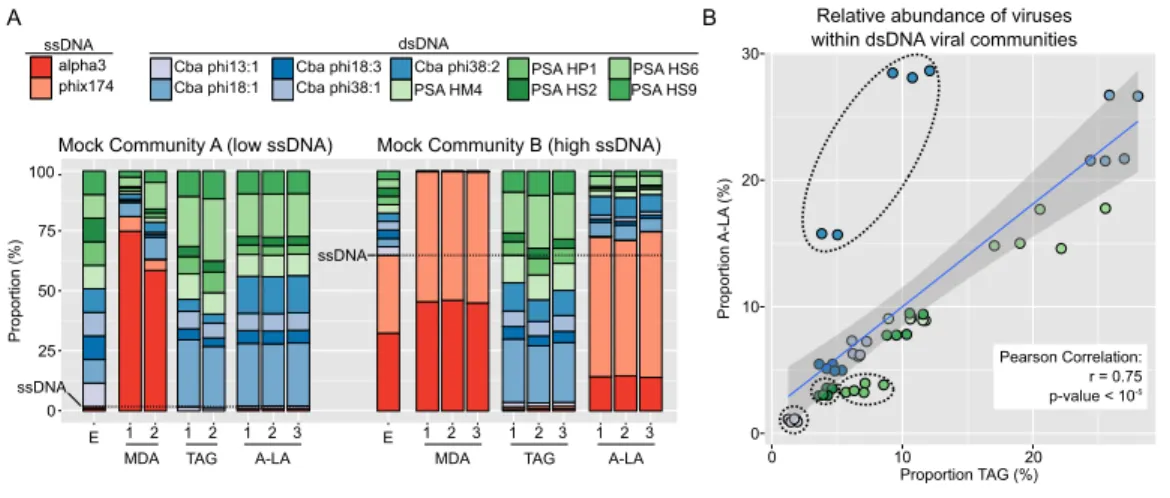
Figure 1 Comparison of amplification efficiency for ssDNA and dsDNA genomes of Multiple Dis-placement Amplification (MDA), Tagmentation (TAG) and Adaptase-Linker Amplification (A-LA) from mock community samples.(A) Composition of mock communities’ viromes prepared with MDA, TAG, and A-LA. For each community, the first bar displays the expected proportion of each virus (‘‘E’’), and replicates are noted with a number (1–3) when available. Expected proportions of ssDNA viruses are highlighted with a dashed horizontal line (1.8% and 64.9% of MCA and MCB respectively). (B) Correla-tion between the relative abundance of individual dsDNA viruses (within the dsDNA viral community) in TAG (x-axis) and A-LA (y-axis) viromes. The color code of circles is the same as in (A). Genomes for which the relative abundance distributions are significantly different in TAG vs A-LA are highlighted with dotted outline (Fig. S2).
As qualitatively observed previously (Kim & Bae, 2011), and here quantified, MDA systematically favored ssDNA viruses (∼30- to 40-fold), whereas TAG systematically selected against them (∼30- to 100-fold,Fig. 1A,Table S2). In contrast, A-LA correctly recovered the proportion of ssDNA viruses when they were in the majority (MCB, 1.1-fold variation), and slightly underestimated ssDNA viruses when they were in the minority (MCA, 1.8-fold variation,Fig. 1A,Table S2). These observations for all treatments were repeatable across duplicate or triplicate viromes (Fig. 1A). For A-LA viromes, the relative abundance of individual ssDNA viruses (within the ssDNA pool) was consistent across replicates, although not across the two mock communities (Table S2). This consistency across replicates suggests that the quantitative amplification of ssDNA viral communities through A-LA viromes is reproducible.
(10%±7–10, average±st. dev.) compared to the many-fold variation typically tolerable in viral ecological counts (Cunningham et al., 2015). Moreover, these per-genome relative abundance estimates were minimally impacted by the choice of library preparation method: for each individual genome, the relative abundances were not significantly different (Wilcoxon test,p-value > 0.01, effect size < 0.8) for six of the 10 genomes between TAG and A-LA (Fig. S2,Table S2). This suggests that the current method used for dsDNA viruses (TAG) and the method evaluated here (A-LA) provide a relatively similar view of dsDNA viral communities (Fig. 1B). A notable exception wasCellulophagaphage phi38:2, for which relative abundance was systematically higher (2- to 3-fold) in A-LA than TAG samples (Fig. 1B). This genome did not have unusual size or GC content compared to the others (Table 1), so the mechanism for this deviation remains unclear.
Second, coverage variation along each genome indicated that MDA coverage was significantly more variable than A-LA and TAG for all genomes but one, and TAG more variable than A-LA for 6 of 10 genomes (Wilcoxon test,p-value > 0.01, effect size < 0.8), with highly variable coverage in TAG datasets for low GC genomes (Fig. S3,Table S3). Thus, among the tested methods, the A-LA protocol produces the most even coverage across dsDNA viral genomes.
In summary, these mock community findings suggest that A-LA was uniquely able to quantitatively recover ssDNA virus relative abundances from both mock communities, and also more quantitatively represented the coverage within dsDNA genomes. This indicates that A-LA would be the library preparation method of choice when targeting both ssDNA and dsDNA viruses in surveys of natural communities.
Estimating the contribution of ssDNA viruses to aquatic viral communities
Given promising mock community benchmarking results, we next sought to apply these methods to establish their performances on natural communities, and to obtain first estimates of ssDNA virus sequence abundance in nature. To this end, we generated viromes for three freshwater and three seawater samples using the same library preparation protocols as above (MDA, TAG, A-LA; Supplemental Information). Overall, ssDNA viruses were detected in all samples, although these amounted only to 33–370 contigs in any given sample as compared to 14,000–99,000 dsDNA contigs (Table S4). However, because aquatic viruses are vastly under-represented in databases, a large proportion (35–71%) of the assembled contigs could not be confidently affiliated to either ssDNA or dsDNA viruses. Hence, we chose to generate a less stringent estimation of ssDNA contigs by adding all contigs not detected in TAG libraries (12,134–53,950 contigs,Table S4) to these BLAST-affiliated ssDNA sequences. Our reasoning is that unknown contigs detected in MDA or A-LA libraries (which will include ssDNA templates) and not in TAG libraries (strongly biased against ssDNA templates) likely originate from ssDNA genomes.
B A 0 25 50 75 100
T102S B0m B100m
ER15M MI41M SU08M*
Relat
ive
ab
undance
(%) Contig affiliation
dsDNA possible dsDNA ssDNA possible ssDNA Freshwater Seawater Library MDA A-LA 9 2 22 88 3 40 132 1 8 116 6
14 224 3015 1 369
B0m
T102S B100m
ER15M MI41M SU08M*
Figure 2 Relative abundance of ssDNA vs dsDNA viruses in freshwater and seawater samples and es-timated diversity of ssDNA viruses.(A) Composition of A-LA viromes from 6 aquatic samples (based on the read coverage of assembled contigs). Contigs were affiliated based on best BLAST hit to NCBI Ref-Seq Virus (‘‘dsDNA’’ and ‘‘ssDNA’’ contigs) or if not possible (no significant hit or mixed hits to both ds-DNA and ssds-DNA genomes), based on their coverage in the TAG virome (‘‘predicted dsds-DNA’’ if covered in TAG virome, ‘‘predicted ssDNA’’ otherwise). Relative abundance was calculated based on the cover-age of each contig by virome reads. ER15M: Lake Erie, MI41M: Lake Michigan, SU08M: Lake Superior, T102S: surface sample of station Tara Ocean 102, B0m and B100m: surface and 100 m-deep samples from the Bermuda Atlantic Time-series Study site collected in March 2011. (B) Comparison of ssDNA viruses contigs recovered in MDA and A-LA library. For each sample, a Venn diagram depicts the number of con-tigs affiliated to ssDNA detected in MDA, A-LA, and both libraries (concon-tigs detection based on a mapping of the library reads).∗
For sample SU08M, a limited number of quality-controlled reads were available for MDA and LA libraries (∼1 order of magnitude less than for other samples).
0.005–0.03% in freshwater and seawater viral communities, respectively (Fig. 2A,Table S5). Meanwhile, the putative new ssDNA viruses (i.e., A-LA/MDA-only unknown contigs) could account for as much as 1.91–68.00% of freshwater and 12.15–15.98% of seawater DNA viral communities (Fig. 2A). Because this class of contigs might also include rare dsDNA viruses that would be haphazardly represented and not detected due to chance in the TAG libraries, these values of ssDNA abundance should be treated as lower and upper bounds. In addition, these upper bounds are likely over-estimations, especially in samples where few TAG reads are available, such as SU08M from Lake Superior (total ssDNA fraction estimated at 72.68%). Nevertheless, these still suggest that ssDNA viruses are less abundant than dsDNA viruses in four of six aquatic samples tested here (Fig. 2A,Table S5) although further work is required to address the recovery efficiency of ssDNA vs dsDNA viruses using various concentration and DNA extraction methods, as well as compare their decay rate and stability under different storage conditions, since both could influence the relative abundance of ssDNA vs dsDNA viruses in viromes.
These abundant ssDNA viruses included bacteriophages (from theMicroviridae family) and eukaryotic circular Rep-encoding ssDNA (CRESS-DNA) viruses (Rosario et al., 2012) (Table S6). Thus, even when ssDNA viruses as a whole do not represent a large part of the DNA viral community (affiliated ssDNA viruses account for only 3.68% of the reads in this sample), individual ssDNA viruses can be abundant.
The MDA bias towards enrichment for ssDNA viruses can be a positive attribute: MDA libraries captured 2–15 times more ssDNA viral genomes (‘‘affiliated’’ ssDNA) than A-LA in four out of six samples (Fig. 2B). The two samples where MDA captured fewer ssDNA viruses represent unique situations: sample T102S had very few ssDNA viruses in any of its viromes, and the MDA library for sample SU08M was smaller by an order of magnitude relative to A-LA library due to multiplexing issues in the sequencing run (Table S5). Thus, when ssDNA viruses were available in the samples, and where sequencing depth was relatively consistent across library prep methods, MDA remains the clear method of choice to maximally enrich for ssDNA viruses if quantitative comparisons are not needed.
CONCLUSION
The description of a large unsuspected genetic diversity of ssDNA viruses across multiple ecosystems (Ge et al., 2011;Kim et al., 2011;Rosario, Duffy & Breitbart, 2012;Labonté & Suttle, 2013b;Eaglesham & Hewson, 2013;Quaiser et al., 2015;Dayaram et al., 2016), and unique evolutionary patterns including gene exchanges between RNA and DNA genomes (Krupovic, Ravantti & Bamford, 2009;Diemer & Stedman, 2012), have highlighted ssDNA viruses as one of the most intriguing viral groups in viral ecology. So far, two main types of ssDNA viruses have been frequently detected in viromes: eukaryote-infecting CRESS-DNA viruses and bacteriophages from theMicroviridaefamily. Novel and unusual ssDNA viruses continue to be isolated, particularly from eukaryotic and archaeal hosts (Tomaru et al., 2012;Mochizuki et al., 2012;Kimura & Tomaru, 2015). However, the relative abundance of ssDNA viruses among DNA viral communities remains an open and challenging question to address. Here, the use of A-LA library preparation protocol enabled us to quantify (±1.8-fold) the fraction of ssDNA and dsDNA viruses in natural communities. This revealed that ssDNA viruses are consistently present, but outnumbered by dsDNA viruses in all six aquatic samples tested. Nevertheless, individual ssDNA viruses were occasionally abundant, even when dsDNA viruses dominated the community. Hence, combined with the fact that ssDNA viruses likely infect a broad host range distinct from those of dsDNA viruses, the former should not be overlooked when investigating whole environmental viral communities and their impact on ecosystems.
ACKNOWLEDGEMENTS
ADDITIONAL INFORMATION AND DECLARATIONS
Funding
This research was funded by the National Science Foundation (grant #1536989), the Gordon and Betty Moore Foundation (grants #3790, #GBMF2631), and the Flinn Foundation to MBS. SR was partially supported by the University of Arizona Technology and Research Initiative Fund through the Water, Environmental and Energy Solutions Initiative and the Ecosystem Genomics Institute. MB and DBG were supported by NSF grants MCB-0701984 and DEB-1555854. The funders had no role in study design, data collection and analysis, decision to publish, or preparation of the manuscript.
Grant Disclosures
The following grant information was disclosed by the authors: National Science Foundation: #1536989.
Gordon and Betty Moore Foundation: #3790, #GBMF2631. Flinn Foundation.
University of Arizona Technology and Research Initiative Fund. NSF: MCB-0701984, DEB-1555854.
Competing Interests
The authors declare there are no competing interests.
Author Contributions
• Simon Roux and Matthew B. Sullivan conceived and designed the experiments, analyzed the data, wrote the paper, prepared figures and/or tables, reviewed drafts of the paper. • Natalie E. Solonenko conceived and designed the experiments, performed the
experiments, analyzed the data, wrote the paper, prepared figures and/or tables, reviewed drafts of the paper.
• Vinh T. Dang analyzed the data, wrote the paper, prepared figures and/or tables, reviewed drafts of the paper.
• Bonnie T. Poulos and Sarah M. Schwenck performed the experiments.
• Dawn B. Goldsmith, Maureen L. Coleman and Mya Breitbart conceived and designed the experiments, wrote the paper, prepared figures and/or tables, reviewed drafts of the paper.
DNA Deposition
The following information was supplied regarding the deposition of DNA sequences: All sequencing data and scripts used in the study are available at http://mirrors. iplantcollaborative.org/browse/iplant/home/shared/iVirus/DNA_Viromes_library_ comparison.
Data Availability
The following information was supplied regarding data availability: Bitbucket: DNA_viromes_library_comparison.
Supplemental Information
Supplemental information for this article can be found online athttp://dx.doi.org/10.7717/ peerj.2777#supplemental-information.
REFERENCES
Aigrain L, Gu Y, Quail MA. 2016.Quantitation of next generation sequencing library preparation protocol efficiencies using droplet digital PCR assays—a systematic comparison of DNA library preparation kits for Illumina sequencing.BMC Genomics 17:458 DOI 10.1186/s12864-016-2757-4.
Angly FE, Felts B, Breitbart M, Salamon P, Edwards RA, Carlson C, Chan AM, Haynes M, Kelley S, Liu H, Mahaffy JM, Mueller JE, Nulton J, Olson R, Parsons R, Ray-hawk S, Suttle CA, Rohwer F. 2006.The marine viromes of four oceanic regions.
PLoS Biology4:e368 DOI 10.1371/journal.pbio.0040368.
Angly FE, Willner D, Prieto-Davó A, Edwards RA, Schmieder R, Vega-Thurber R, Antonopoulos DA, Barott K, Cottrell MT, Desnues C, Dinsdale EA, Furlan M, Haynes M, Henn MR, Hu Y, Kirchman DL, McDole T, McPherson JD, Meyer F, Miller RM, Mundt E, Naviaux RK, Rodriguez-Mueller B, Stevens R, Wegley L, Zhang L, Zhu B, Rohwer F. 2009.The GAAS metagenomic tool and its estimations of viral and microbial average genome size in four major biomes.PLoS Computa-tional Biology 5:e1000593DOI 10.1371/journal.pcbi.1000593.
Bankevich A, Nurk S, Antipov D, Gurevich AA, Dvorkin M, Kulikov AS, Lesin VM, Nikolenko SI, Pham S, Prjibelski AD, Pyshkin AV, Sirotkin AV, Vyahhi N, Tesler G, Alekseyev MA, Pevzner PA. 2012.SPAdes: a new genome assembly algorithm and its applications to single-cell sequencing.Journal of Computational Biology: a Journal of Computational Molecular Cell Biology19:455–477 DOI 10.1089/cmb.2012.0021.
Bolger AM, Lohse M, Usadel B. 2014.Trimmomatic: a flexible trimmer for Illumina sequence data.Bioinformatics30:2114–2120DOI 10.1093/bioinformatics/btu170.
Brown CT, Hug LA, Thomas BC, Sharon I, Castelle CJ, Singh A, Wilkins MJ, Wrighton KC, Williams KH, Banfield JF. 2015.Unusual biology across a group comprising more than 15% of domain Bacteria.Nature523:208–211DOI 10.1038/nature14486.
Brum JR, Sullivan MB. 2015.Rising to the challenge: accelerated pace of discov-ery transforms marine virology.Nature Reviews Microbiology 13:147–159
DOI 10.1038/nrmicro3404.
Castelle CJ, Hug LA, Wrighton KC, Thomas BC, Williams KH, Wu D, Tringe SG, Singer SW, Eisen JA, Banfield JF. 2013.Extraordinary phylogenetic diversity and metabolic versatility in aquifer sediment.Nature Communications4:Article 2120
DOI 10.1038/ncomms3120.
Cunningham BR, Brum JR, Schwenck SM, Sullivan MB, John SG. 2015.An inexpensive, accurate, and precise wet-mount method for enumerating aquatic viruses.Applied and Environmental Microbiology 81:2995–3000DOI 10.1128/AEM.03642-14.
2016.Diverse circular replication-associated protein encoding viruses circulating in invertebrates within a lake ecosystem.Infection, Genetics and Evolution: Journal of Molecular Epidemiology and Evolutionary Genetics in Infectious Diseases39:304–316
DOI 10.1016/j.meegid.2016.02.011.
Delcher AL, Salzberg SL, Phillippy AM. 2003.Using MUMmer to identify similar regions in large sequence sets.Current Protocols in Bioinformatics00: 10.3:10.3.1– 10.3.18DOI 10.1002/0471250953.bi1003s00.
Diemer GS, Stedman KM. 2012.A novel virus genome discovered in an extreme environment suggests recombination between unrelated groups of RNA and DNA viruses.Biology Direct 7:Article 13DOI 10.1186/1745-6150-7-13.
Duhaime MB, Deng L, Poulos BT, Sullivan MB. 2012.Towards quantitative metage-nomics of wild viruses and other ultra-low concentration DNA samples: a rigorous assessment and optimization of the linker amplification method.Environmental Microbiology14:2526–2537DOI 10.1111/j.1462-2920.2012.02791.x.
Duhaime MB, Wichels A, Waldmann J, Teeling H, Glöckner FO. 2011.Ecogenomics
and genome landscapes of marinePseudoalteromonasphage H105/1.The ISME Journal 5:107–121DOI 10.1038/ismej.2010.94.
Eaglesham J, Hewson I. 2013.Widespread detection of circular replication initiator protein (rep)-encoding ssDNA viral genomes in estuarine, coastal and open ocean net plankton.Marine Ecology Progress Series494:65–72DOI 10.3354/meps10575.
Edwards RA, Rohwer F. 2005.Viral metagenomics.Nature Reviews Microbiology 3:504–510DOI 10.1038/nrmicro1163.
Falkowski PG, Fenchel T, Delong EF. 2008.The microbial engines that drive earth’s biogeochemical cycles.Science320:1034–1039DOI 10.1126/science.1153213.
Fancello L, Raoult D, Desnues C. 2012.Computational tools for viral metage-nomics and their application in clinical research.Virology434:162–174
DOI 10.1016/j.virol.2012.09.025.
Fuhrman JA. 1999.Marine viruses and their biogeochemical and ecological effects.
Nature399:541–548DOI 10.1038/21119.
Ge X, Li J, Peng C, Wu L, Yang X, Wu Y, Zhang Y, Shi Z. 2011.Genetic diversity of novel circular ssDNA viruses in bats in China.The Journal of General Virology 92:2646–2653DOI 10.1099/vir.0.034108-0.
Goldsmith D, Brum J, Hopkins M, Carlson C, Breitbart M. 2015.Water column stratification structures viral community composition in the Sargasso Sea.Aquatic Microbial Ecology76:85–94DOI 10.3354/ame01768.
Holmfeldt K, Odić D, Sullivan MB, Middelboe M, Riemann L. 2012.Cultivated single-stranded DNA phages that infect marine Bacteroidetes prove difficult to detect with DNA-binding stains.Applied and Environmental Microbiology 78:892–894
DOI 10.1128/AEM.06580-11.
Hug LA, Baker BJ, Anantharaman K, Brown CT, Probst AJ, Castelle CJ, Butterfield CN, Hernsdorf AW, Amano Y, Ise K, Suzuki Y, Dudek N, Relman DA, Finstad KM, Amundson R, Thomas BC, Banfield JF. 2016.A new view of the tree of life.Nature Microbiology1:Article 16048DOI 10.1038/nmicrobiol.2016.48.
John SG, Mendez CB, Deng L, Poulos B, Kauffman AKM, Kern S, Brum J, Polz MF, Boyle EA, Sullivan MB. 2011.A simple and efficient method for concentration of ocean viruses by chemical flocculation.Environmental Microbiology Reports 3:195–202DOI 10.1111/j.1758-2229.2010.00208.x.
Kim K-H, Bae J-W. 2011.Amplification methods bias metagenomic libraries of uncul-tured single-stranded and double-stranded DNA viruses.Applied and Environmental Microbiology77:7663–7668DOI 10.1128/AEM.00289-11.
Kim K-H, Chang W, Nam Y-D, Roh SW, Kim M-S, Sung Y, Jeon CO, Oh H-M, Bae J-W. 2008.Amplification of uncultured single-stranded DNA viruses from rice paddy soil.Applied and Environmental Microbiology74:5975–5985
DOI 10.1128/AEM.01275-08.
Kim M-S, Park E-J, Roh SW, Bae J-W. 2011.Diversity and abundance of single-stranded DNA viruses in human feces.Applied and Environmental Microbiology 77:8062–8070
DOI 10.1128/AEM.06331-11.
Kimura K, Tomaru Y. 2015.Discovery of two novel viruses expands the diversity of single-stranded DNA and single-stranded RNA viruses infecting a cosmopoli-tan marine diatom.Applied and Environmental Microbiology 81:1120–1131
DOI 10.1128/AEM.02380-14.
Krupovic M, Ravantti JJ, Bamford DH. 2009.Geminiviruses: a tale of a plasmid becoming a virus.BMC Evolutionary Biology9:112 DOI 10.1186/1471-2148-9-112.
Kurihara L, Banks L, Chupreta S, Couture C, Laliberte J, Sandhu S, Schumacher C, Spurbeck R, Makarov V. 2014.A new method for low-input, PCR-free NGS libraries.Available athttp:// www.genetargetsolutions.com.au/ wp-content/ uploads/ 2015/ 05/ A-new-method-for-low-input-PCR-free-NGS-libraries-with-exceptional-evenness-of-coverage.pdf (accessed on 21 September 2016).
Labonté JM, Suttle CA. 2013a.Metagenomic and whole-genome analysis reveals new lineages of gokushoviruses and biogeographic separation in the sea.Frontiers in Microbiology4:Article 404DOI 10.3389/fmicb.2013.00404.
Labonté JM, Suttle CA. 2013b.Previously unknown and highly divergent ssDNA viruses populate the oceans.The ISME Journal7:2169–2177DOI 10.1038/ismej.2013.110.
Langmead B, Salzberg SL. 2012.Fast gapped-read alignment with Bowtie 2.Nature Methods9:357–359DOI 10.1038/nmeth.1923.
López-Bueno A, Tamames J, Velázquez D, Moya A, Quesada A, Alcamí A. 2009.High diversity of the viral community from an Antarctic Lake.Science326:858–861
DOI 10.1126/science.1179287.
Journal of Molecular Epidemiology and Evolutionary Genetics in Infectious Diseases 39:279–292DOI 10.1016/j.meegid.2016.02.009.
Marine R, McCarren C, Vorrasane V, Nasko D, Crowgey E, Polson SW, Wommack KE. 2014.Caught in the middle with multiple displacement amplification: the myth of pooling for avoiding multiple displacement amplification bias in a metagenome.
Microbiome2:Article 3 DOI 10.1186/2049-2618-2-3.
Mochizuki T, Krupovic M, Pehau-Arnaudet G, Sako Y, Forterre P, Prangishvili D. 2012.Archaeal virus with exceptional virion architecture and the largest single-stranded DNA genome.Proceedings of the National Academy of Sciences of the United States of America109:1–6DOI 10.1073/pnas.1203668109.
Mokili JL, Rohwer F, Dutilh BE. 2012.Metagenomics and future perspectives in virus discovery.Current Opinion in Virology2:63–77DOI 10.1016/j.coviro.2011.12.004.
Ng TFF, Manire C, Borrowman K, Langer T, Ehrhart L, Breitbart M. 2009.Discovery of a novel single-stranded DNA virus from a sea turtle fibropapilloma by using viral metagenomics.Journal of Virology83:2500–2509DOI 10.1128/JVI.01946-08.
Noble RT. 2001.Enumeration of viruses.Methods in Microbiology30:43–51
DOI 10.1016/S0580-9517(01)30038-7.
O’Malley MA. 2016.The ecological virus.Studies in Gistory and Philosophy of Biological and Biomedical Sciences59:71–79DOI 10.1016/j.shpsc.2016.02.012.
Pace NR. 1997.A molecular view of microbial diversity and the biosphere.Science 276:734–740DOI 10.1126/science.276.5313.734.
Pesant S, Not F, Picheral M, Kandels-Lewis S, Le Bescot N, Gorsky G, Iudicone D, Karsenti E, Speich S, Troublé R, Dimier C, Searson S, Acinas SG, Bork P, Boss E, Bowler C, De Vargas C, Follows M, Grimsley N, Hingamp P, Jaillon O, Karp-Boss L, Krzic U, Ogata H, Raes J, Reynaud EG, Sardet C, Sieracki M, Stemmann L, Sullivan MB, Sunagawa S, Velayoudon D, Weissenbach J, Wincker P. 2015.Open science resources for the discovery and analysis of Tara Oceans data.Scientific Data 2:Article 150023DOI 10.1038/sdata.2015.23.
Quaiser A, Dufresne A, Ballaud F, Roux S, Zivanovic Y, Colombet J, Sime-Ngando T, Francez A-J. 2015.Diversity and comparative genomics of Microviridae in Sphagnum—dominated peatlands.Frontiers in Microbiology6:Article 375
DOI 10.3389/fmicb.2015.00375.
R Core Team. 2016.R: a language and environment for statistical computing. Vienna: R Foundation for Statistical Computing.
Rinke C, Schwientek P, Sczyrba A, Ivanova NN, Anderson IJ, Cheng J-F, Darling A, Malfatti S, Swan BK. 2013.Insights into the phylogeny and coding potential of microbial dark matter.Nature499:431–437DOI 10.1038/nature12352.
Rohwer F, Thurber RV. 2009.Viruses manipulate the marine environment.Nature 459:207–212DOI 10.1038/nature08060.
Rokyta DR, Burch CL, Caudle SB, Wichman HA. 2006.Horizontal gene transfer and the evolution of microvirid coliphage genomes.Journal of Bacteriology188:1134–1142
Rosario K, Dayaram A, Marinov M, Ware J, Kraberger S, Stainton D, Breitbart M, Varsani A. 2012.Diverse circular ssDNA viruses discovered in dragon-flies (Odonata: Epiprocta).The Journal of General Virology93:2668–2681
DOI 10.1099/vir.0.045948-0.
Rosario K, Duffy S, Breitbart M. 2009.Diverse circovirus-like genome architectures revealed by environmental metagenomics.Journal of General Virology90:2418–2424
DOI 10.1099/vir.0.012955-0.
Rosario K, Duffy S, Breitbart M. 2012.A field guide to eukaryotic circular single-stranded DNA viruses: insights gained from metagenomics.Archives of Virology 157:1851–1871DOI 10.1007/s00705-012-1391-y.
Rosario K, Nilsson C, Lim YW, Ruan Y, Breitbart M. 2009.Metagenomic analy-sis of viruses in reclaimed water.Environmental Microbiology11:2806–2820
DOI 10.1111/j.1462-2920.2009.01964.x.
Roux S, Enault F, Hurwitz BL, Sullivan MB. 2015.VirSorter: mining viral signal from microbial genomic data.PeerJ3:e985 DOI 10.7717/peerj.985.
Roux S, Enault F, Robin A, Ravet V, Personnic S, Theil S, Colombet J, Sime-Ngando T, Debroas D. 2012a.Assessing the diversity and specificity of two freshwater viral communities through metagenomics.PLoS ONE7:e33641
DOI 10.1371/journal.pone.0033641.
Roux S, Krupovic M, Poulet A, Debroas D, Enault F. 2012b.Evolution and diversity of the Microviridae viral family through a collection of 81 new complete genomes as-sembled from virome reads.PLoS ONE7:e40418DOI 10.1371/journal.pone.0040418.
Sommer F, Bäckhed F. 2013.The gut microbiota–masters of host development and physiology.Nature Reviews. Microbiology11:227–238DOI 10.1038/nrmicro2974.
Steel O, Kraberger S, Sikorski A, Young LM, Catchpole RJ, Stevens AJ, Ladley JJ, Coray DS, Stainton D, Dayaram A, Julian L, Van Bysterveldt K, Varsani A. 2016.Circular replication-associated protein encoding DNA viruses identified in the faecal matter of various animals in New Zealand.Infection, Genetics and Evolution43:151–164
DOI 10.1016/j.meegid.2016.05.008.
Suttle CA. 2007.Marine viruses–major players in the global ecosystem.Nature Reviews Microbiology5:801–812DOI 10.1038/nrmicro1750.
Tomaru Y, Toyoda K, Kimura K, Hata N, Yoshida M, Nagasaki K. 2012.First evidence for the existence of pennate diatom viruses.The ISME Journal6:1445–1448
DOI 10.1038/ismej.2011.207.
Wegley L, Edwards R, Rodriguez-Brito B, Liu H, Rohwer F. 2007.Metagenomic analysis of the microbial community associated with the coral Porites astreoides.
Environmental Microbiology9:2707–2719DOI 10.1111/j.1462-2920.2007.01383.x.
Wickham H. 2016.ggplot2: elegant graphics for data analysis. Dordrecht: Springer International Publishing.
Willner D, Furlan M, Haynes M, Schmieder R, Angly FE, Silva J, Tammadoni S, Nosrat B, Conrad D, Rohwer F. 2009.Metagenomic analysis of respiratory tract DNA viral communities in cystic fibrosis and non-cystic fibrosis individuals.PLoS ONE 4:e7370DOI 10.1371/journal.pone.0007370.
Wrighton K, Thomas B, Sharon I, Miller CS, Castelle CJ, Verberkmoes NC, Wilkins MJ, Hettich RL, Lipton MS, Williams KH, Long PE, Banfield JF. 2012. Fermen-tation, hydrogen, and sulfur metabolism in multiple uncultivated bacterial phyla.
Science337:1661–1666DOI 10.1126/science.1224041.
Yilmaz S, Allgaier M, Hugenholtz P. 2010.Multiple displacement amplification compromises quantitative analysis of metagenomes.Nature Methods7:943–944
DOI 10.1038/nmeth1210-943.