J. Serb. Chem. Soc. 77 (10) 1409–1422 (2012) UDC 547.831+544.022+577.213.3+
JSCS–4362 547.213.3+547.963.32+541.183
Original scientific paper
An electrochemical study of the adsorptive behaviour of
varenicline and its interaction with DNA
VALENTINA RADULOVIĆ1, MARA M. ALEKSIĆ2*# and VERA KAPETANOVIĆ1
1University of Belgrade, Faculty of Pharmacy, Department of Analytical Chemistry, Vojvode
Stepe 450, 11000 Belgrade, Serbia and 2University of Belgrade, Faculty of Pharmacy,
Department of Physical Chemistry and Instrumental Methods, Vojvode Stepe 450, 11000 Belgrade, Serbia
(Received 20 April, revised 10 July 2012)
Abstract: Theelectrochemical behaviour of a novel nicotinic α4β2 subtype re-ceptor partial agonist varenicline (VAR), which is used for smoking cessation, was investigated in Britton–Robinson buffers (pH 2.0–12.0) by cyclic, diffe-rential pulse and square wave voltammetry at a hanging mercury drop electrode (HMDE). The influence of pH, scan rate, concentration, accumulation potential and time on the peak current and potential suggested that the redox process was adsorption controlled in alkaline media. In addition, the experimental value of the surface coverage, Γ= 1.03×10⁻¹⁰ mol cm-2, was used to determine the
con-ditions when VAR was fully adsorbed at the electrode surface. Bearing in mind the potential high toxicity of VAR due to the presence of a quinoxaline struc-ture, its interaction with double stranded-DNA (ds-DNA) was postulated and studied when both compounds were in the adsorbed state at a modified HMDE. Using the adsorptive transfer technique, changes in potential and decreases in the normalized peak currents were observed. The estimated value of the ratio of surface-binding constants indicated that the reduced form of VAR interacted with ds-DNA more strongly than the oxidized form. Subtle DNA damage under conditions of direct DNA–VAR interaction at room temperature was observed. The proposed type of interaction was intercalation. This study employed a simple electroanalytical methodology and showed the potential of a DNA/ /HMDE biosensor for investigation of genotoxic effects.
Keywords:adsorption; DNA; interaction; varenicline; electrochemistry. INTRODUCTION
Varenicline (VAR, 7,8,9,10-tetrahydro-6,10-methano-6H-pyrazino(2,3-h)(3) benzazepine), (Scheme 1) is a novel nicotinic α4β2 subtype receptor partial
* Corresponding author. E-mail: [email protected]
# Serbian Chemical Society member.
nist approved by the Food and Drug Administration (FDA) for smoking cessa-tion.1 VAR is similar in structure to nicotine but, as a partial agonist, it does not produce the full effect of nicotine. VAR competitively blocks the ability of nico-tine to bind and stimulate the dopamine system. Only a small portion of VAR is metabolized, so most of the active compound is excreted renally.
Scheme 1. Chemical structure of varenicline.
Since VAR posses a quinoxaline core, which is known as a cytotoxic struc-ture,2 it can be supposed that varenicline also shows some cytotoxic effects.
There are only few reports on determination of VAR or its degradation pro-ducts and impurities by different chromatographic methods in tablets3–7 and plasma
samples.8 Recently, the electrochemical behaviour of VAR at several electrodes was reported.9 VAR undergoes reduction of the two C=N bonds of the
substi-tuted quinoxaline ring. In two consecutive, one electron steps the C=N bonds in VAR are reduced to give dihydrovarenicline, which undergoes further hydrogen ion-catalyzed chemical transformation and after the addition of two protons and two electrons, it is reduced to the final product, tetrahydrovarenicline. The criti-cal factor governing the reduction processes of VAR is the pH of the solution. The overall process was possible only in acid solution and is represented by two reduction peaks, separated by more than 0.5 V. In alkaline medium, dihydrovare-nicline is formed as the final product, which can be reversibly oxidized back to VAR.
Since the VAR molecule has a planar structure, it can be assumed that it will show considerable adsorption at an electrode surface. Bearing in mind its high toxicity, interactions with DNA molecule may be postulated.
The best way to study these interactions is to measure the electrode signal when both compounds are in the adsorbed state at the electrode surface.
Electrochemical DNA-based biosensors10–12 are often used for the
determi-nation of low-molecular weight compounds with affinity for nucleic acids and for the detection of the hybridisation reaction.13 There are many interesting
applica-tions of DNA biosensors for detection of different analytes in water, soil, plant, food samples and pharmaceuticals.14 It is well known that drugs bind to DNA
Since the structure of varenicline contains three planar heterocyclic rings, its po-tent interaction with DNA could be assumed.
Electrochemical analysis of DNA is based on the fact that the adenine and cytosine residues produce reducible signals, while guanine residues yield an ano-dic signal due to the oxidation of the guanine reduction product. For the detection of such signals, voltammetric techniques at a hanging mercury drop electrode (HMDE) are used most frequently.16 The interaction between drugs and DNA
that cause DNA damage can be monitored by following the changes in the cur-rent intensity and the shift in the potential of the voltammetric peaks of DNA and investigated drug.
In this work, the preliminary results on the interaction of the nicotinic recep-tor agonist varenicline with calf thymus double-stranded DNA (ds-DNA) immo-bilized at a HMDE using adsorptive transfer stripping square wave voltammetry (AdTSSWV) are presented.
EXPERIMENTAL Reagents and solutions
VAR was kindly donated by the Agency of Drugs and Medical Devices, Belgrade, Ser-bia. A stock solution (S0) 1×10⁻³ mol dm-3 of VAR was prepared in redistilled water and
stored in a freezer. More dilute solutions were prepared daily from the stock solution (S0). Double-stranded calf thymus DNA (MW = 10×106–15×106 g mol-1) was purchased from
Sigma-Aldrich (Deisenhofen, Germany). The stock solution of DNA was 1.3×10⁻⁴ mol dm-3
in 2×10⁻³ mol dm-3 phosphate buffer, pH 7.0, and its exact concentration was determined
spectrophotometrically and related to the nucleotide content.
Britton–Robinson buffer solutions, used as the supporting electrolytes for VAR inves-tigation, were prepared in the usual way.17 For the DNA studies, the adsorption was
per-formed in phosphate buffer, and voltammetric measurements were realised in ammonium formate/sodium phosphate buffer. All the chemicals used for buffer preparation were of anal-ytical grade.
Double distilled water was used throughout. All experiments were performed at room temperature.
Instrumentation
The measurements were performed with an µAUTOLAB analyzer (EcoChemie, Utrecht, The Netherlands) connected to VA-Stand 663 (Metrohm, Herisau, Switzerland), and con-trolled by GPES 4.9 software. A standard three-electrode electrochemical cell was used. The working electrode was a hanging mercury drop electrode (HMDE) with drop area of 0.4 mm2,
the reference electrode was Ag/AgCl/3 mol dm-3 KCl, and a platinum wire was used as the
auxiliary electrode.
Alternatively, in some voltammetric measurements, an Amel 433-A computerized pola-rographic analyzer was used, with a similar three-electrode system (working HMDE with a drop area of 1.9 mm2, Ag/AgCl reference and Pt-auxiliary electrode).
A Radiometer PHM 220 pH meter with a Radiometer GK2401B combined pH electrode was used.
DPV was performed with pulse amplitude of 50 mV, pulse width 50 ms and scan rates of 20, 50 and 100 mV s-1, while the parameters for the SWV mode were: amplitude 50 mV, scan
increment 1–5 mV, frequency 125 Hz and sampling time 1 ms, and when required, the stirring speed of 300 rpm was applied. In the adsorptive stripping experiments, the adsorption accu-mulation potential and time were selected.
Procedure for the pH investigation
An appropriate volume of the supporting electrolyte of different pH values were placed in the electrochemical cell, de-aerated for 10 minutes with high purity nitrogen and then 0.15 ml of the VAR stock solution (S0) was added to give a final VAR concentration of 1×10⁻⁵ mol
dm-3 for cyclic voltammetry (CV) and differential pulse voltammetry (DPV). The solution
was purged for a further 3 min and the current–voltage curves were recorded. Procedure for adsorptive stripping voltammetric investigation
An aliquot of 15.00 ml of supporting electrolyte (BR buffer) solution was introduced into the electrochemical cell and de-aerated with pure nitrogen for 10 min. A selected accumu-lation potential was applied to the mercury drop for a selected accumuaccumu-lation period, while the solution was stirred at 300 rpm. The stirring was then stopped and after the rest period, adsorptive stripping square wave voltammetry was applied for reduction process over the range –0.2 to –1.2 V vs. Ag/AgCl. After the background voltammogram had been recorded, an adequate aliquot of the stock VAR solution was added to the cell and under the same con-ditions, the AdSSW voltammogram was recorded at a new drop.
Procedure for adsorptive transfer stripping technique (AdTS, ex situ)
DNA was adsorbed from a 5 µl sample drop onto the HMDE surface for 120 s. Then the electrode with an adsorbed DNA layer was washed with water and transferred into the background electrolyte, where the voltammetry was performed. The same procedure was em-ployed with VAR under the same experimental conditions. The measurements were per-formed in the absence of oxygen, by passing nitrogen through the solution for 5 minutes before starting the measurements.
Alternatively, VAR and DNA were mixed, and after the selected incubation period (2–30 min) this mixture was adsorbed from a 5 µl drop onto the HMDE. The electrode modified with a VAR–DNA layer was washed and transferred into the background electrolyte and the SW voltammogram was recorded.
RESULTS AND DISCUSSION
Effect of pH
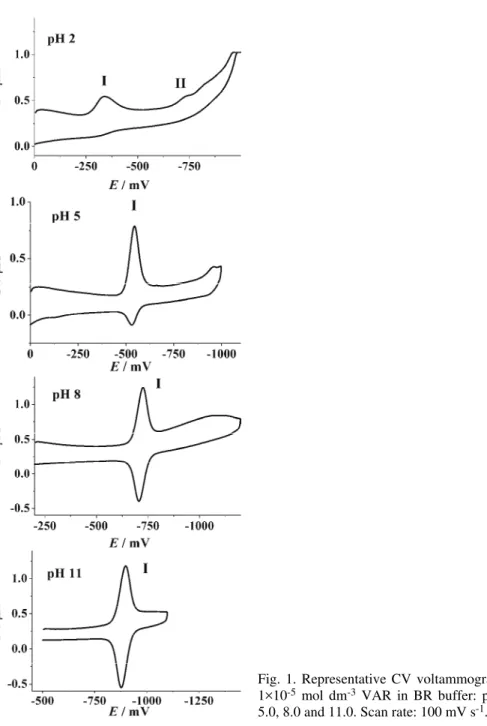
The study of the redox processes of VAR was performed in the pH range 2.0 to 12.0 in BR buffers. VAR exhibited electrochemical activity at all the investi-gated pH values. The voltammetric behaviour of VAR was examined using CV and DPV. Some representative voltammograms are presented in Fig. 1. Two re-duction peaks (I and II) were present. Peak I was present over the whole pH range, and its reversibility increased with increasing pH. On the other hand, peak II was irreversible and not well developed. This peak appeared at negative potentials (–0.7 V <Ep< –1.0 V) and disappeared in neutral and alkaline media
Fig. 1. Representative CV voltammograms of 1×10⁻⁵ mol dm-3 VAR in BR buffer: pH 2.0,
5.0, 8.0 and 11.0. Scan rate: 100 mV s-1.
Attention was focussed on peak I, which is the consequence of the two-elec-tron reduction of the C=N bond in VAR to give dihydrovarenicline.9 The peak
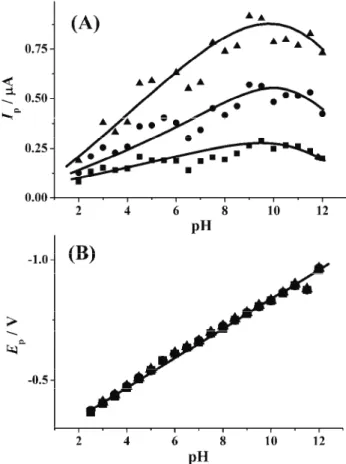
same time, the peak potential was shifted towards more negative potentials, and linearly varied from –0.3 V at pH 2.0 up to –0.96 V at pH 12.0 (Fig. 2B), proving that protons participate directly in the reduction process.
Fig. 2. The influence of pH on CV peak current (A) and peak potential (B) of 1×10⁻⁵ mol dm-3
VAR in BR buffer at different scan rates: 20 (■), 50 (●) and 100 mV s-1 (▲).
Using a VAR concentration of 1×10⁻⁵ mol dm–3 at different pH values and varying the scan rate over the range 5–100 mV s–1, the voltammetric peak
cur-rent was measured. At pH < 4.0, the Ipvs. ν dependence is nonlinear, but at pH >
> 4.0, a linear dependence was obtained, suggesting that the reduction process is controlled by adsorption. According to the values of the obtained slopes (Table I), it seems that the most pronounced adsorption of VAR at the mercury surface was observed at pH around 8. This means that the adsorbed form of VAR under-goes an electrode reduction process under these conditions.
The slope of the linear dependences of log Ipvs. log ν at pH > 4.0 increases
de-crease of the slopes in the linear dependences log Ip vs. log ν at pH > 8.0
ex-presses a weakened adsorption in highly alkaline solutions.
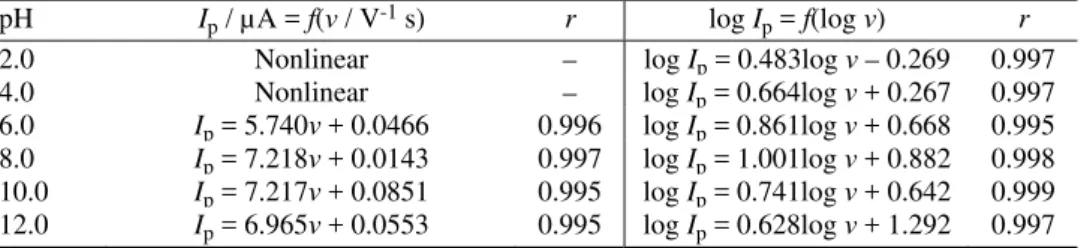
TABLE I. Regression equations of the Ip = f(ν) and log Ip = f(log ν) linear dependences, in acid and alkaline medium
pH Ip / µA = f(ν / V-1 s) r log I
p = f(log ν) r
2.0 Nonlinear – log Ip = 0.483log ν – 0.269 0.997 4.0 Nonlinear – log Ip = 0.664log ν + 0.267 0.997
6.0 Ip= 5.740v + 0.0466 0.996 log Ip = 0.861log ν + 0.668 0.995 8.0 Ip = 7.218ν + 0.0143 0.997 log Ip = 1.001log ν + 0.882 0.998 10.0 Ip = 7.217ν + 0.0851 0.995 log Ip = 0.741log ν + 0.642 0.999 12.0 Ip = 6.965ν + 0.0553 0.995 log Ip = 0.628log ν + 1.292 0.997
Adsorptive character of the drug
To improve the sensitivity for monitoring the accumulated drug, adsorptive stripping square-wave voltammetry was applied. The signal intensity of the AdSSW voltammetry was found to be 30 and 600 times higher than those of differential pulse (DP) and linear sweep (LS) adsorptive technique, respectively. The advan-tage of the application of an SW waveform was documented by trace analysis of several drugs that exhibited adsorption at the electrode surface.18–21 The SW
res-ponse markedly depended on the parameters of the excitement signal. In order to obtain the maximum peak current, the optimum instrumental conditions (fre-quency of 125 Hz, scan increment of5mV and pulse amplitude of 50 mV) were applied in the further work.
Effect of accumulation time (tacc) and potential (Eacc)
The effect of accumulation time on the peak current for 1×10⁻⁷ mol dm–3
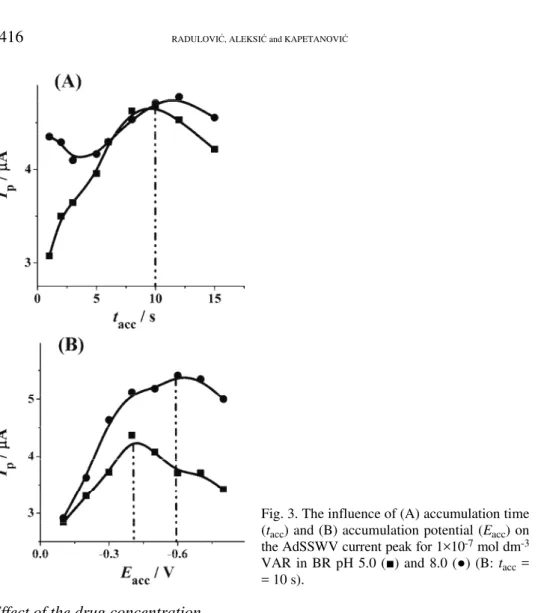
VAR was studied in the range from 1 to 30 s. The peak current increased with increasing accumulation time up to 10 s when adsorptive saturation on the mer-cury electrode surface was finally achieved. Under such conditions, interactions among the drug molecules in the adsorbed state became noticeable and the peak current commenced to decrease slightly. Hence, accumulation times longer than 10 s are required for work with an electrode surface covered with a VAR layer (Fig. 3A).
The potential range of –0.1 to –0.8 V was examined for 1×10⁻⁷ mol dm–3
Fig. 3. The influence of (A) accumulation time (tacc) and (B) accumulation potential (Eacc) on
the AdSSWV current peak for 1×10⁻⁷ mol dm-3
VAR in BR pH 5.0 (■) and 8.0 (●) (B: tacc = = 10 s).
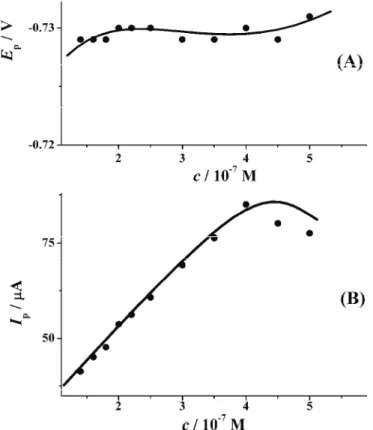
Effect of the drug concentration
Applying AdSSW voltammetry under the chosen optimal conditions for VAR concentrations above 10–7 mol dm–3, the peak height increased linearly up to 4×10⁻⁷ mol dm–3, and then slightly decreased. Simultaneously, the peak potential
was almost constant (Fig. 4).
This behaviour suggests that with increasing concentration, the electrode surface reaches its full coverage, and it can be assumed that at a VAR bulk con-centration above 5×10⁻⁷ mol dm–3, a monolayer is completely formed and only
2 2 p
4
n F
I A
RT ν Γ
= (1)
where n represents the number of electrons transferred in a reversible electrode reaction, A is the electrode surface area and Γis the surface coverage in moles of adsorbed molecules per surface area. Applying this equation to the results ob-tained for the CV curves of 1×10⁻⁵ mol dm–3 VAR two electron reduction at pH
8.0, the amount of electroactive specie on the surface was evaluated, and the experimental surface coverage was found to be Γ= 1.03×10⁻¹⁰ mol cm–2. To check
whether this corresponds to a monolayer, the theoretical surface coverage was es-timated by considering the varenicline molecule as a rectangle with an area of 1.5 nm2 (0.75 nm×2 nm corresponding to the bond lengths22). A dense arrangement of these molecules should lead to a coverage of Γ= 1.107×10⁻¹⁰ mol cm–2. This
confirms that in the limit of the approximations made, the electrode was covered with a monolayer of varenicline.
VAR–DNA Interaction
For the study of VAR–DNA interaction, DNA was pre-incubated with VAR in equal concentrations for different incubation periods. After this incubation pe-riod, the HMDE was modified with this mixture and the interaction was studied by comparing the obtained voltammogram with the signals obtained for HMDE/ /VAR and HMDE/DNA modified electrodes under the same conditions. The con-ditions pH (pH 7.0), ionic strength (5×10⁻² mol dm–3 NaCl), concentrations (20–
–100×10–6 mol dm–3), and incubation time (2–30 min) were selected in order to
ensure that both components are fully adsorbed at the electrode surface. After the incubation period, SWV measurements were performed using the adsorptive transfer stripping technique (AdTS).
The usual reduction and subsequent oxidation and electron transfer reactions characteristic for both components are shown in Fig. 5. The reversible reduction peak at –0.654 V corresponds to the two-electron reduction of VAR (curve 1, peak V), while DNA produces a cathodic peak at –1.426 V due to the reduction of adenine and cytosine (curve 2a, peak A/C) and an anodic peak of re-oxidized guanine at –0.253 V (curve 2b, peak G) after its reduction at extremely negative potentials.
After the incubation of VAR and DNA, the obtained voltammogram showed changes in the peak heights and potentials (curves 3a and 3b). All peak currents decreased, and the VAR peak potential was shifted to a more positive potential. This indicates that VAR and DNA interact and that the ds-DNA structure can be distorted as a result of subtle damage by this drug.
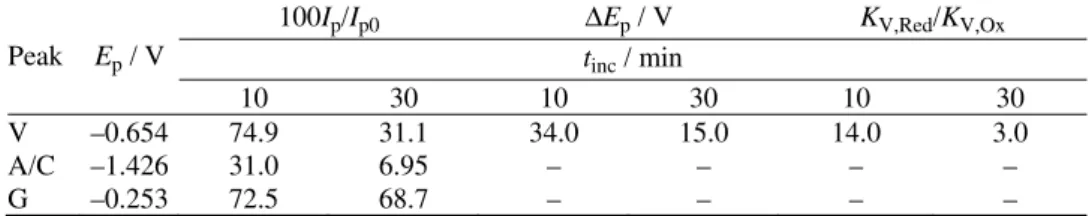
The changes in the current responses caused by VAR–DNA interaction were expressed as normalized peak currents: V (%), A/C (%), and G (%) using Eqs. (2)–(4):
V (%) = 100Ip,V/Ip0,V (2)
A/C (%) = 100Ip,A/C/Ip0,A/C (3)
G (%) = 100Ip,G/Ip0,G (4)
where Ip,V, Ip,A/C and Ip,G and Ip0,V, Ip0,A/C and Ip0,G are the peak currents of
varenicline, adenine/cytosine and guanine after and before interaction, respecti-vely. The obtained results are summarized in Table II. The normalized peak cur-rent of both compounds decreased after incubation.
Fig. 5. AdTSSW voltammograms of: 1×10⁻⁵ mol dm-3 VAR (1 - - -), ds-DNA (2a, 2b ···) and
VAR–DNA mixture (3a, 3b ─). The compounds were adsorbed from 0.05 mol dm-3 NaCl
with 0.002 mol dm-3 phosphate buffer, pH 7.0, for t
acc = 120 s, Eacc = OCP. The HMDE with
adsorbed layers of (1), (2) or (3) were transferred to the blank background electrolyte 0.3 mol dm-3 ammonium formate/sodium phosphate buffer, pH 6.86 and the SW
voltammograms were recorded (frequency 25 Hz, amplitude 200 mV, potential range from 0 to –1.85 V). A) cathodic; B) anodic peaks.
The formal potential shift can be expressed as:
Red
0' 0'
0'
surf sol
Ox
ΔE E E RTlnK
nF K
= − = (5)
where Esurf0' and Esol0' represent the formal potentials of the redox species immo-bilized on the electrode surface and in the solution, and KRed and KOx are the surface-binding constants for the reduced and oxidized forms of the redox spe-cies, respectively. In the case of VAR, which undergoes a reversible, two-elec-tron transfer at relatively high ionic strength (0.05 mol dm–3), the ratio of K
/KV,Oxwas estimated and is presented in Table II. These results indicate that the
reduced form of VAR interacts with the ds-DNA on the modified electrode surface more strongly (3–14 times, depending on the incubation period) than the oxidized form. This behaviour is characteristic of intercalative interactions.23 The
shift in VAR peak potential, Ep, towards more positive potentials after VAR–
DNA incubation supports this hypothesis.
TABLE II. The VAR–DNA interaction expressed by normalized values of the SW voltam-metric responses, change in the peak potential, and surface binding constants ratio
Peak Ep/ V
100Ip/Ip0 ΔEp / V KV,Red/KV,Ox tinc / min
10 30 10 30 10 30 V A/C G –0.654 –1.426 –0.253 74.9 31.0 72.5 31.1 6.95 68.7 34.0 – – 15.0 – – 14.0 – – 3.0 – – CONCLUSIONS
The novelty of these investigations is based on the adsorption effects of VAR at a mercury surface, which enables the application of AdSSW voltammetry for studying the redox processes of VAR in the adsorbed state. The obtained values of surface coverage and accumulation potential and time were used to determine the conditions under which VAR is fully adsorbed at the electrode surface.
Association interaction of calf thymus ds-DNA with VAR at the modified HMDE was investigated. At room temperature and selected ionic strength, subtle DNA damage in the direct DNA–VAR interaction was observed, suggesting in-tercalation as the type of the interaction. The results lead to the conclusion that the toxicity of the investigated drug could be caused by this interaction. This study used simple electroanalytical methodology and showed the potential use of a DNA/HMDE biosensor for investigation of genotoxic effects.
Acknowledgement.This work was supported by the Ministry of Education, Science and Technological Development of the Republic of Serbia, Project No. 172033.
И З В О Д
ЕЛЕКТРОХЕМИЈСКОИСПИТИВАЊЕАДСОРПЦИЈЕИ ИНТЕРАКЦИЈЕВАРЕНИКЛИНАИДНК
ВАЛЕНТИНАРАДУЛОВИЋ1
, МАРАМ. АЛЕКСИЋ2
иВЕРАКАПЕТАНОВИЋ1 1
УниверзитетуБеограду, Фармацеутскифакултет, Катедразааналитичкухемију, ВојводеСтепе
450, 11000 Београди2
УнивезитетуБеограду, Фармацеутскифакултет, Катедраза физичкухемијуиинструменталнеметоде, ВојводеСтепе 450, 11000 Београд
Електрохемијско понашање варениклина, новог парцијалног агонисте α4β2нико
-тинскогрецептора, којисекористизаодвикавањеодпушења, испитаноје цикличном,
диференцијалнопулсном иволтаметријом правоугаонихталаса уБритон–Робинсоно
-трације, потенцијалаивременаакумулацијенависинуиположајпика, закљученоједа јепроцесредукцијеуалкалнојсрединиконтролисанадсорпцијомварениклина. Кориш
-ћењемексперименталнодобијеневредностиповршинскезапоседнутости, Γ= 1,03×10⁻¹⁰
mol cm-2, одређенису условипод којимајеварениклинпотпуно адсорбован наповр
-шиниелектроде. Имајућиувидумогућувисокутоксичностварениклина, собзиромна присуство хиноксалинског прстенауструктури, претпостављеноједа варениклинин
-терагујеса ДНК када су оба молекула адсорбована на модификованој живиној елек
-троди. Ова интеракција је испитана коришћењем „адсорптивне трансфер технике“ и
примећенесупроменепотенцијалаисмањењенормализованихструјаволтаметријских пикова. Наосновуизрачунатевредностиодносаконстантивезивањазакљученоједасе
редукованиобликварениклинајачевезујезаДНКодоксидованог. Претпостављеноједа директнаварениклин-ДНКинтеракцијанасобнојтемпературидоводидоизвесногоште
-ћењаДНКидајетипинтеракције – интеркалација. Оваједноставнаелектроаналитичка методологијамоглаби наћиприменуувидупотенцијалногбиосензора заиспитивање генотоксичнихефеката.
(Примљено 20. априла, ревидирано 10. јула 2012)
REFERENCES
1. J. W. Coe, P. R. Brooks, M. G. Vatelino, J. Med. Chem.48(2005) 3474
2. R. M. Rajurkar, V. A. Agrawal, S. S. Thonte, R. G. Ingate, Pharmacophore1 (2010) 65 3. B. Satheesh, S. Kumarpulluru, V. Raghavan, D. Saravanan, Acta Chromatogr.22 (2010)
207
4. A. A. Kadi, M. S. Mohamed, M. G. Kassen, I. A. Darwish, Chem. Cent. J. 5 (2011) 30 5. Methods of Reducing Degradant Formation in Pharmaceutical Compositions of
Vareni-cline, http://www.freepatentsonline.com/y2008/0026059.html (accessed January 2012) 6. Varenicline Standards and Impurity Controls, http://www.freepatentsonline.com/
/US2007/0224690.html (accessed September 2011)
7. F. R. Busch, P. E. Concannon, R. E. Handfield, J. D. McKinley, M. E. McMahon, R. A. Singer, T. J. Watson, Synth. Commun.38 (2008) 441
8. H. M. Faessel, B. J. Smith, M. A. Gibbs, J. S. Gobey, D. J. Clark, A. H. Burstein, J. Clin. Pharmacol. 46 (2006) 991
9. M. M. Aleksić, V. Radulović, N. Lijeskić, V. Kapetanović, Curr. Anal. Chem. 8 (2012)
133
10. J. Labuda, M. Fojta, F. Jelen, E. Paleček, in: Encyclopaedia of Sensors, Vol. 3, E.-F. C. A. Grimes, E. C. Dickey, M. V. Pishko, Eds., American Scientific Publishers, Valencia, USA, 2006, p. 201
11. J. Wang, in Electrochemistry of Nucleic Acids and Proteins. Towards Electrochemical Sensors for Genomics and Proteomic, E. Paleček, F. Sheeller, J. Wang, Eds., Elsevier, Amsterdam, The Netherlands, 2005, p. 175
12. M. Fojta, Electroanalysis14 (2002) 1449
13. F. Lucarrelli, G. Marrazza, A. P. F. Turner, M. Mascini, Biosens. Bioelectron. 19 (2004) 515 14. K. J. Odenthal, J. J. Gooding, Analyst132 (2007) 603
15. E. Palecek, M. Fojta, Anal. Chem.73 (2001) 74A 16. E. Palecek, Electroanalysis8/1 (1996) 7
18. M. M. Ghoneim, A. M. Beltagi, Talanta 60 (2003) 911
19. A. H. Al-Ghamdi, O. M. Al-Ghamdi, M. A. Al-Omar, Anal. Lett.41 (2008) 90 20. S. A.Ozkan, Curr. Pharm. Anal. 5 (2009) 127
21. M. Aleksić, V. Kapetanović, J. Electroanal. Chem. 593 (2006) 258
22. Handbook of Chemistry and Physics, 87th ed., D. R. Lide, Ed.,CRC Taylor and Francis
Group, Boca Raton, USA, 2006–2007, pp. 9–1