Margaret Neal, Colin Neal, Heather Wickham and Sarah Harman
294
Hydrol. Earth Syst. Sci., 11(1), 294300, 2007 www.hydrol-earth-syst-sci.net/11/294/2007 © Author(s) 2007. This work is licensed under a Creative Commons License.
Determination of bromide, chloride, fluoride, nitrate and sulphate
by ion chromatography: comparisons of methodologies for
rainfall, cloud water and river waters at the Plynlimon catchments
of mid-Wales
Margaret Neal, Colin Neal, Heather Wickham and Sarah Harman
Centre for Ecology and Hydrology, Maclean Building, Crowmarsh Gifford, Wallingford, OXON, OX10 8BB, UK
Email for corresponding author: [email protected]
Abstract
The results of determination of bromide, chloride, fluoride, nitrate and sulphate using ion chromatography (IC) are compared with those obtained by colorimetric and inductively coupled plasma optical emission spectroscopy (ICPOES) for rainfall, cloud water and stream waters in the Plynlimon experimental catchments of mid-Wales. For bromide, the concentrations determined by IC are lower than those for the colorimetric method used; the colorimetric method probably determined bromide plus organo-bromine compounds. It is suggested that the values determined by the colorimetric method be termed dissolved labile bromine (DLBr). The study shows that sulphate is the overriding form of sulphur in the waters. For chloride and nitrate, measurements by both methods approach a 1:1 relationship that is barely statistically significantly different from unity. For fluoride, the IC method gives lower values than the colorimetric, especially for the stream waters. However, the colorimetric method determines total fluorine so that a difference is to be expected (for example, fluoride strongly complexes with aluminium that is present, especially in the streamwater).
Keywords: bromine, bromide, chloride, cloud water, colorimetry, fluoride, ion chromatography, mist, rainfall, river, nitrate, sulphate
Introduction
Over the past 25 years, major, minor and trace elements, as well as many other water quality determinands, have been monitored in the Plynlimon experimental catchments in mid-Wales (Neal et al., 1997). The approach has been to use high quality and consistent analytical chemistry techniques to ensure that the results were sufficiently reliable for hydrogeochemical studies and for analysis of long term trends in water quality (Neal et al., 2001). However, recent decommissioning of equipment necessitated a change in bromide determination from a colorimetric method to ion chromatography (IC), which enabled the simultaneous determination of the major anions. In this paper, the results of assays using the different methodologies are compared. This is done to show when there is value in the IC approach and to assess whether the colorimetric method for chloride suffers from water matrix interference effects.This feature is of importance, for example, in examining the dynamic
modelling of chloride time series (Kirchner et al., 2000). The paper also flags the potential importance of organo-bromine compounds in river waters and the non-specificity of the colorimetric method used for bromide analysis and to see if sulphate is the dominant form of sulphur in the waters (i.e. to see whether significant concentrations of organo-sulphur are also present).
Methodology
295 of these various waters by Neal et al. (1997). Typical
concentration ranges in the Plynlimon river waters for the determinands of concern here are: bromide 0 to 50mg l1
, chloride 3 to 15 mg l1
, fluoride 0 to 0.2 mg l1
, nitrate 0 to 6 mg NO3 l
1
and sulphate 2 to 15 mg SO4 l 1
. In rainfall, concentration ranges are higher than this, particularly as regards chloride and bromide.
The analysis was undertaken on samples filtered in the field using 0.45mm cellulose acetate membranes and stored in glass bottles scrupulously cleaned with chromic acid and ultra-pure water. Prior to analysis, the samples were stored in the dark at 4o
C to minimise sample deterioration. In analysing the various determinands, the following methods were used. Fluoride was determined by an automated procedure based on the distillation of hydrogen fluoride and subsequent reaction of the distillate with alizarin fluorine blue-lanthanum reagent to form a lilac blue complex (APHA, 1981). For chloride, an automated procedure was based on the reaction of chloride with mercuric thiocyanate to form soluble mercuric chloride, releasing the thiocyanate ion. In the presence of ferric ions, a highly coloured ferric thiocyanate complex was formed (Zall et al., 1956). Bromide was determined by an automated procedure based on the catalytic effect of bromide on the oxidation of iodine to iodate by potassium permanganate in sulphuric acid solution. The unreacted iodine was extracted into carbon tetrachloride and measured spectrophotometrically. The reaction took place at 0.5o
C. Chloride also catalysed the reaction and this was taken into account (Moxon and Dixon, 1980). Nitrate was determined using an automated procedure based on the reduction of nitrate in alkaline solution by hydrazine in the presence of catalytic amounts of copper. The nitrite produced then underwent a diazotisation reaction with sulphanilamide. The resulting diazonium ion was coupled with N-1-naphthyl-ethylenediamine to form a reddish-purple azo dye (Henriksen, 1965). Sulphate was determined by Inductively Coupled Plasma Optical Emission Spectroscopy using a Perkin-Elmer Dual View 3300 Optima.
Fluoride, chloride, bromide, nitrate and sulphate were also determined by ion chromatography using a Dionex system consisting of an AS50 Autosampler, an AS50 Thermal Compartment, an ED40 Electrochemical Detector and a GP50 Gradient Pump. The column used was an IonPac AS14 with an eluent concentration of 3.5 mM sodium carbonate and 1.0 mM sodium bicarbonate. The system was optimised to ensure good separation of the peaks for all determinands. Particular effort was made in the case of fluoride where the peak is close to that for the signal associated with the water matrix and organic anions.
The detection limits for chloride, nitrate and sulphate were 0.2, 0.1 and 0.2 mg l1
, respectively, for both the colorimetric/
ICPOES and the IC methodologies. For fluoride, the colorimetric and IC detection limits were 0.02 and 0.01 mg l1
, respectively, while the corresponding values for bromide were 0.002 and 0.01 mg l1
. Analytical quality control was undertaken within the Aquacheck scheme (Aquacheck Limited, Europa Business Park, Bury, Lancashire) for fluoride, chloride, nitrate and sulphate; the maximum difference observed was 8.7% for one measurement of fluoride using IC. In most cases, differences were less than 5% and for chloride the maximum difference was 1.6%.
For all the determinations, intermediate standards and blanks were run every ten samples as a check for reproducibility and the samples were rerun if the blank sample was significantly above the baseline and if the assays for the standards were outside 5% of their true value. For the colorimetric analysis, samples were run in duplicate, with the average being taken. If there was a significant difference within the duplicate set, then the samples were rerun. For the IC and ICPOES analysis, single determinations were made.
Results
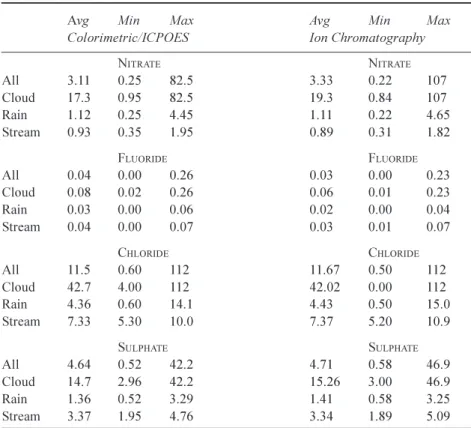
Table 1 provides information on the averages, minimum and maximum nitrate, fluoride, chloride and sulphate concentrations for the comparative methodologies. Details of the individual determinand assays are presented separately below, while Table 2 provides information on linear regression analysis for the colorimetric/ICPOES versus IC determination, the former being taken as the independent term. For this table, the regression is undertaken for all the data as well as for the data separated into the three types of water analysed; cloud, rain and stream water.
BROMIDE
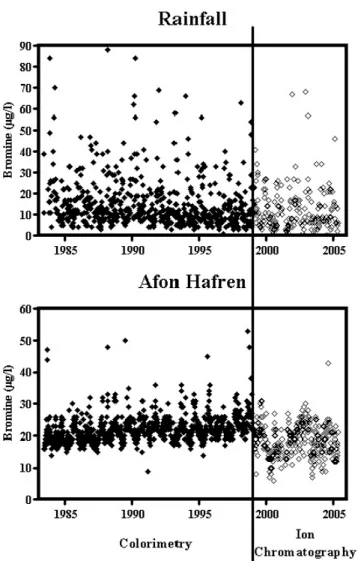
Unlike with the other determinands, for bromide analysis there was no overlap period for methodology comparisons and so here it is necessary to compare the time series for before and after the methodological change. The data for the colorimetric method covers the period May 1983 to January 1999. Figure 1 shows the salient features of the effects of the changeover where bromide concentrations are compared for rainfall and for one of the rivers, the Afon Hafren (results for the other rivers are similar).
In the case of rainfall, there is a small reduction in the average concentration with the changeover in methodology of about 16% (15.6 mg l-1
for the colorimetric and 13.2 mg l1
Margaret Neal, Colin Neal, Heather Wickham and Sarah Harman
296
Table 1. Averages, minimum and maximum concentrations of chloride, fluoride, nitrate and sulphate with concentrations as mg Cl, F, NO
3 and SO4 per litre, respectively.
Avg Min Max Avg Min Max
Colorimetric/ICPOES Ion Chromatography
NITRATE NITRATE
All 3.11 0.25 82.5 3.33 0.22 107
Cloud 17.3 0.95 82.5 19.3 0.84 107
Rain 1.12 0.25 4.45 1.11 0.22 4.65
Stream 0.93 0.35 1.95 0.89 0.31 1.82
FLUORIDE FLUORIDE
All 0.04 0.00 0.26 0.03 0.00 0.23
Cloud 0.08 0.02 0.26 0.06 0.010.23
Rain 0.03 0.00 0.06 0.02 0.00 0.04
Stream 0.04 0.00 0.07 0.03 0.010.07
CHLORIDE CHLORIDE
All 11.5 0.60 112 11.67 0.50 112
Cloud 42.7 4.00 112 42.02 0.00 112
Rain 4.36 0.60 14.1 4.43 0.50 15.0
Stream 7.33 5.30 10.0 7.37 5.20 10.9
SULPHATE SULPHATE
All 4.64 0.52 42.2 4.710.58 46.9
Cloud 14.7 2.96 42.2 15.26 3.00 46.9
Rain 1.36 0.52 3.29 1.41 0.58 3.25
Stream 3.37 1.95 4.76 3.34 1.89 5.09
Table 2. Regression equations for chloride, fluoride, nitrate and sulphate with concentrations as mg Cl, F, NO3 and SO4 per litre, respectively. The independent term is taken as the colorimetric/ICPOES values and the dependent term as ion chromatography values. The data are subdivided into groupings of all samples, cloud samples, rainfall samples and stream samples.
Grad 2*std Constant 2*std r2 N
NITRATE
All 1.04 0.01 -0.10 0.89 0.994 187
Cloud 1.04 0.04 -0.27 2.45 0.991 23
Rain 1.04 0.03 -0.06 0.12 0.997 20
Stream 0.95 0.03 0.010.09 0.973 144
FLUORIDE
All 0.72 0.07 0.00 0.03 0.723 189
Cloud 0.90 0.09 -0.010.02 0.946 25
Rain 0.55 0.23 0.010.02 0.552 20
Stream 0.29 0.12 0.02 0.02 0.136 144
CHLORIDE
All 1.02 0.01 -0.04 1.88 0.997 188
Cloud 1.01 0.03 0.88 5.14 0.994 24
Rain 1.06 0.03 -0.19 0.43 0.996 20
Stream 1.08 0.04 -0.53 0.52 0.945 144
SULPHATE
All 1.06 0.01 -0.21 0.75 0.996 189
Cloud 1.07 0.03 -0.43 1.75 0.995 25
Rain 0.98 0.09 0.08 0.27 0.964 20
bromide concentrations for both sets of data are related
linearly to the chloride concentration (Fig. 2). This is to be expected as much of the bromide in rainfall is associated with sea-salt inputs. The colorimetric and the IC methodologies show essentially the same linear relationship: the regression lines are not significantly different, statistically. This means that the two sets of data are really consistent the lower bromide concentrations associated with the IC assays reflect a lower sea-salt component. The difference in average bromide concentration is also reflected in a difference in the chloride concentration: during the period of colorimetry determination, the average chloride concentration was 4.09 mg l1
while, for the later period of IC determination, the average concentration was 3.74 mg l1
. In the case of the Afon Hafren, there is a 16% reduction in the average estimated bromide concentration with the change from colorimetry to IC methodologies (a reduction in the average from 22.2 mg l1
to 18.6 mg l1
) and the average
concentrations are higher than in rainfall (and there is much lower scatter). However, there are three important differences between the observations for rainfall and the Afon Hafren. Firstly, there is a trend to increasing bromide concentration over time for the period when colorimetry was used, but there is a clear drop in concentration when the IC methodology was introduced. Secondly, there is a clear annual cycle in bromide concentration for the colorimetric information, but this pattern is not present for the IC data. Thirdly, the bromide concentration is not correlated with chloride (Fig. 2).
CHLORIDE, FLUORIDE NITRATE AND SULPHATE
The results for chloride, nitrate and sulphate all show very strong linear relationships between the two methodologies with gradients very close to unity and intercepts not significantly different from zero (Table 1; Fig. 3). In detail,
Fig. 1. A time series of bromide determinations using two analytical chemistry procedures for rainfall and Afon Hafren stream waters.
Margaret Neal, Colin Neal, Heather Wickham and Sarah Harman
the gradients are respectively 1.02, 1.04 and 1.06, with a value of 0.01 for twice the standard error in all cases. However, when the data are separated between cloud, rain and river water, there is a range in gradients that in some cases are statistically significantly different, although all the gradients are close to a value of unity: the lowest gradient is for nitrate with the stream samples, where the gradient is 0.95±0.03 and the highest value is for chloride in the stream with a value of 1.08±0.04. However, it must be borne in mind that the ranges in concentration are very different for the three types of water and that the stream waters show the lowest or next to lowest average concentrations.
Another way of examining the data is to examine the difference for the two methodologies in the average concentration assayed for all; the cloud, rain and stream data is a low percentage. In the case of nitrate, the respective percentage differences in the average assays are 7.1, 11.6, 0.9 and 4.3% and the higher discrepancies come for the cloud and rainfall. Higher discrepancies might be expected for the rainfall and cloud water when examined in this way as any errors will be particularly significant for the small number of particularly high concentrations that are on the more curvilinear portion of the calibration plot. The
corresponding values for chloride are 1.5, 1.6, 1.6 and 0.5%, respectively, and for sulphate, 1.5, 3.8, 3.7 and 0.9%, respectively.
Thus, whichever way the data are examined, there is clearly little difference between the colorimetric/ICPOES and the IC methodologies.
For fluoride, there is also a good linear relationship for all the data from the two methodologies, but there is greater scatter (Fig. 3). The regression gradient is statistically significantly lower than unity (0.72±0.07), but the intercept is not significantly different from zero (Table 1). Further, there is a range of gradients for the three types of water, with the lowest gradient being for the streams (0.29±0.12). As the colorimetric method provides a measure of the total fluorine while the IC method only assesses fluoride in the water, then it seems that there is a significant non-fluoride component in the total fluorine method. This situation might well be expected, given the presence of fluoride complexes with aluminium in the water: especially for the streams where aluminium concentrations are at their highest. However, it must also be borne in mind that the fluoride concentrations are low and near to the limit of detection and that this is especially the case in relation to the streams:
299 the detection limits are 0.01 and 0.02 mg l1
for the IC and colorimetric method, respectively, while the corresponding averages in the stream are 0.04 and 0.03 mg l1
).
Discussion
The study presented here provides clear evidence of consistency in the results for chloride, nitrate and sulphate. These findings show an excellent agreement between the methodologies although small differences do occur in some cases that are of minor importance in the context of the routine monitoring programme. Clearly, there seems to be no significant issue concerning interference effects for chloride and the dominant form for sulphur is sulphate in the water.
For fluoride, the total fluorine method gives values higher than for the fluoride method. Although the measurements are close to the detection limit, this difference seems reasonable as, for example, fluoride binds strongly to aluminium and about 30% of the aluminium is typically complexed by fluoride within the streams (Neal, 1995).
In respect of bromide, two points have to be noted. Firstly, the IC method used later is remarkably good for determining low levels of bromide (tens of mg l1
). Secondly, there is a clear difference between the two methods used, with the IC methodology giving lower values. While the colorimetric methodology is described as being for bromide, the method also responds to bromate. Further, the use of a strong potassium permanganate solution in the colorimetric analysis may well lead to oxidation of the less refractory organic matter, which will also have an organo-bromine component, the breakdown of which would also respond. Hence, the colorimetric method probably measures dissolved labile bromine (DLBr) rather than simply bromide. This must be borne in mind when considering earlier presentations on the Plynlimon data where the bromine data using the colorimetric method is described as bromide (Neal et al., 1990, 1997). With regard to what the difference in the concentrations observed between the two methodologies might be, there are five facts that perhaps point the way:
(1) Bromate would not be expected in the waters studied as it requires highly oxygenating conditions that are met for example with the disinfection of water using ozone or chlorine dioxide (EA, 1997).
(2) There is a trend for increasing DLBr over time that is also found for dissolved organic carbon in the streams (Neal et al., 2005): this is discussed in much more detail in Neal et al., (2007).
(3) Dissolved organic carbon is important within the
streams with respect to humic and fulvic acids that come from the decomposition of plant and other particulate organic matter. The average DOC concentration for the Afon Hafren and the Afon Hore is 1.41 mg-C l1
with a range of 0 to 7.6 mg-C l1
.
(4) Interferences in the assay from components other than DOC (c.f. the list in Moxon and Dixon, 1980) will be small because the concentration of interfering substances is low in the stream waters analysed (chloride is the only exception here and the interference effect has been allowed for in the method).
5. It is known that bromine in soils is correlated strongly with organic matter content, that bromine is enriched in peat and that hill-top peat covers about half of the upper Severn catchment to which the measurements in this paper relate (Reynolds et al., 1989). Furthermore, all the other soils in the area are organic rich. Therefore, organobromine compounds, especially linked to humic acids, could be particularly important in the waters studied (Neal et al., 2006).
Thus, there may well be a significant organo-bromine component in the stream waters. This is relevant both with regard to the hydrobiogeochemical functioning of bromine in the upland environment of the UK but also as a possible concern to the water industry as oxidation of organo-bromine might lead to formation of bromate, a suspected carcinogen, with the World Health Organisation recommending a guide value of 25 mg l1
and a proposal in the Drinking Water Directive for a statutory limit of 10 mg l1
(EA, 1997). Also, bromide in association with humic substances is readily incorporated into haloacetic acids during chlorination and this too poses a health risk. In drinking water the maximum contaminant level is to be set at a total of 40 mg l1
, but there are issues over setting a level based on total concentration since organobromines are potentially more hazardous than chloroform (Rathburn, 1996).
With regard to rainfall and cloud water, there are significant amounts of DOC present (average 0.66 and 2.35 mg-C l1
, respectively) and in cloud water DOC concentrations can be as high as 268 mg-C l1
(Neal et al., 2001). However, the DOC component in rainfall and cloud water is not as humic and fulvic acids (Neal et al., 2001); clearly this other form of carbon is either low in bromine or is sufficiently refractory that it does not decompose with the colorimetric method used.
References
Margaret Neal, Colin Neal, Heather Wickham and Sarah Harman
EA, 1997. The determination of bromate, chlorate and chlorite in waters by ion chromatography. Environment Agency, Rio House, Waterside Drive, Aztec West, Aldmondsbury, Bristol, BS32 4UD, UK. 18pp.
Feng, X., Kirchner, J.W. and Neal, C., 2004. Spectral analysis of chemical time series from longterm catchment monitoring studies: Hydrochemical insights and data requirements. Water Air Soil Pollut., Focus, 4, 221235.
Henriksen, A., 1965. An automated method for determining nitrate and nitrite in fresh and saline waters. Analyst, 90, 8388.
Kirchner, J.W., Feng, X. and Neal, C., 2000. Fractal stream chemistry and its implications for contaminant transport in catchments. Nature, 403, 524527.
Kirchner, J.W., Feng, X. and Neal, C., 2001. Catchment-scale advection and dispersion as a mechanism for fractal scaling in stream tracer concentrations. J. Hydrol., 254, 81100.
Moxon, R.E.D. and Dixon, E.J., 1980. An automatic method for the determination of bromide in water. J. Automatic Chem., 2,
139142.
Neal, C., 1995. Aluminium speciation variations in an acidic upland stream draining the Hafren spruce forest, Plynlimon, Mid-Wales. J. Hydrol., 164, 3951.
Neal, C. and Kirchner, J.W. 2000. Sodium and chloride levels in rainfall, mist, streamwater and groundwater at the Plynlimon catchments, mid-Wales: inferences on hydrological and chemical controls. Hydrol. Earth Syst. Sci., 4, 295310.
Neal, C., Smith, C.J., Walls, J., Billingham, P., Hill, S. and Neal, M., 1990. Comments on the hydrochemical regulation of the halogen elements in rainfall, stemflow, throughfall and stream waters at an acidic forested area in Mid-Wales. Sci. Total Envir.,
91, 111.
Neal, C., Wilkinson, R.J., Neal, M., Harrow, M.L., Wickham, H., Hill, L. and Morfitt, C., 1997. The hydrochemistry of the headwaters of the River Severn, Plynlimon, Wales. Hydrol. Earth Syst. Sci., 1, 583618.
Neal, C., Reynolds, B., Neal, M., Pugh, B. and Wickham, H., 2001. Long term changes in the water quality of rainfall, cloud-water and stream cloud-water for moorland , forested and clear-felled catchments at Plynlimon. Hydrol. Earth Syst. Sci., 5, 459476.
Neal, C., Neal, M., Hughes, S., Wickham, H., Hill, L. and Harman, S., 2007. Bromine and bromide in rainfall, cloud, stream and groundwater in the Plynlimon area of mid-Wales. Hydrol. Earth Syst. Sci., 11,301312.
Rathburn, R.E., 1996. Bromine incorporation factors for trihalomethane formation for the Mississippi, Missouri and Ohio Rivers. Sci. Total Envir., 192, 111118.
Reynolds, B., Hornung, M. and Hughes, S., 1989. Chemistry of streams draining grassland and forest catchments at Plynlimon in mid Wales. Hydrolog. Sci. J., 34, 667686.
Zall, D.M., Fisher, D. and Garner, M.Q., 1956. Photometric determination of chlorides in water. Analyt. Chem., 28, 1665