Effects of Hormone Agonists on Sf9 Cells, Proliferation
and Cell Cycle Arrest
Maeva Giraudo1,2, Je´roˆme Califano1,3, Fre´de´rique Hilliou1, Trang Tran1,4, Nathalie Taquet1,5, Rene´ Feyereisen1, Gae¨lle Le Goff1*
1Institut National de la Recherche Agronomique, UMR 1301 Interactions Biotiques et Sante´ Ve´ge´tale, Centre National de la Recherche Scientifique, UMR 6243, Universite´ de Nice Sophia Antipolis, Sophia-Antipolis, France,2UMR 6023 CNRS-Universite´ Blaise Pascal, Baˆt. Biologie A – Campus des Ce´zeaux, Aubie`re, France,3De´partement des affaires re´glementaires, Grasse, France,4Lanaud Gestion-Poˆle de Lanaud, Boisseuil, France,5Bioimagerie, Villeneuve Loubet, France
Abstract
Methoxyfenozide and methoprene are two insecticides that mimic the action of the main hormones involved in the control of insect growth and development, 20-hydroxyecdysone and juvenile hormone. We investigated their effect on the
Spodoptera frugiperdaSf9 cell line. Methoxyfenozide was more toxic than methoprene in cell viability tests and more potent in the inhibition of cellular proliferation. Cell growth arrest occurred in the G2/M phase after a methoprene treatment and more modestly in G1 after methoxyfenozide treatment. Microarray experiments and real-time quantitative PCR to follow the expression of nuclear receptors ultraspiracle and ecdysone receptor were performed to understand the molecular action of these hormone agonists. Twenty-six genes were differentially expressed after methoxyfenozide treatment and 55 genes after methoprene treatment with no gene in common between the two treatments. Our results suggest two different signalling pathways in Sf9 cells.
Citation:Giraudo M, Califano J, Hilliou F, Tran T, Taquet N, et al. (2011) Effects of Hormone Agonists on Sf9 Cells, Proliferation and Cell Cycle Arrest. PLoS ONE 6(10): e25708. doi:10.1371/journal.pone.0025708
Editor:Immo A. Hansen, New Mexico State University, United States of America
ReceivedAugust 5, 2011;AcceptedSeptember 8, 2011;PublishedOctober 3, 2011
Copyright:ß2011 Giraudo et al. This is an open-access article distributed under the terms of the Creative Commons Attribution License, which permits unrestricted use, distribution, and reproduction in any medium, provided the original author and source are credited.
Funding:We thank Agence Nationale pour la Recherche (ANR 06BLAN0346) for funding. M. Giraudo was supported by a PhD fellowship from Institut National de la Recherche Agronomique and region Provence Alpes Coˆte d’Azur.The funders had no role in study design, data collection and analysis, decision to publish, or preparation of the manuscript.
Competing Interests:The authors have declared that no competing interests exist.
* E-mail: [email protected]
Introduction
Growth and development are controlled by two major hormones in insects, the steroid 20-hydroxyecdysone (20E) and the sesquiterpenoid juvenile hormone (JH) [1]. The cross-talk between these two hormones regulates all stages from egg-larva-pupa to adult. A high level of 20E is required to initiate all developmental transitions and JH determines the nature of the moult [2]. JH is necessary for larval moulting and growth [3]. The signalling action of these hormones involves nuclear receptors. If the mode of action of 20E is well-known, that of JH remains more enigmatic. 20E exerts its action through binding to a nuclear receptor heterodimer consisting of an ecdysone receptor (EcR) and ultraspiracle (USP) which is the insect ortholog of retinoid-X-receptor from vertebrates [4]. The complex regulates expression of target genes by binding to gene promoter regions. In Drosophila, it was shown that 20E linked to its receptor activates early genes among which are the transcription factor regulators, the Broad complex (BR-C), E74 and E75 [5,6]. It is those transcription factors that in turn regulate late genes that have direct effector roles (including affecting cell death, cellular proliferation, differ-entiation and cuticle production). Several receptor candidates for JH exist including MET (Methoprene tolerant) a member of the bHLH-PAS transcription factor family [7] and USP [8]. MET can bind JH at physiological concentrations [9] whereas USP was shown to bind JH with low affinity, at concentrations at least 100 times lower than expected for a nuclear receptor [10]. However
These hormonal receptors (EcR, USP and Met) are also the target for insecticides which act by disrupting insect development. Agonist hormone insecticides are of growing interest because some have selective toxicity, they are potent against pest insects and less or non toxic for beneficial insects, mammals, fishes and birds [23]. Among 20E agonists are diacylhydrazines, a non-steroidal agonist family, having insecticide activity by binding to the EcR-USP receptors. This family of compounds provokes a premature moult that leads to the death of the insect and they are only acting on larvae. The activity spectrum of these compounds varies within insect orders and is directly correlated to receptor affinity for the insecticide [23,24]. For example, methoxyfenozide is more effective against Lepidoptera [25]. The other insecticides that mimic hormone action are juvenile hormone agonists (JHA),
initially designed to be metabolically stable JH analogs. Their precise molecular target is less well-known due to the still controversial mode of action of JH. JHA block insects at an intermediate stage during development, making them unable to emerge as normal adults. They also disrupt reproduction in insects where JH is gonadotropic. Methoprene was the first successfully used JHA [26] and it is more effective against dipteran insects compared to Lepidoptera.
Cell lines can be a useful tool to understand insecticide mode of action. Several members of the diacylhydrazines have been tested on insect cell lines, showing an inhibition of cellular proliferation. This is the case for the Drosophila Kc cell treated by RH-5849 and tebufenozide [27,28]. Similar effects on cell growth arrest have also been observed with these compounds in the lepidopteran
Figure 1. Methoxyfenozide and methoprene toxicity to Sf9 cells.Cell viability was followed by the MTT test at 24, 48 and 72 h post-treatment of Sf9 cells by methoxyfenozide (A) or methoprene (B). Data are the mean of three independent experiments with SE.
cell line IAL-PID2 from the imaginal wing disks of Plodia interpunctella[29], as well as in an epithelial cell line fromChironomus tentans[30]. Further studies on IAL-PID2 with tebufenozide have shown a G2/M arrest with an induction of mRNA transcripts for EcR and USP associated with a decrease in the expression of cyclin B, one of the proteins involved in cell cycle control [31]. Effects on cell proliferation were also reported for the JH agonists methoprene and fenoxycarb on IAL-PID2 [32], but the molecular mechanism leading to this arrest was not clarified.
In this study we were interested in the effects of insecticides that mimic hormone action on theSpodoptera frugiperdaSf9 cell line. The toxicity of methoxyfenozide and methoprene was evaluated. Both insecticides inhibit cellular proliferation. Flow cytometry analysis showed a distinctly different action between these compounds with a G2/M arrest after methoprene treatment, whereas methoxyfe-nozide induced a slight accumulation in G1. To investigate the differential molecular mode of action of these hormone agonists, we have performed microarray experiments and followed the expression of nuclear receptors by real-time quantitative PCR (RT-qPCR). Our results suggest two different signalling pathways in response to methoxyfenozide and methoprene treatments.
Results
Toxicological effects of methoxyfenozide and methoprene on Sf9 cells
Cell viability was determined by the MTT test after an insecticide exposure of 24, 48 and 72 hours. Methoxyfenozide had almost no effect at 10 nM, the lowest concentration tested, but already a marked effect at 100 nM (Fig. 1A). Increased insecticide concentrations did not significantly modify the cell viability. The IC50is below 100 nM at 72 h and cannot be calculated at 24 and 48 h. Figure 1B shows the results for methoprene. Almost no effect was observed up to 25mM, whatever the length of treatment (90% of cells were viable). For a concentration range between 50 and 75mM, toxicity was low (after 72 h, still 70% of cells were viable). The calculated IC50 at 48 and 72 h was 184.264.8mM and 86.369.8mM respectively. The two hormone agonists induced cell death and methoxyfenozide was more potent than metho-prene by a toxicological factor of about 1,000.
Cellular proliferation inhibition
The effect of these insecticides on cellular proliferation was monitored. Cells in the DMSO control grew to a density of 15 to 17.105cells/ml at 72 h (Fig. 2). Cell density at 24 h and 72 h in DMSO was significantly different, indicating that cells had proliferated. A normal and significant growth of the cells treated by methoxyfenozide was observed at the lower concentration (10 nM), however, all the other tested concentrations had an antiproliferative effect (Fig. 2A). At 50mM of methoxyfenozide, the number of cells remained stable for 3 days. Methoprene had no effect at 1mM with a cell density equivalent to the DMSO control. An inhibition of cell proliferation was observed in the concentration range between 50 and 100mM, with no significant difference between numbers of cells at 24 h or 72 h (Fig. 2B). Proliferation arrest was reversible in both cases after removal of the insecticide (data not shown). Methoprene and methoxyfeno-zide therefore both caused an arrest of cell proliferation in a dose-dependent and reversible manner.
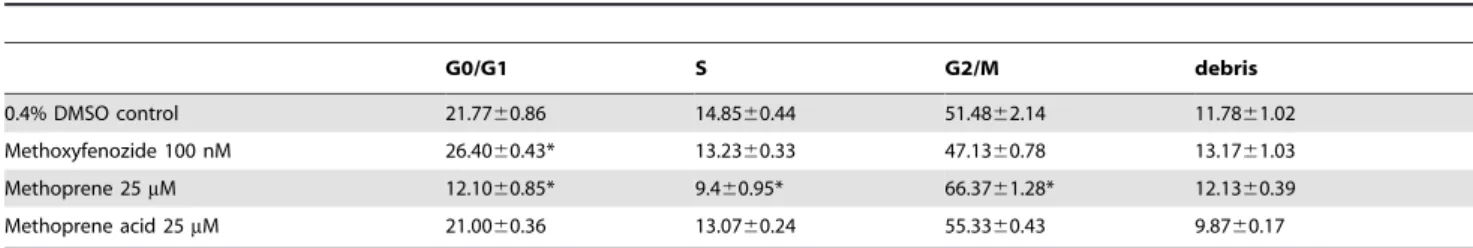
Distinct phases of arrest in the cell cycle
In order to evaluate in which phase of the cell cycle the cells were arrested after insecticide treatment, we used flow cytometry. In cells treated with methoxyfenozide, a slight but significant
(p-Value.0.01) accumulation occurred in the G0/G1 phase compared to the DMSO control (Table 1). In cells treated with methoprene, cells were arrested in the G2/M phase with 66.37% of cells in this stage (Table 1) and values in the three different phases were significantly different from the DMSO control. Cells were also treated with 25mM methoprene acid as a negative control. Methoprene acid lacks the isopropyl ester group of methoprene and has therefore no JH agonist activity. Cell percentages in the cell cycle phases were similar in methoprene acid and DMSO-treated cells, indicating that methoprene acid did not affect the cell cycle at a concentration where methoprene does.
Molecular pathways involved in the cell response to hormone agonist treatments
The phenotypic effects were similar between Sf9 cells treated by methoprene or methoxyfenozide with an arrest of the cell growth and cell morphology identical to that of control cells (data not shown). However, the insecticides had different molecular effects with an accumulation in the G0/G1 or G2/M phase for methoxyfenozide and methoprene, respectively. The molecular genetic regulation leading to this arrest still needs to be elucidated. We therefore compared the transcriptional effect of each hormone agonist by using a specifically designed oligonucleotide micro-array. We chose the first concentration of insecticide having a significant effect on cell proliferation, i.e 100 nM for methox-yfenozide and 25mM for methoprene, in order to focus on physiological effects and avoid toxicological effects.
Genes were considered as differentially regulated by the insecticide if their expression ratio was .1.5 or ,0.66 and P value,0.05. Sequences of these genes were analysed in Blast2Go to assign them Gene Ontology (GO) terms and then classified in biological process level 3 (Table 2). The sequences for which no homology was found by blastx were submitted to a blastn in Butterflybase and classified in ‘‘hypothetical protein’’ category if homology was found with the sequence of another lepidopteran transcript, while the sequences restricted toS. frugiperdawere put in a ‘‘hypothetical transcripts’’ category.
After methoxyfenozide treatment, 26 genes were differentially expressed with 14 overexpressed and 12 down-regulated (Table 3). Looking in more detail at the list of differentially regulated genes may help to identify the potential function of genes involved in the molecular and cellular effects of methoxyfenozide. Therefore, genes were classified in more precise categories of Gene Ontology. The most up-regulated gene codes for a vacuolar ATPase subunit B that is involved in the transport of proton across the membrane. The most down-regulated gene is an aldehyde oxidase. Several genes with function in translation and transcription were overexpressed as well as genes encoding calcium-dependent proteins, like cadherin and calreticulin.
In the case of methoprene, 55 genes were differentially regulated with 39 over-expressed and 16 down-regulated (Table 4). There was no overlap between the genes regulated by methoxyfenozide and methoprene. The main category of genes up-regulated by methoprene is the hypothetical transcripts category (15 genes). The next categories are the genes involved in cellular metabolic process (9 genes) and transcription/ translation (7 genes). These categories are also the most populated for cells treated by methoxyfenozide. Five genes upregulated by methoprene belonged to the response to stress category. The most induced (mitochondrial ribosomal protein L49) and most repressed (mitochondrial translational release factor 1 like) genes belong to the category of genes with functions in translation and transcription. This category has the highest number of genes regulated by methoprene (8 genes), followed by the class of genes
Figure 2. Effects of methoxyfenozide and methoprene on Sf9 cellular proliferation.Cells were counted 24, 48 and 72 h post-insecticide treatment, (A) methoxyfenozide, (B) methoprene. Data are the mean of three independent experiments with SE. At-test was performed to determine significance of the results (* p-Value,0.05, ** p-Value,0.01).
doi:10.1371/journal.pone.0025708.g002
Table 1.Cell cycle analysis by flow cytometry after 24 h of insecticide treatment.
G0/G1 S G2/M debris
0.4% DMSO control 21.7760.86 14.8560.44 51.4862.14 11.7861.02
Methoxyfenozide 100 nM 26.4060.43* 13.2360.33 47.1360.78 13.1761.03
Methoprene 25mM 12.1060.85* 9.460.95* 66.3761.28* 12.1360.39
Methoprene acid 25mM 21.0060.36 13.0760.24 55.3360.43 9.8760.17
with functions in response to stress and detoxification (7 genes). Several genes involved in spindle assembly are also over-expressed.
Expression of hormone receptors
Microarrays were not sensitive enough to detect transcripts of the nuclear receptors EcR or USP, and we did not have probes for Met on our array. Indeed we were unable to find the Met sequence in Spodobase (http://www.spodobase.univ-montp2.fr/ Spodobase). Therefore, we used RT-qPCR approaches to study the expression of EcR and USP in Sf9 cells treated with methoxyfenozide or methoprene and compared to DMSO treated cells. Methoxyfenozide significantly induced the expression of both receptors, but methoprene only induced USP (Fig. 3).
Discussion
Cell lines provide a useful tool to investigate the molecular mode of action of insecticides. The Spodoptera frugiperda Sf9 cell line is probably the most widely used for high level expression of recombinant proteins [33]. Moreover,S. frugiperdafrom which the Sf9 cell line is derived is a major crop pest, a polyphagous insect able to feed on many different host plants. We decided to use this cell line to determine the effects of two insecticides which are agonists of major hormones controlling insect development, 20E and JH.
Methoxyfenozide acts as an agonist of 20E by binding to the EcR/USP receptor complex. Its affinity for the receptor in Lepidoptera is 420 times higher than that of the insect moulting hormone [23,25]. However, the affinity varies within insect orders, it is more potent on the lepidopteran cell line Plodia interpunctella than on theDrosophilaKc cells [23]. Methoprene has a different spectrum of activity, being very effective against dipteran insects but less so against Lepidoptera [34]. These different potencies are correlated to data obtained in our toxicological tests, where methoxyfenozide acts at a lower concentration than methoprene. However it seems that there are two populations of cells in the Sf9 line. One very sensitive to methoxyfenozide dies at doses 10 to 100 nM, which is in accordance to data obtained on another cell
line Se4 fromSpodoptera exigua[35], and another one more resistant for which stronger doses of 1 to 75mM had no effect. Nevertheless these two putative cell sub-populations have the same sensitivity for methoprene.
We show that the two insecticides inhibit cellular proliferation. Treatment by tebufenozide, another diacylhydrazine, leads to the same effects in two other lepidoptera cell lines, IAL-PID2 from Plodia interpunctella [31] and Se4 from Spodoptera exigua [36]. Methoprene and another analog of JH, fenoxycarb, significantly inhibit cell proliferation of the IAL-PID2 cell line [32]. Auzoux-Bordenaveet al.(2005) reported that tebufenozide arrested the cell cycle in G2/M in the same cell line. The moulting hormone itself, 20E, causes an arrest in G2 in Kc cell [37] and in IAL-PID2 cells [38] whereas arrest occurs in the G1 phase in mosquito C7-10 cells [39]. The accumulation of cells in a given phase of the cell cycle is usually reported 10 to 24 h after treatment by hormones or analogues [31,39]. We chose to perform our flow cytometry and microarray experiments at 24 h. In Sf9 cells, we show that inhibition of cellular proliferation associated with methoxyfenozide treatment induces a modest accumulation in G1 phase. In contrast, methoprene blocks the cells in G2/M. Cell accumulation in G1 or G2 correspond to an arrest at the two cell cycle checkpoints: in one case cells are stopped before DNA synthesis (G1) and in the other, entrance in mitosis is prevented (G2/M). When tested at the same concentration as methoprene, metho-prene acid has no effect on cellular proliferation, which suggests that methoprene arrest of the cell cycle is due to its role as hormone mimic.
We have investigated insecticide mode of action at the molecular level in order to understand pathways leading to this cellular arrest. We used a custom microarray consisting of 9,773 probes ofS. frugiperda, which represents approximately 67% of the genome compared to the lepidopteran model genome ofBombyx mori[40]. Several studies have examined the effects of hormones on cell lines [41,42]. In addition, Mosallanejadet al.[43] reported microarray data on Drosophila cell line S2 resistant to methox-yfenozide. However, to date no study has been performed by microarray on cell lines following hormone agonist treatment. In Table 2.Classification of genes regulated in Sf9 cells after treatment by methoxyfenozide or methoprene according to GO terms, blast2Go annotation level 3.
methoxyfenozide methoprene
Biological process up-regulated down-regulated up-regulated down-regulated
biosynthetic process 2 1 4 3
cellular component organisation 3 0 1 3
cell cycle 0 0 1 1
cellular metabolic process 8 4 9 4
establishment of localization 2 1 3 1
multicellular organismal development 1 1 2 2
regulation of biological process 2 1 2 3
reproductive process 2 0 1 2
response to stress 0 2 5 2
transcription/translation 4 1 7 1
transport 2 1 2 1
hypothetical protein 0 2 4 0
hypothetical transcript 2 3 15 7
unknown function 0 1 0 0
doi:10.1371/journal.pone.0025708.t002
our study, very few genes are differentially expressed after treatment with methoxyfenozide (26 genes) or methoprene (55 genes). It may therefore correspond to a more physiological response linked to the regulation of cell cycle rather than a generalized stress response to the xenobiotic. The cell cycle consists of four distinct phases: in the G1 phase cells grow and cyclin D is expressed. In the S phase DNA replication occurs and cyclins E and A predominate. In the G2 phase, degradation of cyclin E and accumulation of cyclin B occur. This phase is followed by mitosis and cell division [44]. The progression through the cell cycle is controlled by cyclins and cyclin dependent kinases (CDK). The cyclins form complexes with CDK, CDK4 for cyclin D, CDK2 for cyclin E. Our array only has one probe for cyclin A, but none for other cyclins. No change in cyclin A levels was detected, although Mottieret al.reported a significant decrease in the expression of cyclin A and B after a 20E treatment of IAL-PID2 cells, the level of both cyclins remaining very low between 12 and 36 h post-treatment [38]. On the other hand, we observed some differentially expressed transcripts that are consistent with an arrest of the cell cycle: as overexpression of different genes involved in the spindle assembly after methoprene treatment. Indeed a biosynthetic step occurs during the G2 phase, mainly
involving the production of microtubules which are required during the process of mitosis. Genes such as cadherin are overexpressed in our methoxyfenozide experiments and these are overexpressed in cells that had stopped to proliferate [45]. Among the genes affected by methoxyfenozide, we find genes Table 3.Microarray data for selected genes after Sf9
treatment by methoxyfenozide.
Gene description and putative function adhoc ratio P value
Actin cytoskeleton
gelsolin 40151 1.59 0.0406
Carbohydrate metabolism
6-phosphogluconolactonase 27223 2.39 0.0102
Catabolism process
3-hydroxyisobutyryl Coenzyme A hydrolase 25654 0.64 0.0083
hydroxyphenylpyruvate dioxygenase 39567 1.64 0.0486
Cell adhesion
cadherin 26462 6.32 0.0098
Chaperone proteins
calreticulin 40650 4.47 0.0168
Proteolysis
von Hippel-Lindau tumour suppressor protein 24976 0.18 0.0014
chymotrypsin 25557 2.9 0.0386
Reproductive protein
vitellogenin 25793 1.69 0.0149
Response to stress/Detoxification
heat shock protein 90 39008 0.57 0.0440
aldehyde oxidase 34664 0.14 0.0436
Sugar synthesis
chondroitin sulfate synthase 44313 3.55 0.0254
Translation/Transcription
polyadenylate binding protein 2 36158 6.19 0.0102
p27BBP/eIF6 33876 3.58 0.0252
dead box RNA helicase 25789 3.11 0.0422
Transport
vacuolar ATPase subunit B 34648 9.44 0.0059
vacuolar ATPase subunit C 40849 0.64 0.0131
doi:10.1371/journal.pone.0025708.t003
Table 4.Microarray data for selected genes after Sf9 treatment by methoprene.
Gene description and putative function adhoc ratio P value
Amino acids biosynthetic process
phosphoserine phosphatase 25880 0.62 0.0022
Extracellular matrix protein
hemicetin like protein 1 25674 1.7 0.0355
Immune protein
scolexin B like 34835 1.77 0.0116
Mitotic cell cycle checkpoint
14-3-3 epsilon protein 41120 0.62 0.0022
Phospholipid biosynthetic process
choline/ethanolamine kinase 36601 0.54 0.0273
Polyamine synthesis
S-adenosylmethionine decarboxylase 44296 1.71 0.0151
Regulation of Rab GTPase activity
Tbc1 domain family 39160 0.57 0.0026
Response to stress/Detoxification
carboxylesterase 40600 3.89 3.75E-07
prophenoloxidase activating factor 26333 2.55 0.0086
aldehyde dehydrogenase 7 family member A1 25971 1.89 0.0019
pheromone degrading enzyme 2 34999 1.59 0.0172
apolipoprotein D precursor 35472 1.55 0.0119
DNAJ-1 38331 0.65 0.0456
uridine diphosphate glucosyltransferase 35495 0.55 0.0422
Spindle assembly
microtubule associated protein RP/EB family 3 44445 2.86 0.0441
kinesin like protein 36395 2.75 0.0110
beta-tubulin cofactor E 36883 2.07 0.0152
Structural constituent of cuticule
cuticle protein 1 like 38620 0.61 0.0462
Translation/Transcription
mitochondrial ribosomal protein L49 27227 4.62 3.83E-06
60S ribosomal protein L31 25976 1.77 0.0019
coiled-coil-helix-coiled-coil helix domain containing 8
34522 1.67 7.20E-05
ribosomal protein L10 38355 1.55 0.0139
spt3 associated factor 42 41154 1.52 0.0044
mitochondrial translational release factor 1 like 40890 0.43 0.0035
tRNA splicing endonuclease 2 35120 1.9 1.29E-05
bip2 like 41062 1.5 0.0050
Transport
phosphate transport protein 38062 1.85 0.0017
translocase of inner mitochondrial membrane 40155 0.61 0.0079
Vesicle trafficking
exocyst complex component 6 36460 1.5 0.0340
coding for different subunits of vacuolar ATPase. They are differentially regulated, with subunit B upregulated and C downregulated. Insect vacuolar ATPase (V-ATPase) consists of two functional parts, the peripheral catalytic V1 complex composed of eight different subunits (from A to H) that hydrolyzes ATP and the integral membrane V0 complex consisting of four different subunits (a,c,d,e) that transports protons across the membrane [46]. These two parts can disassemble and reassemble depending on conditions which regulate V-ATPase activity [47,48]. Both subunits can bind actin filament [49,50], but subunit C is the only subunit that can be phosphorylated [51]. Another specificity of subunit C is its release in the cytosol upon dissociation of the two complexes [52,53]. Clearly, subunit C has its own properties and can be a good candidate to mediate signalling pathway [54]. Opposite regulation of subunits B and C may therefore not be surprising. Moreover, promoter studies have revealed different regulatory elements between the two subunits’ genes in M. sexta [48]. Down regulation of V-ATPase in apical globelet cell ofManduca sextaduring moulting and starvation was also suggested [47,55]. These data may indicate a possible involvement of hormone on the regulation of V-ATPase expression.
Genes and pathways involved in the various stages of the cell cycle progression were identified in a study on human HeLa cells using small interfering RNAs to target.95% of the protein coding genes [56]. Several concordant observations can be made between genes shown to be essential in that study and genes differentially regulated in our study. For example, several ribosomal proteins, kinesin, DNA-J have been shown to be essential for G2/M progression and are differentially regulated after methoprene treatment. Similarly, eIF, ATPase and dead box RNA helicase are
essential in G1 phase and are differentially regulated after methoxyfenozide treatment.
More information concerning our microarray results (unknown genes) should be obtained with the forthcoming release of theS. frugiperda genome. Arrest of cell proliferation occurs at two checkpoints by distinct gene regulatory mechanism, at our level of sensitivity there are no genes in common. The recent discovery of a receptor co-activator able to bind EcR or Met depending on hormone concentration may explain why genes are up or down regulated: this co-activator may be a possible link for the cross-talk in these two signalling pathways [21,22]. The presence of such a receptor co-activator remains unproven in the Sf9 cells. Further work is required to understand more precisely the mode of action of hormone agonists.
Materials and Methods
Cell culture
The Sf9 cells (from Invitrogen), derived from the pupal ovarian tissue ofS. frugiperda, were cultured in a flask at 27uC in monolayer with the insect-Xpress protein free medium (Lonza). Cell density was determined by Malassez haemocytometer counts and cell viability was evaluated by methylene blue (1 mg/ml, v/v) staining. Prior to experiments, cells were seeded onto 6 well plates at 5.105 cells/ml and left at 27uC for adhesion. Attached cells were then treated for 24 h with different concentrations of methoxyfenozide, methoprene, methoprene acid (all in 0.4% DMSO) or with 0.4% DMSO alone.
MTT assay of cell viability
Sf9 cells were seeded in 96-well culture plates and treated for 24, 48 and 72 hours with increasing concentrations of methoprene and methoxyfenozide. Cells in culture were then loaded with MTT (0.5 mg/ml) and incubated at 27uC for 2 hours. Cell homogenates were used to measure absorbance at 570 nm using a microplate reader (SpectraMax, Molecular Devices).
Cell cycle analysis
Cellular DNA content was determined by staining cells with propidium iodide and measuring fluorescence (FACSCalibur, Becton Dickinson). The Sf9 cells were incubated for 24 hours with methoxyfenozide or methoprene then resuspended and fixed on ice for 30 minutes with 70% ethanol/PBS (10 mM Na2HPO4, 138 mM NaCl, 2.7 mM KCl, pH 7.4). The fixed cells were incubated for 20 min at 37uC in a solution containing 50mg/ml RNAse and 50mg/ml propidium iodide. For each cell population, 10,000 cells were analysed by FACS and the percentage of cells in a specific phase of the cell cycle was determined with the propidium iodide DNA staining technique [57]. Cells were classified in G0/G1, S and G2/M phases depending on the intensity of the fluorescence peaks.
RNA extraction
Total RNA was extracted from cells of a well of the 6 wells plate using Trizol Reagent (Invitrogen Life technologies). Extractions were performed on three independent biological replicates.
Microarray experimental design
Our oligonucleotides were designed from 79148 ESTs sequenc-es of eight different tissusequenc-es ofS. frugiperda(http://www.spodobase. univ-montp2.fr/Spodobase/). Using the assembly analysis (pro-gramme CAP3), we obtained 10,092 contigs and singletons from these ESTs. OurS. frugiperdamicroarray consists of 9,773 60-mers oligonucleotides synthesized by Sigma-Aldrich that were designed
Figure 3. Transcript abundance of hormone nuclear receptors measured by RT-qPCR after insecticide treatment.At-test was performed to determine significance of the results (* p-Value,0.05, ** p-Value,0.01).
doi:10.1371/journal.pone.0025708.g003
to match unique contigs or singletons and to suit our hybridization conditions (GC content average 46% and average Tm of 86.8uC). Each comparison consisted of six slides, three biological replicates hybridized with dye swap (fully balanced dye swap) and duplicate spots. cDNA were synthesized from 7mg of total RNA and labelled with the dyes Cy3-dCTP and Cy5-dCTP (Amersham) using the ChipShot direct labeling system (Promega) according to the manufacturer’s instructions. The microarray were hybridized with cDNA prepared as described by Le Goff et al. [58] and scanned using a GenePixPro scanner (Axon,version 3.01). Experimental data and associated microarray designs have been deposited in the NBCI Gene Expression Omnibus (GEO) (http:// www.ncbi.nlm.nih.gov/geo/) under serie GSE30937 and platform record GPL8717 using Mediante database for data transfer [59].
Data analysis
We used the Bioconductor suite of statistical packages [60]: limma [61] for our data analysis. The expression intensity was obtained by subtracting the background intensity from the foreground intensity for each non-flagged spot (all flagged spots were eliminated). The expression data were normalized by the use of the within-array normalization with the ‘‘loess method’’ and the between-array normalization using the ‘‘quantile method’’ [62]. The linear model for series of arrays and empirical Bayes method were then applied for assessing differential expression [63]. The false discovery rate of the p-value for multiple tests was controlled by using the Benjamini-Hochberg method. Differentially ex-pressed genes were selected if the absolute value of log2-fold-change was greater than 1, the adjusted p-value below 0.01 and the average intensity greater than twice the average background. In order to provide an overall measure of evidence of differential
expression, we used Fisher’s method for combining adjusted p-values from independent tests of significance of duplicate spots [64].
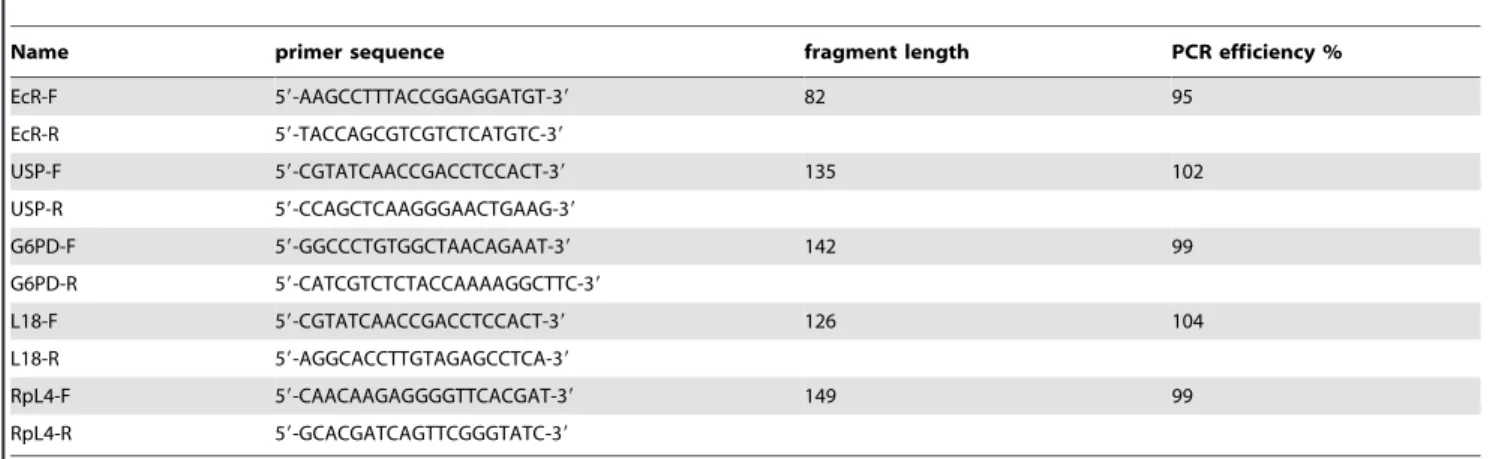
Quantitative real-time PCR
Total RNA (1mg) was reverse transcribed using the iScript cDNA Synthesis kit (Biorad). RTqPCR reactions were carried out on an Opticon monitor 2 (Biorad) using the qPCR Mastermix plus for SYBR Green I no ROX (Eurogentec). The PCR conditions were as follows: 50uC for 2 min, 95uC for 10 min, followed by 40 cycles of 95uC for 30 s, 60uC for 30 s and 72uC for 30 s. Each reaction was performed in technical triplicates and the mean of the three independent biological replicates was calculated. All results were normalized using mRNA level of three control genes (RpL4, L18 and G6PD) and relative expression values were calculated in R using the RqPCRAnalysis package developed in our laboratory (Hilliou and Tran, manuscript in preparation). Primer sequences and PCR efficiencies are listed in the Table 5.
Acknowledgments
We thank Julie Cazareth, Institut de Pharmacologie Moleculaire et Cellulaire Sophia Antipolis, for her technical help in the flow cytometry experiments.
Author Contributions
Conceived and designed the experiments: MG GLG RF. Performed the experiments: MG JC NT GLG. Analyzed the data: MG JC FH GLG. Contributed reagents/materials/analysis tools: FH TT. Wrote the paper: GLG RF.
References
1. Truman JW, Riddiford L (1999) The origins of insect metamorphosis. Nature 401: 447–452.
2. Dubrovsky EB (2005) Hormonal cross talk in insect development. Trends Endocrinol Metab 16: 6–11.
3. Riddiford LM (1996) Juvenile hormone: the status of its ‘‘status quo’’ action. Arch Insect Biochem Physiol 32: 271–286.
4. Yao TP, Segraves WA, Oro AE, McKeown M, Evans RM (1992) Drosophila ultraspiracle modulates ecdysone receptor function via heterodimer formation. Cell 71: 63–72.
5. Karim FD, Thummel CS (1992) Temporal coordination of regulatory gene expression by the steroid hormone ecdysone. EMBO J 11: 4083–4093. 6. Thummel CS (2001) Molecular mechanisms of developmental timing in C.
elegans and Drosophila. Dev Cell 1: 453–465.
7. Ashok M, Turner C, Wilson TG (1998) Insect juvenile hormone resistance gene homology with the bHLH-PAS family of transcriptional regulators. Proc Natl Acad Sci U S A 95: 2761–2766.
8. Jones G, Sharp PA (1997) Ultraspiracle: an invertebrate nuclear receptor for juvenile hormones. Proc Natl Acad Sci U S A 94: 13499–13503.
9. Miura K, Oda M, Makita S, Chinzei Y (2005) Characterization of the Drosophila Methoprene -tolerant gene product. Juvenile hormone binding and ligand-dependent gene regulation. FEBS J 272: 1169–1178.
10. Jones G, Wozniak M, Chu Y, Dhar S, Jones D (2001) Juvenile hormone III-dependent conformational changes of the nuclear receptor ultraspiracle. Insect Biochem Mol Biol 32: 33–49.
11. Moore AW, Barbel S, Jan LY, Jan YN (2000) A genomewide survey of basic helix-loop-helix factors in Drosophila. Proc Natl Acad Sci U S A 97: 10436–10441.
Table 5.Primers used in RT-qPCR.
Name primer sequence fragment length PCR efficiency %
EcR-F 59-AAGCCTTTACCGGAGGATGT-39 82 95
EcR-R 59-TACCAGCGTCGTCTCATGTC-39
USP-F 59-CGTATCAACCGACCTCCACT-39 135 102
USP-R 59-CCAGCTCAAGGGAACTGAAG-39
G6PD-F 59-GGCCCTGTGGCTAACAGAAT-39 142 99
G6PD-R 59-CATCGTCTCTACCAAAAGGCTTC-39
L18-F 59-CGTATCAACCGACCTCCACT-39 126 104
L18-R 59-AGGCACCTTGTAGAGCCTCA-39
RpL4-F 59-CAACAAGAGGGGTTCACGAT-39 149 99
RpL4-R 59-GCACGATCAGTTCGGGTATC-39
12. Wilson TG, Ashok M (1998) Insecticide resistance resulting from an absence of target-site gene product. Proc Natl Acad Sci U S A 95: 14040–14044. 13. Baumann A, Fujiwara Y, Wilson TG (2010) Evolutionary divergence of the
paralogs Methoprene tolerant (Met) and germ cell expressed (gce) within the genus Drosophila. J Insect Physiol 56: 1445–1455.
14. Konopova B, Jindra M (2007) Juvenile hormone resistance gene Methoprene-tolerant controls entry into metamorphosis in the beetleTribolium castaneum. Proc Natl Acad Sci U S A 104: 10488–10493.
15. Iwema T, Billas IM, Beck Y, Bonneton F, Nierengarten H, et al. (2007) Structural and functional characterization of a novel type of ligand-independent RXR-USP receptor. EMBO J 26: 3770–3782.
16. Konopova B, Jindra M (2008) Broad-Complex acts downstream of Met in juvenile hormone signaling to coordinate primitive holometabolan metamor-phosis. Development 135: 559–568.
17. Minakuchi C, Zhou X, Riddiford LM (2008) Kruppel homolog 1 (Kr-h1) mediates juvenile hormone action during metamorphosis of Drosophila melanogaster. Mech Dev 125: 91–105.
18. Parthasarathy R, Tan A, Bai H, Palli SR (2008) Transcription factor broad suppresses precocious development of adult structures during larval-pupal metamorphosis in the red flour beetle, Tribolium castaneum. Mech Dev 125: 299–313.
19. Suzuki Y, Truman JW, Riddiford LM (2008) The role of Broad in the development of Tribolium castaneum: implications for the evolution of the holometabolous insect pupa. Development 135: 569–577.
20. Minakuchi C, Nimiki T, Shinoda T (2009) Kruppel homolog 1, an early juvenile hormone-response gene downstream of Methoprene-tolerant, mediates its anti-metamorphic action in the red flour beetleTribolium castaneum. Dev Biol 325: 341–350.
21. Li M, Mead EA, Zhu J (2011) Heterodimer of two bHLH-PAS proteins mediates juvenile hormone-induced gene expression. Proc Natl Acad Sci U S A 108: 638–643.
22. Zhang Z, Xu J, Sheng Z, Sui Y, Palli SR (2011) Steroid Receptor Co-activator Is Required for Juvenile Hormone Signal Transduction through a bHLH-PAS Transcription Factor, Methoprene Tolerant. J Biol Chem 286: 8437–8447. 23. Dhadialla TS, Carlson GR, Le DP (1998) New insecticides with ecdysteroidal
and juvenile hormone activity. Annu Rev Entomol 43: 545–569.
24. Smagghe G, Dhadialla TS, Lezzi M (2002) Comparative toxicity and ecdysone receptor affinity of non-steroidal ecdysone agonists and 20-hydroxyecdysone in Chironomus tentans. Insect Biochem Mol Biol 32: 187–192.
25. Carlson GR, Dhadialla TS, Hunter R, Jansson RK, Jany CS (2001) The chemical and biological properties of methoxyfenozide, a new insecticidal ecdysteroid agonist. Pest Manag Sci 57: 115–119.
26. Henrick CA, Staal GB, Siddall JB (1973) Alkyl 3,7,11-trimethyl-2,4-dodeca-dienoates, a new class of potent insect growth regulators with juvenile hormone activity. J Agri Food Chem 21: 354–359.
27. Mikitani K (1996) A new nonsteroidal chemical class of ligand for the ecdysteroid receptor 3, 5-di-tert-butyl-4-hydroxy-N-isobutyl-benzamide shows apparent insect molting hormone activities at molecular and cellular levels. Biochem Biophys Res Commun 227: 427–432.
28. Wing KD (1988) RH 5849, a nonsteroidal ecdysone agonist: effects on a Drosophila cell line. Science 241: 467–469.
29. Silhacek DL, Oberlander H, Porcheron P (1990) Action of RH 5849, a non-steroidal ecdysteroid mimic, onPlodia interpunctella(Hubner)in vivoandin vitro. Arch Insect Biochem Physiol 15: 201–212.
30. Quack S, Fretz A, Spindler-Barth M, Spindler KD (1995) Receptor affinities and biological responses of non-steroidal ecdysteroid agonists on the epithelial cell line from Chironomus tentans (Diptera: Chironomidae). Eur J Entomol 92: 341–347.
31. Auzoux-Bordenave S, Solvar M, Queguiner I, Bozzolan F, Mottier V, et al. (2005) Comparative effects of a non-steroidal ecdysone agonist RH-5992 and 20-hydroxyecdysone in a lepidopteran cell line (IAL-PID2). Insect Biochem Mol Biol 35: 1033–1042.
32. Oberlander H, Leach CE, Shaaya E (2000) Juvenile hormone and juvenile hormone mimics inhibit proliferation in a lepidopteran imaginal disc cell line. J Insect Physiol 46: 259–265.
33. Atmann F, Staudacher E, Wilson IB (1999) Insect cells as hosts for the expression of recombinant glycoproteins. Glycoconj J 2: 109–123.
34. Staal GB (1975) Insect growth regulators with juvenile hormone activity. Annu Rev Entomol 20: 417–460.
35. Swevers L, Soin T, Mosallanejad H, Iatrou K, Smagghe G (2008) Ecdysteroid signaling in ecdysteroid-resistant cell lines from the polyphagous noctuid pest
Spodoptera exigua. Insect Biochem Mol Biol 38: 825–833.
36. Decombel L, Tirry L, Smagghe G (2005) Action of 24-epibrassinolide on a cell line of the beet armyworm,Spodoptera exigua. Arch Insect Biochem Physiol 58: 145–156.
37. Stevens B, Alvarez CM, Bohman R, O’Connor JD (1980) An ecdysteroid-induced alteration in the cell cycle of cultured Drosophila cells. Cell 22: 675–682.
38. Mottier V, Siaussat D, Bozzolan F, Auzoux-Bordenave S, Porcheron P, et al. (2004) The 20-hydroxyecdysone-induced cellular arrest in G2 phase is preceded by an inhibition of cyclin expression. Insect Biochem Mol Biol 3: 51–60. 39. Gerenday A, Fallon AM (2004) Ecdysone-induced accumulation of mosquito
cells in the G1 phase of the cell cycle. J Insect Physiol 50: 831–838. 40. The International Silkworm Genome Consortium (2008) The genome of a
lepidopteran model insect, the silkwormBombyx mori. Insect Biochem Mol Biol 38: 1036–1045.
41. Gauhar Z, Sun LV, Hua S, Mason CE, Fuchs F, et al. (2009) Genomic mapping of binding regions for the Ecdysone receptor protein complex. Genome Res 19: 1006–1013.
42. Willis DK, Wang J, Lindholm JR, Orth A, Goodman WG (2010) Microarray analysis of juvenile hormone response inDrosophila melanogasterS2 cells. J Insect Sci 10: 66.
43. Mosallanejad H, Badisco L, Swevers L, Soin T, Knapen D, et al. (2010) Ecdysone signaling and transcript signature in Drosophila cells resistant against methoxyfenozide. J Insect Physiol 56: 1973–1985.
44. Fallon AM, Gerenday A (2010) Ecdysone and the cell cycle: Investigations in a mosquito cell line. J Insect Physiol 56: 1396–1401.
45. Crossin KL, Tai MH, Krushel LA, Mauro VP, Edelman GM (1997) Glucocorticoid receptor pathways are involved in the inhibition of astrocyte proliferation. Proc Natl Acad Sci U S A 94: 2687–2692.
46. Beyenbach KW, Wieczorek H (2006) The V-type H+ATPase: molecular structure and function, physiological roles and regulation. J Exp Biol 209: 577–589.
47. Sumner JP, Dow JA, Earley FG, Klein U, Jager D, et al. (1995) Regulation of plasma membrane V-ATPase activity by dissociation of peripheral subunits. J Biol Chem 270: 5649–5653.
48. Wieczorek H, Grber G, Harvey WR, Huss M, Merzendorfer H, et al. (2000) Structure and regulation of insect plasma membrane H(+)V-ATPase. J Exp Biol 203: 127–135.
49. Holliday LS, Lu M, Lee BS, Nelson RD, Solivan S, et al. (2000) The amino-terminal domain of the B subunit of vacuolar H+-ATPase contains a filamentous actin binding site. J Biol Chem 275: 32331–32337.
50. Vitavska O, Wieczorek H, Merzendorfer H (2003) A novel role for subunit C in mediating binding of the H+-V-ATPase to the actin cytoskeleton. J Biol Chem 278: 18499–18505.
51. Voss M, Vitavska O, Walz B, Wieczorek H, Baumann O (2007) Stimulus-induced phosphorylation of vacuolar H(+)-ATPase by protein kinase A. J Biol Chem 282: 33735–33742.
52. Kane PM (2000) Regulation of V-ATPases by reversible disassembly. FEBS Lett 469: 137–141.
53. Merzendorfer H, Reineke S, Zhao XF, Jacobmeier B, Harvey WR, et al. (2000) The multigene family of the tobacco hornworm V-ATPase: novel subunits a, C, D, H, and putative isoforms. Biochim Biophys Acta 1467: 369–379. 54. Wieczorek H, Beyenbach KW, Huss M, Vitavska O (2009) Vacuolar-type
proton pumps in insect epithelia. J Exp Biol 212: 1611–1619.
55. Graf R, Harvey WR, Wieczorek H (1996) Purification and properties of a cytosolic V1-ATPase. J Biol Chem 271: 20908–20913.
56. Mukherji M, Bell R, Supekove L, Wang Y, Orth AP, et al. (2006) Genome-wide functional analysis of human cell-cycle regulators. Proc Natl Acad Sci U S A 103: 14819–14824.
57. Crissman HA, Mullaney PF, Steinkamp JA (1975) Methods and applications of flow systems for analysis and sorting of mammalian cells. Methods Cell Biol 9: 179–246.
58. Le Goff G, Hilliou F, Siegfried B, Boundy S, Wajnberg E, et al. (2006) Xenobiotic response inDrosophila melanogaster: sex dependence of P450 and GST gene induction. Insect Biochem Mol Biol 36: 674–682.
59. Le Brigand K, Barbry P (2007) Mediante: a web-based microarray data manager. Bioinformatics 23: 1304–1306.
60. Gentleman RC, Carey VJ, Bates DM, Bolstad B, Dettling M, et al. (2004) Bioconductor: open software development for computational biology and bioinformatics. Genome Biol 5: R80.
61. Wettenhall JM, Smyth GK (2004) limmaGUI: a graphical user interface for linear modeling of microarray data. Bioinformatics 20: 3705–3706.
62. Yang YH, Thorne NP (2003) Normalization for two-color cDNA microarray data. In: Goldstein DR, ed. Science and Statistics: A Festschrift for Terry Speed, IMS Lecture Notes - Monograph Series. BeachwoodOH: Institute of Mathematical Statistics. pp 403–418.
63. Smyth GK (2004) Linear models and empirical bayes methods for assessing differential expression in microarray experiments. Stat Appl Genet Mol Biol 3: Article3.
64. Hess A, Iyer H (2007) Fisher’s combined p-value for detecting differentially expressed genes using Affymetrix expression arrays. BMC Genomics 8: 96.