Mixed-Biofilm Studies
Sylvio Redanz., Kerstin Standar., Andreas Podbielski, Bernd Kreikemeyer*
Institute of Medical Microbiology, Virology and Hygiene, University Hospital Rostock, Rostock, Germany
Abstract
Background:Oral polymicrobial interactions and biofilm formation are associated with initiation and progression of caries, gingivitis, and periodontitis. Transcriptome studies of such interactions, allowing a first mechanistic insight, are hampered by current single-species array designs.
Methodology/Principal Findings:In this study we used 385 K NimbleGeneTMtechnology for design and evaluation of an
array covering the full genomes of 5 important physiological-, cariogenic-, and periodontitis-associated microorganisms (Streptococcus sanguinis, Streptococcus mutans, Fusobacterium nucleatum, Aggregatibacter actinomycetemcomitans, and Porphyromonas gingivalis). Array hybridization was done with cDNA from cultures grown for 24 h anaerobically. Single species experiments identified cross-species hybridizing array probes. These probes could be neglected in a mixed-species experimental setting without the need to exclude the whole genes from the analysis. Between 69% and almost 99% of the genomes were actively transcribed under the mono-species planktonic, monolayer, and biofilm conditions. The influence of Streptococcus mitis(not represented on the array) onS. mutans gene transcription was determined as a test for a dual-species mixed biofilm setup. Phenotypically, under the influence ofS. mitisan increase in S. mutansbiofilm mass and a decrease in media pH-value were noticed, thereby confirming previously published data. Employing a stringent cut-off (2-fold, p,0.05), 19 S. mutans transcripts were identified with increased abundance, and 11 with decreased abundance compared to aS. mutansmono-species biofilm. Several of these genes have previously been found differentially regulated under general and acid stress, thereby confirming the value of this array.
Conclusions/Significance:This new array allows transcriptome studies on multi-species oral biofilm interactions. It may become an important asset in future oral biofilm and inhibitor/therapy studies.
Citation:Redanz S, Standar K, Podbielski A, Kreikemeyer B (2011) A Five-Species Transcriptome Array for Oral Mixed-Biofilm Studies. PLoS ONE 6(12): e27827. doi:10.1371/journal.pone.0027827
Editor:Christiane Forestier, Universite´ d’Auvergne Clermont 1, France
ReceivedAugust 11, 2011;AcceptedOctober 26, 2011;PublishedDecember 14, 2011
Copyright:ß2011 Redanz et al. This is an open-access article distributed under the terms of the Creative Commons Attribution License, which permits unrestricted use, distribution, and reproduction in any medium, provided the original author and source are credited.
Funding:This work was supported by the German Federal Ministry of Education and Research (BMBF) grants in the framework of the PathoGenoMic Plus program (FKZ 0313801M) and ERANet PathoGenoMics I program (FKZ 0313936B). The funders had no role in study design, data collection and analysis, decision to publish, or preparation of the manuscript.
Competing Interests:The authors have declared that no competing interests exist.
* E-mail: [email protected]
.These authors contributed equally to this work.
Introduction
The oral cavity is a complex human habitat which is home to more than 750 different bacterial species [1]. Many of these bacteria are considered as members of the physiological flora living in symbiotic or commensal relationship to each other and their host. However, several bacterial species are pathogenic and have been reported as causative agents for oral diseases like caries, gingivitis, and periodontitis [1].
In most niches of the oral cavity physiological and pathogenic species live in large highly structured communities called biofilms [2–4]. Such biofilms develop after adherence of primary colonizing bacteria to inert or chemically conditioned surfaces. During biofilm maturation new bacterial species bind as secondary colonizers on top of the pioneer layers. Structure and integrity of biofilms is secured by production of macromolecular extracellular substances. Depending on the species composition an intense, inter- and intra-species communication occurs in such oral biofilms [5,6]. Oral
microbial biofilms may contain several hundred species and their composition can significantly differ among individuals [7,8].
It is now appreciated that biofilm-involving oral diseases are among the most prevalent diseases worldwide, affecting nearly every human being at some time point during life span [9,10]. Thus, investigation and comprehension of initiation and progres-sion of these diseases, as well as developing novel strategies and therapies to control such biofilm-associated oral diseases is of great scientific interest and importance.
One level of influence in polymicrobial interactions is gene transcription. RT-qPCR and DNA-array design, based on full genome sequences, have boostered studies on expression profiles of oral bacteria. Specifically, single-species investigations employing typical stress forms encountered by the bacteria in their natural habitat were performed [17–19], planktonic versus biofilm bacterial growth was compared, and wild type and mutant strains were analyzed in such comparative transcriptomic approaches [20–22].
However, as the consortium of bacteria in the oral cavity is a multi-species association it would be an advantage and progress to analyze different oral bacteria with one array. Since to the best of our knowledge such a multi-species array was not previously available for transcriptome studies of oral bacteria, we developed a five-species custom array based on NimbleGenH DNA array platform technology. The 385 KTMchip design, allowing a total number of 385.000 gene probes per array, appeared to be a well suited platform to cover several bacterial genomes with up to three replicates per probe on each array. Our novel array design covered the full genomes of the cariogenic speciesStreptococcus mutansUA159, the physiological speciesStreptococcus sanguinis SK36, and the three periodontitis-associated speciesFusobacterium nucleatumDSMZ 25586, Porphyromonas gingivalis W83, and Aggregatibacter actinomycetemcomitans HK1651. The chip contained 10.107 unique probe sets covering 10.186 genes. Most genes were covered by 13 individual probes.
Here we present transcriptome data of single-species cultures and biofilms, which allowed identification of cross-hybridizing single gene probes across the species represented on the array. As an example, the transcriptome ofS. mutansunder the influence of S. mitis was studied in a two-species biofilm. Array results were verified by Real time RT-qPCR.
This array is a powerful tool to investigate and understand the complexity of transcriptional changes in mixed-species biofilms and could be useful to study biofilm interfering substances and their mode of action.
Results
Single-species hybridizations on the five-species arrays allowed identification of cross-hybridizing gene probes In advance of using this novel custom array design for multi-species experiments, it was mandatory to perform hybridizations
with labeled cDNAs from single-species cultures and biofilms. Under the experimental setup described here, onlyS. sanguinisand S. mutansdeveloped biofilm structures. All other tested species grew in the planktonic phase or dense monolayers in the culture flasks. A documentation of biofilm and monolayer formation of the single species is given in Supporting Figure S1.
Hybridization of labeled cDNA from a single species resulted in fluorescence signals which can be presented in three groups: i) the total number of fluorescence signals compared to total number of probes derived from the whole genome, ii) probes reacting with different fluorescence signal intensities, and iii) nonspecifically reacting probes derived from the other bacterial species.
The hybridization of labeled cDNA from 24 h S. sanguinis biofilms resulted in fluorescence signals for 9497 probes, representing 1550 transcriptionally active genes. Thus, 69.1% of the total number of 2244 genes is transcribed under the biofilm growth conditions used in this study. One gene was classified as highly transcribed (6 probes of this gene reached 75–100% of maximal fluorescence signal intensity of the array). Up to now this gene has been described to encode aconserved hypothetical protein. Further, among 38 probes belonging to 14 genes with fluorescence intensities of 50–75% above background signal, we found many chaperones:dnaK(SSA_2007),dnaJ(SSA_2005),grpE(SSA_2008), clpL(SSA_2096), responsible for protein folding and degradation, ftsH(SSA_0015), a Zn metallo-peptidase involved in cell division via sigma 32, adcC(SSA_0136) a putative Zn ABC transporter, andrplN(SSA_0117), a ribosomal protein (Supporting Table S1). Besides, 58 probes were identified to give false positive signals. These probes were derived from 9 genes ofA. actinomycetemcomitans HK1651, 5 genes ofS. mutansUA159, 1 gene ofP. gingivalisW83 and 1 gene ofF. nucleatumATCC 25586. Table 1 summarizes the numbers of probes and designations of corresponding genes, which were found to lead to nonspecific signals after single species hybridization of all bacterial species presented on the chip. More detailed information on these probes and genes is presented in Supporting Table S2. Figure S1a shows the signal intensities graphically. However, since most genes were covered by up to 13 probes on the array there is only in rare cases a need to fully exclude complete genes from the analysis. For example,S. sanguinis cDNA cross-hybridized with the gene probe AA00182P0047 fromA. actinomycetemcomitansHK1651 (see Supporting Table S2).
Table 1.The number of cross-hybridizing probes.
cross-reaction with:
hybridization with: S. mutans S. sanguinis P. gingivalis F. nucleatum A. actinom.
S. mutans 24210 probes 187 probes 16 probes 11 probes 68 probes
(1927 genes) (1915 genes) (67 genes) (16 genes) (11 genes) (17 genes)
S. sanguinis 14 probes 9497 probes 1 probe 1 probe 42 probes
(2244 genes) (5 genes) (1550 genes) (1 gene) (1 gene) (9 genes)
P. gingivalis 8 probes 12 probes 21355 probes 4 probes 50 probes
(1883 genes) (2 genes) (5 genes) (1771 genes) (4 genes) (13 genes)
F. nucleatum 5 probes 22 probes 3 probes 5223 probes 24 probes
(1964 genes) (4 genes) (15 genes) (3 genes) (1614 genes) (12 genes)
A. actinom. 9 probes 12 probes 8 probes 7 probes 6702 probes
(2168 genes) (3 genes) (5 genes) (3 genes) (4 genes) (1165 genes)
Identification of none-specific hybridizing probes after single hybridization ofS. mutansUA159,S. sanguinisSK36,P. gingivalisW83,F. nucleatumATCC25586 and
A. actinomycetemcomitansHK1651.
The table shows cross-hybridizing probes affecting different numbers of genes (in brackets) after single-species hybridization. Results which refer to the species hybridized on the chip are displayed in bold characters.
Supporting Table S3 revealed that the gene AA00182 is covered by 13 individual gene probes. Thus, 12 non-crossreactive gene probes covering AA00182 are still available for evaluation of differential expression in anA. actinomycetemcomitansHK1651 -S. sanguinismixed-species setting (Table 2).
Chip-hybridization with cDNA from S. mutans UA159 24 h biofilms revealed 99.4% of the genome actively transcribed under the experimental conditions described here. 24.210 probes ofS. mutans UA159, representing 1915 genes from a total number of 1927 genes, were detected. Among the highly abundant transcripts (438 probes covering 167 genes with 75–100% of the maximal fluorescence signal intensity of the array), we identified also chaperones like dnaK (SMU_82), dnaJ (SMU_83), and groEL (SMU_1954). Further, ftsZ (SMU_552), a putative cell division protein, dnaI (SMU_1921), coding for a DNA helicase, pflA(SMU_1692), coding for pyruvat formiat lyase A, and several genes encoding ribosomal proteins like S7 (SMU_358), L27 (SMU_849), S1 (SMU_1200), S11 (SMU_2002) were found (Supporting Table S1). A total of 111 genes from the other species on the chip were found to react nonspecifically (refer to Table 1, Supporting Table S2 and Supporting Figure S2b). Again, with the information from Supporting Table S2 (number and identity of individual cross-hybridizing probes per gene) and the information from Supporting Table S3 (total number of individual probes per gene on the array) the experimentalist can decide if whole genes need to be excluded from two-species analysis.
The hybridization with labeled cDNA of P. gingivalis W83 cultures revealed measurable fluorescence intensities for 21855 probes ofP. gingivalisrepresenting 1771 genes of 1883 genes of this strain (94.1% of the genome). Among them, 208 highly transcribed genes were found, represented by 888 probes with 75–100% of the maximal fluorescence signal intensity of the array. These genes encoded chaperones like dnaK (PG_1208), groES (PG_0521),groEL(PG_0521),clpL(PG_0010),clpX(PG_0417) and several ribosomal proteins, like L27 (PG_0315), S9 (PG_376), L1 (PG_391), and S6 (PG_595) (Supporting Table S1). Only 75 probes originating from 24 genes of the other species reacted nonspecifically (refer to Table 1, Supporting Table S2 and Supporting Figure S2c). Apparently, the designed probe sets forP. gingivalisW83 are highly species -specific.
ForF. nucleatumDSMZ 25586, which grew in dense monolayers after 24 h incubation, 25586 fluorescence signals were obtained for 5223 probes belonging to 1614 of 1964 genes of this species (82.2% of the genome). Only 7 genes, represented by 7 probes, showed very high fluorescence intensities, suggesting only a small number of genes as highly transcribed under the chosen conditions (Supporting Table S1). Among them, we identified genes encoding for a malonyl-CoA transacylase (FN0149), acetyl-CoA acetyltrans-ferase (FN0495), a alkyl hydroperoxide reductase (FN1983) and alsoftsZ(FN1451) involved in cell division. Further, 12 genes ofA. actinomycetemcomitans HK1651, 15 genes of S. sanguinis SK36, 4 genes ofS. mutansUA159 and 3 genes ofP. gingivalisW83 displayed nonspecific reactivities (refer to Table 1, Supporting Table S2 and Supporting Figure S2d).
Hybridization ofA. actinomycetemcomitanslabeled cDNA resulted in fluorescence signals for 6702 probes ofA. actinomycetemcomitans, representing 1165 of 2138 genes of this species. Particularly, 8 genes, represented by 54 probes, were found to be highly transcribed (75–100% of the maximal fluorescence signal intensity of the array). Except forccmB (AA00059), a gene encoding for a heme exporter protein, all other genes have unknown or hypothetical functions (Supporting Table S1). 36 probes led to nonspecific signals potentially affecting the analysis of 15 genes of the other species presented on the chip (refer to Table 1, Supporting Table S2 and Supporting Figure S2e).
Taking into account the relatively low number of nonspecific cross-species hybridization signals identified in this series of experiments, the initial sequence analysis and algorithms for probe design proved to be of high quality. In only 3 cases, all probes derived from one gene showed nonspecific signals and thus, would require the exclusion of these genes from further analysis in the respective two-species setting (listed in Table 2). After performing these corrections, the combination of cDNAs from two or more species of the array should lead to truly positive signals in all possible combinations.
Differential transcriptome ofS. mutans in a dual-species biofilm withS. mitis
After testing the array performance in single-species transcrip-tome studies we next analyzed a dual-species model. A previous
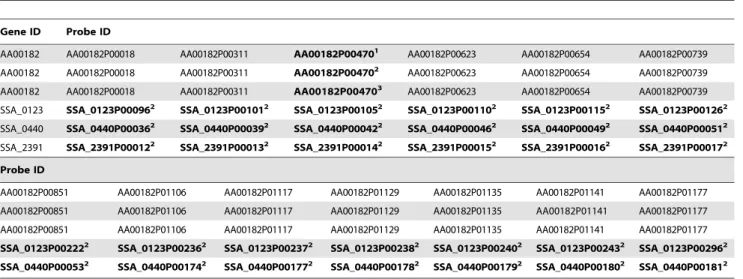
Table 2.Exemplary genes including cross-hybridizing probes.
Gene ID Probe ID
AA00182 AA00182P00018 AA00182P00311 AA00182P004701 AA00182P00623 AA00182P00654 AA00182P00739
AA00182 AA00182P00018 AA00182P00311 AA00182P004702 AA00182P00623 AA00182P00654 AA00182P00739
AA00182 AA00182P00018 AA00182P00311 AA00182P004703 AA00182P00623 AA00182P00654 AA00182P00739
SSA_0123 SSA_0123P000962 SSA_0123P001012 SSA_0123P001052 SSA_0123P001102 SSA_0123P001152 SSA_0123P001262
SSA_0440 SSA_0440P000362 SSA_0440P000392 SSA_0440P000422 SSA_0440P000462 SSA_0440P000492 SSA_0440P000512
SSA_2391 SSA_2391P000122 SSA_2391P000132 SSA_2391P000142 SSA_2391P000152 SSA_2391P000162 SSA_2391P000172
Probe ID
AA00182P00851 AA00182P01106 AA00182P01117 AA00182P01129 AA00182P01135 AA00182P01141 AA00182P01177
AA00182P00851 AA00182P01106 AA00182P01117 AA00182P01129 AA00182P01135 AA00182P01141 AA00182P01177
AA00182P00851 AA00182P01106 AA00182P01117 AA00182P01129 AA00182P01135 AA00182P01141 AA00182P01177
SSA_0123P002222 SSA_0123P002362 SSA_0123P002372 SSA_0123P002382 SSA_0123P002402 SSA_0123P002432 SSA_0123P002962
SSA_0440P000532 SSA_0440P001742 SSA_0440P001772 SSA_0440P001782 SSA_0440P001792 SSA_0440P001802 SSA_0440P001812
Exemplary genes and their probes represented on the described array. Cross-hybridizing probes are indicated by bold characters. Footnotes indicate probes which were positive after hybridization with cDNA fromP.gingivalis(1),
S. mutans(2) and
study from our lab has documented that the cariogenic speciesS. mutans grows to significantly increased biofilm mass in a dual culture with the physiological species S. mitis over a five day investigation period [23]. At the time of array design no fullS. mitis genome sequence was available, thus this species is not covered by the array. However, the taxonomic relationship between both species could interfere with the suitability of any array to analyze the specific transcriptome of the two species. Thus, with the next series of experiments we addressed several issues: i) was the design of the present array suitable to discriminate the transcriptomes of two closely related species, ii) could this issue be tackled in absence of the genome sequence of one species, and iii) would the array hybridization experiments render results which could explain the observed behavior ofS. mutansmixed-species biofilms? Therefore, we first tested potential cross-reactions ofS. mitiscDNA with the 5 species genome array by exclusively usingS. mitiscDNA. In this assay, 311 S. mutans probes displayed nonspecific reactions (Supporting Table S4). These nonspecifically reacting probes, but not the whole genes, were excluded from the data analysis of theS. mutans/S. mitissingle-species/co-culture experiments.
Under the chosen conditions,S. mutans was able to form large biofilm masses already after 24 hours of incubation. The combination of S. mutanswith S. mitisresulted in larger biofilm masses than obtained for the S. mutans mono-species culture. Culture supernatant pH-values of the combination were lower than for theS. mutansmono-species culture (4.96 versus 5.8 after 24 hours) but numbers of colony forming units ofS. mutanswere unchanged within the boundaries of experimental error over a five day co-culture period withS. mitis[23]. In contrast,S. mitiscould be detected via different microscopic techniques, but no colony forming units were found.
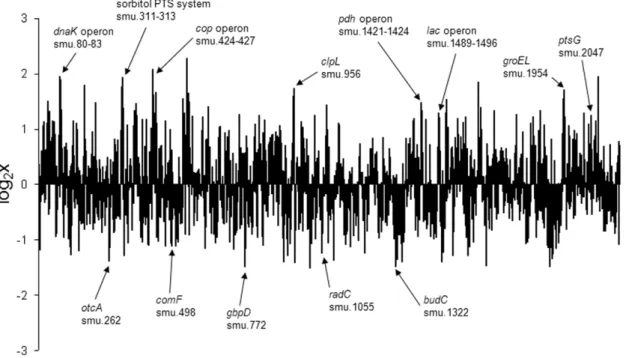
After deletion of all nonspecifically reacting probes from further analysis, theS. mutanstranscriptome after co-culture withS. mitis showed a significantly different transcript abundance for 30 genes (fold change two, p,0.05) (19 were found up-regulated, 11 were down-regulated) compared to theS. mutansmono-species biofilm transcriptome. Using the Internet platform KEGG (Kyoto Encyclopedia of Genes and Genomes, http://www.genome.jp/ kegg/), we found that the majority of these differentially regulated genes were involved in metabolism and environmental informa-tion processing (membrane transport) (Table 3). Of note, the stress response operondnaK(smu_80-83) and thecop-operon (SMU_424-smu_427), as well as groEL (SMU_1954) and clpL (SMU_956), which have been described to be involved in stress response, showed high transcript abundances (Figure 1). Moreover, the agmatine deiminase gene cluster [24] (SMU_262-264) was found downregulated.
The microarray data have been deposited in the Gene Expression Omnibus (GEO) database under accession number GSE28841.
Confirmation of transcriptome results by Real Time RT-qPCR
As an independent second method we used RT-qPCR for validation of the observed transcriptome data. A variety of genes showing high or low transcript abundances in transcriptome analysis were chosen for further analysis with cDNA from a new series of biologically independent experiments. Precisely, 7 up-regulated and 6 down-up-regulated genes were selected. The gene SMU_2015 was used as control as it showed no change of expression (p.0.95) in the array experiments.
Table 4 shows the results of RT-qPCR as well as the comparison to the data of transcriptome analysis. In general, RT-qPCR confirmed the results of transcriptome experiments.
Discussion
Oral microbial diseases are based on qualitative and quantita-tive dysbalances of the physiological and pathogenic microbial flora and thus are polymicrobial by nature. Comparability of currentin vitroinvestigations on microbial gene expression during health and diseased status is limited due to usage of diverse experimental setups. Differences include environmental conditions as well as static or flow through culture systems. The informative value of bacterial transcriptome studies is restricted in most cases due to the single-species DNA array setups. To overcome some of these shortcomings we here describe the setup and use of a 5-species transcriptome array for the study of both single- and multi-species cultures and biofilms. Only a minority between 0.35% (in case ofP. ginivalis) and up to 1.15% (in case ofS. mutans) of probes displayed unspecific hybridization results. Due to the high redundancy of probes per gene, these unspecific probes could be excluded from further analysis while the gene could still be included in the analysis in all but 3 cases.
In a first series of experiments, we simultaneously identified unspecific probes on the array and measured gene expression of early single-species planktonic cultures, monolayers and biofilms. Corresponding to the status of young biofilms, transcriptome analysis from the contained cells demonstrated the presence of transcripts of the vast majority of genes, especially such encoding all chaperones and ribosomal proteins, for example dnaK (SSA_2007; SMU_0082; PG_1208; AA000657) inS. sanguinis, S. mutans, P. gingivalis or A. actinomycetemcomitans, clpL (SSA_2096; PG_0010) inS. sanguinis and P. gingivalis, or a member of the fts operon, involved in cell division (SSA_0015; SMU_552; FN1451) inS. sanguinis,S. mutansandF. nucleatum. The ubiquitous presence of chaperone transcripts could be an indicator for general or acidic stress in these cultures [17,25–27].
A complete S. mitisgenome sequence was not available at the time of the array design, therefore the corresponding probes were not included. However, it was of special interest whether the array could still be used for a two-species analysis with a species represented on the chip and another that was not included. Again, specificity testing with S. mitis cDNA demonstrated cross hybridization of only a fewS. mutansprobes, allowing the inclusion of all S. mutans genes in the final analysis. The two-species combination was phenotypically described previously under growth conditions which supported planktonic growth of both species, but biofilm formation only forS. mutans[23]. The glucose-free growth medium CDM/sucrose is a prerequisite to mimick cariogenic biofilms with thick extracellular polysaccharides [28]. Under such virulent cariogenic conditions previous studies have shown suppression of S. sanguinis growth in co-culture with S. mutans[29].
that several genes encoding stress proteins of S. mutans were upregulated under the co-cultivation conditions. Earlier studies indicated an association between expression of S. mutans stress proteins at a lower pH-value. For instance, acid stress/shock induced transcription of the molecular chaperonsdnaKandgroEL [25,27], which agreed with our findings in transcriptome and RT-qPCR analysis. Both proteins play essential roles in cellular metabolism by assisting in the folding of newly synthesized or denatured proteins, as well as in the assembly, transport, and
degradation of cellular proteins [30]. Furthermore, HrcA, the repressor of class I heat shock gene expression and encoded by the first gene of the dnaK operon of S. mutans (hrcA-grpE-dnaK) negatively regulates the dnaK and thegroE operon [27]. In the present study thehrcAgene transcript was decreased (p = 0.058), consistent with the increased presence of the groEanddnaKoperon transcripts.
Also theclp– system was shown to play an important role in acid tolerance [17,26]. The genome ofS. mutansUA159 encodes
Table 3.Summary of the differential transcript abundances after transcriptome analysis.
Class/Gene ID Gene name/Description Fold changea
Direction of regulation
Metabolism
SMU_1140c conserved hypothetical protein 2.11 down
SMU_1322 budC - putative acetoin dehydrogenase 2.78 down
SMU_1421 pdhC - putative dihydrolipoamide acetyltransferase, E2 component 2.78 up
SMU_1422 pdhB - putative pyruvate dehydrogenase E1 component subunit beta 2.32 up
SMU_1424 pdhD - putative dihydrolipoamide dehydrogenase 2.54 up
SMU_1493 lacD - tagatose-1,6-bisphosphate aldolase 2.47 up
SMU_262 otcA/aguB – putative putrescine carbamoyltransferase 2.07 down
SMU_264 aguA – agmatine deiminase 2.6 down
SMU_318 putative hippurate hydrolase 2.62 up
SMU_85 thiD - putative phosphomethylpyrimidine kinase 2.55 up
Environmental Information Processing
SMU_1934c putative cobalt ABC transporter, ATP-binding protein 2.07 down
Metabolism, Environmental Information Processing
SMU_2047 ptsG - putative PTS system, glucose-specific IIABC component 2.13 up
SMU_311 PTS system, sorbitol (glucitol) phosphotransferase enzyme IIC2 3.41 up
SMU_312 PTS system, sorbitol phosphotransferase enzyme IIBC 2.93 up
SMU_313 putative PTS system, sorbitol-specific enzyme IIA 3.86 up
Genetic information processing
SMU_1055 radC - putative DNA repair protein RadC 2.35 down
SMU_387 putative glycoprotein endopeptidase 2.06 down
SMU_424 copY - negative transcriptional regulator, CopY 4.25 up
SMU_427 copZ - putative copper chaperone 3.74 up
SMU_772 gbpD - glucan-binding protein D with lipase activity; BglB-like protein 2.8 down
Genetic information processing, Environmental Information Processing
SMU_498 comF - putative late competence protein 2.16 down
SMU_81 grpE - heat shock protein GrpE (HSP-70 cofactor) 2.97 up
Others
SMU_314 hypothetical protein 3.58 up
SMU_36 conserved hypothetical protein 2.84 up
SMU_428 conserved hypothetical protein 3.09 up
SMU_497c conserved hypothetical protein 2.08 down
SMU_52 conserved hypothetical protein 2.21 up
SMU_560c conserved hypothetical protein 2.5 up
SMU_916c conserved hypothetical protein 2.64 down
SMU_982 bglB2 - putative BglB fragment 2.19 up
Displayed are differentially regulated genes ofS. mutansafter co-cultivation withS. mitisin biofilm structures compared to theS. mutansmono-species biofilm. Clustering was performed with the help of KEGG (Kyoto Encyclopedia of Genes and Genomes, http://www.genome.jp/kegg/).
orthologs of five Clp ATPases (ClpB, ClpC, ClpE, ClpL, and ClpX), and a single ClpP peptidase [17,31]. A clpL knock-out mutant ofS. mutansdisplayed a raised sensitivity against acid killing [26]. Other studies could demonstrate that a ClpL homologue interacts with the HSP70 system, which includes DnaK and DnaJ to form a chaperone complex [32]. Therefore, one could speculate
that ClpL plays an important role in acid stress tolerance. Here we could measure increasedclpLtranscript abundance in the presence of a low pH in theS. mitis/S. mutansco-cultures.
In good agreement with previous studies onS. mutansacid stress behavior [33], our study of the S. mitis/S. mutans co-culture revealed the upregulation ofcopYandcopZ. In addition, thecopYAZ
Table 4.Verification of array results by RT-qPCR analysis of selected genes.
Gene ID Gene name/Description
Fold change
of RT-PCRa Fold change oftranscriptome analysisb
upregulated genes
SMU_81 grpE; heat shock protein GrpE (HSP-70 cofactor) 2.04 (0.51) 2.96 (p,0.05)
SMU_312 PTS system, sorbitol phosphotransferase enzyme IIBC 6.12 (1.25) 2.92 (p,0.05)
SMU_426 copA; copper-transporting ATPase; P-type ATPase 3.25 (0.83) 3.31 (p = 0.072)
SMU_956 clpL; putative Clp-like ATP-dependent protease, ATP-binding subunit 5.11 (3.3) 3.87 (p = 0.069)
SMU_1495 lacB; galactose-6-phosphate isomerase, subunit LacB 2.09 (0.52) 2.03 (p = 0.15)
SMU_1954 groEL; putative chaperonin GroEL 2.15 (0.83) 2.33 (p = 0.075)
SMU_2047 ptsG; putative PTS system, glucose-specific IIABC component 3.88 (2.79) 2.13 (p,0.05)
downregulated genes
SMU_262 otcA; putative ornithine carbamoyltransferase 22.39 (1.55) 22.07 (p,0.05)
SMU_498 comF; putative late competence protein 22.03 (0.93) 22.16 (p,0.05)
SMU_772 gbpD; glucan-binding protein D with lipase activity; BglB-like protein 23.06 (0.06) 22.8 (p,0.05)
SMU_1055 radC; putative DNA repair protein RadC 21.64 (0.45) 22.35 (p,0.05)
SMU_1340 bacA2; putative surfactin synthetase 23.36 (0.39) 21.87 (p = 0.054)
SMU_1934c putative cobalt ABC transporter, ATP-binding protein 21.99 (0.48) 22.07 (p,0.05)
Data are from three biological replicates.
aAverage n-fold change in expression for three biological and three technical replicates, each. Values in parentheses are standard deviations. bn-fold change after expression array analysis of three biological replicates. Significance is indicated by p-values in parentheses.
doi:10.1371/journal.pone.0027827.t004
Figure 1. Overview of transcript level changes ofS. mutansin co-culture withS. mitiscompared to its single-species culture.Shown are the fold changes of allS. mutansgenes represented on the array averaged from three independent replicates. Marked are up- or down- regulated genes and operons with a fold change of.2 including one or more genes significantly up- or down-regulated (p,0.05) exceptclpL(p = 0.069) and groEL(p = 0.075).
operon was shown to be required for a specific copper tolerance [34] and for biofilm detachment, a late stage of the biofilm developmental process.CopZ– defective cells displayed decreased biofilm detachment [35]. Therefore, the presently observed increased biofilm thickness could be another consequence of the raisedcopYAZtranscript abundance uponS. mutansexposure toS. mitiscells.
Of note, previous studies have identified the agmatine deiminase system of S. mutans upregulated under increased pH and general stress [24]. Although an decreased pH was measured and an increase in general stress was assumed in the S. mitis/S. mutans co-culture, the agmatine deiminase system was found downregulated in our study. If this is specifically due to the presence ofS. mitisneeds to be determined in future studies.
Since cross-feeding and metabolic cooperation are also appreciated mechanisms acting in biofilms [5,6], it is possible that end products ofS. mitiscan be used byS. mutansto enhance biofilm growth. This could also explain the higher biofilm masses in two-species culture. Possibly, S. mitis produces alternative carbohydrates forS. mutansmetabolism. The upregulation of the sorbitol/mannitol – specific PTS (SMU_308 – SMU_314) and the major lactose transporter (SMU_1491 and SMU_1492), which was observed in this study, was earlier described as specific sugar inducible by the presence of sorbitol/manitol and lactose/ galactose. ptsG encoding for a putative glucose-specific PTS IIABC component, which was also more abundant in our study, was shown to be induced by several mono-, di- or tri-saccharides. However, all these sugar uptake systems are only upregulated in the presence of their substrate [36]. S. mitismay influence their upregulation by the production of these substrates thereby allowing increases in biofilm mass production byS. mutans.
Another explanation for the increased biofilm masses could be the activity of theS. mutansglucosyltransferases. Although none of the gtf genes revealed a differential transcript abundance in the mixed culture, a previous study has documented their critical role in increased exopolysaccharide production and biofilm formation inS. mutansmixed-cultures withS. oralisandA. naeslundii[37]. Of note, also these authors showed a dominance ofS. mutansin the mixed-species setting.
In the present study gbpD message decreased with increasing biofilm mass. Recently, GbpD was found to be unique to the Streptococcus mutans group. This protein binds to dextrane and additionally, releases fatty acids from triglycerides. Therefore, it was suggested a lipid-linked surface carbohydrate could be its natural substrate and its function could be the release of fatty acids from lipoteichoic acid [38]. Also GbpD was demonstrated to be important for single-species biofilm formation. A gbpD mutant formed a thinner biofilm [39], which is in contrast to the present findings. This discrepancy could be due to agbpDdownregulation as a consequence of a looser mixed-species biofilm structure allowing better fluid circulation and therefore higher bacterial growth rates. However, this needs to be evaluated in a future study.
Comparing different technologies to generate results like described in this study one can conclude that DNA arrays still have a cost benefit compared to deep sequencing RNAseq technologies like Illumina and Ion Torrent platforms. For most small laboratories the latter techniques are only available on an outsource basis, whereas array hybridization can be performed in many labs and array scanners are available in most departments. One major advantage of the array described here is its potential feasibility to investigatein vivoplaque samples in a clinical setting. This is currently studied in our group and includes evaluation of the minimum RNA concentration needed to get meaningful results after array hybridization.
In summary, we have developed a 5-species transcriptome array based on NimbleGenTM385 K array technology. We showed that the chosen array setup can reliably detect the transcript abundance of whole genomes in single-species experiments. The obtained results uncovered genes which are actively transcribed under the defined environmental and culture conditions. Addi-tionally, none specifically hybridizing probes were identified. They can be excluded from further analysis in multi-species investiga-tions based on the individual specificity parameters and require-ments of the researcher, however, in most cases without losing the whole gene for the analysis. To our best knowledge, so far there is no array available for multi-species transcriptome analysis. Therefore, the newly designed chip could be a powerful tool to simultaneously investigate the transcriptome of more than one species from the oral environment.
Materials and Methods
Bacterial strains and culture conditions
The bacterial strainsStreptococcus mitisATCC 11843,Streptococcus mutans UA159, S. sanguinis SK36,F. nucleatum ATCC 25586, P. gingivalisW83 andA. actinomycetemcomitansHK1651 were purchased from commercial providers (DSMZ, Braunschweig, Germany and ATCC, Manassas, USA).
Streptococcus mitis ATCC 11843, Streptococcus mutansUA159, S. sanguinisSK36 andA. actinomycetemcomitansHK1651 were cultured in brain heart infusion medium (BHI; Oxoid) at 37uC under a 5% CO2–20% O2 atmosphere. F. nucleatum ATCC 25586 and P.
gingivalisW83 were cultivated in BHI supplemented with 0.25% glutamate or 5mg/ml hemin and 50 mM galactose, respectively, at 37uC under a 10% CO2– 10% H2– 80% N2atmosphere.
Setup of adherent cell cultures and biofilms
Bacteria were grown in BHI to stationary phase, washed with phosphate buffered saline (PBS, pH 7.4), and adjusted to a strain specific OD600to obtain 1610‘8 cells ml‘-1. Subsequently, each
bacterial suspension was diluted 10-fold in a chemical defined medium (CDM) supplemented with 50 mM sucrose (S. mutans,S. sanguinis,A. actinomycetemcomitans) or in artificial saliva supplemented with 50 mM galactose (P. gingivalisandF. nucleatum) and inoculated in 75 cm2 CELLSTARH tissue culture flasks (greiner bio-one, Frickenhausen, Germany). The bacteria were cultivated alone to establish species-dependent mono-species cultures and biofilms or in combination resulting in two-species biofilms. All cultures were grown in an anaerobic incubator under an appropriate atmo-sphere (80% N2, 10% CO2, 10% H2) at 37uC for one day under
static conditions. The incubator atmosphere was saturated with water vapor to prevent exsiccation of the cultures and it was constantly exposed to a platinum catalyst to decrease the content of short-chained fatty acids in the atmosphere. Monolayer formation and biofilm growth was determined as described previously [23].
RNA preparation from whole biofilm samples, cDNA synthesis, labeling and hybridization
form thick biofilms (S. sanguinis,S. mutans) under the chosen assay conditions, liquid medium was removed and biofilms were gently washed with PBS. Biofilms were detached from the surface by thorough scraping and washing with PBS. The biofilm suspension was centrifuged and the obtained pellet was used immediately or frozen at280uC until further use.
RNA preparation was carried out from 100 mg cell material with the Fast RNAHPro Blue Kit (MP Biomedicals, Solon, Ohio) following manufacturers instructions. To exclude DNA contam-inations, the isolated and purified RNA was digested with DNase I for 1 hour at 37uC. Subsequently, the RNA was controlled for DNA contaminations by 16S rDNA PCR. Absence of amplified PCR products was confirmed by agarose gel electrophoresis. The RNA concentration was determined with the Picodrop photom-eter (Biozym, Oldendorf, Germany).
cDNA synthesis and labeling was done with the superscript II cDNA-Synthesis-Kit according to the manufacturer’s instructions (Invitrogen, Karlsruhe, Germany). A total amount of 10mg RNA was used for cDNA synthesis.
The labeling of the cDNA was done like recommended by the Nimble Chip Arrays User’s Guide (Gene Expression Analysis v 2.0). Hybridization of custom 385 K microarray slides with the prepared cDNA was carried out at 42uC overnight using a MAUI Hybridization System following the manusfacturer’s instructions (BioMicroSystems, Salt Lake City, UT, USA). A stringent washing protocol of the arrays was performed following the instructions of the Nimble Chip Arrays User’s Guide (Gene Expression Analysis v 2.0). The microarrays were stored dry and in the dark until the arrays were scanned.
Chip specifications
The probe sets covering the 5 different bacterial genomes were designed by NimbleGen according to the company’s protocols and algorithms, and all probes were manufactured directly onto the slides via photolithographic synthesis of 60 mer oligonucleotidesH. The array probe sets are based on the following whole genome sequences deposited at NCBI:F. nucleatumATCC 25586 (NCBI, full genome, accession no. AE009951) with 1964 genes,P. gingivalis W83 (NCBI, full genome, accession no. AE015924) with 1883 genes, S. sanguinis SK36 (NCBI, full genome, accession no. CP000387) with 2244 genes, S. mutans UA159 (NCBI, full genome, accession no. AE014133) with 1927 genes, and A. actinomycetemcomitans HK1651 (full genome available at: http:// www.oralgen.lanl.gov/oralgen/downloads) with 2168 genes.
For every gene sequence up to 13 individual probes were designed to cover the gene sequence of interest (for detailed information refer to Supporting Tables S3, S5 and S6), resulting in 10.107 unique probe sets covering 10.186 genes. Each probe was synthesized in three replicates located in different array regions. This setup guaranteed maximum reproducibility of the hybrid-ization process and fluorescence signals. In some cases the NimbleGene algorithms were unable to design adequate probes for certain genes. The genes not covered by the current design are listed in Supporting Table S7.
Additionally, there were 3510 random probes arbitrarily distributed on the chip, which served as negative controls. This entire setup allowed the identification of unspecific reactions without the need to exclude whole genes from the analysis in most cases. The decision if genes with cross-hybridizing probes are eliminated from the investigation could be based on the ratio of nonspecifically reacting probes in relation to the total number of probes for that particular gene. For this study here, we decided to exclude all S. mutansprobes which cross-hybridized after S. mitis
chip hybridization, but not whole genes from the analysis of theS. mitis/S. mutanstwo-species combination.
Scanning and quality control of the microarrays and hybridization result interpretation
Scanning of microarrays and subsequent feature extraction was done with the DNA Microarray Scanner from Agilent (Agilent Technologies, Waldbronn, Germany, resolution: 5mm) and NimbleScanTM software (version 2.4, NimbleGen, Madison, USA), respectively.
Each probe had to pass several criteria of quality control before entering the analysis tool GeneSpring GX (version 11.0, Agilent Technologies, Waldbronn, Germany). These criteria comprised:
i) Identification of probe replicates influenced by wash artifacts: All *.pair data files resulting from scanning and feature extraction were analyzed for inhomogeneous replicates of every probe. Replicates with more than a two-fold aberration from the intensity of the other two replicates of this probe were excluded from analysis. In case of more than a two-fold aberration over all three replicates of a single probe, all replicates of this probe were deleted.
ii) Detection of unspecific inter-species cross-reactions: After using cDNAs from all species arranged on the chip for single-species hybridizations, all probes of the other single-species were checked for their potential hybridization signals. In case of a signal intensity exceeding that of the mean of all random probes on this array by a factor of two, these probes were designated as nonspecifically inter-species cross-reacting (for illustration please refer to supporting Figure S2a–e). iii) Elimination of results from nonspecifically inter-species
cross-reacting probes: When using the cDNAs from the two-species combinationS. mutansandS. mitis, cDNA from the latter was checked for cross-hybridization with probes of S. mutans UA159 present on the chip. Employing the criteria from above, a probe was declared as false positive when the derived signal intensity after hybridization withS. mitiscDNA was more than two-fold higher than the mean of all random probes on this array, i. e. the negative control. Again, these nonspecific positive probes were excluded from analysis when comparing theS. mutanssingle-species transcriptome with the S. mutanstranscriptome after co-culture withS. mitis.
Normalization and background correction was done by RMA [Robust Multi-Array Analysis, [40,41]] with the NimbleScan Software summarizing all probes per gene resulting in single values per gene. The so obtained *.calls data files were analyzed with GeneSpring GX (version 11.0, Agilent Technologies).
All genes of a species, which passed the quality control inspection criteria, were finally grouped into 4 different categories of transcript abundance related to the maximal fluorescence signal intensity of the array (refer to supporting Table S1).
RT-qPCR
dimer formation. RNA used for cDNA synthesis was controlled for DNA contamination as described earlier in this methods section. cDNA synthesis was done with the superscript II cDNA-synthesis-kit from Invitrogen accordant to manufacturer’s instructions.
The RT-qPCR reaction mixture (25ml) contained 16 MAX-IMA Sybr Green Master Mix (Fermentas), 6.5ml cDNA sample and 1 mM of the appropriate forward and reverse PCR primers (Table S3). RT-qPCR reactions were done in 96 well optical reaction plates with the ABI PRISMH7000 Sequence Detection System (Applied Biosysthems). Conditions of RT-qPCR were as follows: 2 min 50uC, 10 min 95uC, 15 sec 95uC, 1 min 60uC. The last two steps were repeated 40 times.
Each assay was performed with at least three biologically independent RNA samples in technical duplicates.
The critical threshold cycle (Ct) was defined as the cycle in
which fluorescence becomes detectable above the background fluorescence and is inversely proportional to the logarithm of the initial number of template molecules. Relative quantification was performed with the comparative Ct method, also known as the
22[delta][delta]Ct
method. Ct values for the genes of interest were
normalized to the gene SMU_2015.
Reproducibility and statistics
Each experiment was performed on at least 3 independent occasions (biological replicates) with 2 or 3 replicates each (technical replicates). Statistical parameters (mean, median, standard deviation, p-values) were determined employing the Windows Excel program, and GenSpringGX. P-values less than 0.05 were considered as significant.
Accession number
The raw data and meta information on the experiments have been deposited in the Gene Expression Omnibus database (GEO; www.ncbi.nlm.nih.gov/geo/) and received the accession number GSE28841.
Supporting Information
Figure S1 Documentation of biofilm and monolayer formation of single-species cultures ofA. actinomycetemcomitans; F. nucleatum,P. gingivalis,S. sanguinis, andS. mutans.
(PDF)
Figure S2 Histogram of array fluorescence intensities. (PDF)
Table S1 Graduated fluorescence intensities of genes passing the quality control criteria.
(XLS)
Table S2 Data set of crosshybridizing probes and the corre-sponding genes.
(XLS)
Table S3 All genes represented on the array, including their appropriate probe number.
(XLS)
Table S4 All probes and their corresponding genes which were found as biological false positives after hybridization with RNA of S. mitis.
(XLS)
Table S5 All genes represented on the array, with less than 13 probes.
(XLS)
Table S6 Genes, which share probes with other genes. (XLS)
Table S7 All genes for which NimbleGen algorhithms were not able to identify adequate probes.
(XLS)
Table S8 Data set of RT-PCR primer. (PDF)
Acknowledgments
The authors would like to thank Jana Normann for assistance in RT-qPCR.
Author Contributions
Conceived and designed the experiments: AP BK. Performed the experiments: SR KS. Analyzed the data: SR KS BK. Wrote the paper: SR BK AP KS.
References
1. Jenkinson HF, Lamont RJ (2005) Oral microbial communities in sickness and in health. Trends Microbiol 13: 589–595.
2. Kolenbrander PE, Palmer RJ, Jr., Periasamy S, Jakubovics NS (2010) Oral multispecies biofilm development and the key role of cell-cell distance. Nat Rev Microbiol 8: 471–480.
3. Marsh PD, Moter A, Devine DA (2011) Dental plaque biofilms: communities, conflict and control. Periodontol 2000 55: 16–35.
4. Spratt DA, Pratten J (2003) Biofilms and the Oral Cavity. Reviews in Environmental Science and Biotechnology 2: 109–120.
5. Kuramitsu HK, He X, Lux R, Anderson MH, Shi W (2007) Interspecies interactions within oral microbial communities. Microbiol Mol Biol Rev 71: 653–670. 6. Kolenbrander PE, Andersen RN, Blehert DS, Egland PG, Foster JS, et al. (2002)
Communication among oral bacteria. Microbiol Mol Biol Rev 66: 486–505. table.
7. Haffajee AD, Socransky SS (2006) Introduction to microbial aspects of periodontal biofilm communities, development and treatment. Periodontol 2000 42: 7–12.
8. Mager DL, Ximenez-Fyvie LA, Haffajee AD, Socransky SS (2003) Distribution of selected bacterial species on intraoral surfaces. J Clin Periodontol 30: 644–654. 9. Albandar JM, Rams TE (2002) Global epidemiology of periodontal diseases: an
overview. Periodontol 2000 29: 7–10.
10. Beikler T, Flemmig TF (2011) Oral biofilm-associated diseases: trends and implications for quality of life, systemic health and expenditures. Periodontol 2000 55: 87–103.
11. Kolenbrander PE, Andersen RN (1989) Inhibition of coaggregation between Fusobacterium nucleatum and Porphyromonas (Bacteroides) gingivalis by lactose and related sugars. Infect Immun 57: 3204–3209.
12. Lamont RJ, El-Sabaeny A, Park Y, Cook GS, Costerton JW, et al. (2002) Role of the Streptococcus gordonii SspB protein in the development of Porphyromonas gingivalis biofilms on streptococcal substrates. Microbiology 148: 1627–1636. 13. Loo CY, Corliss DA, Ganeshkumar N (2000) Streptococcus gordonii biofilm
formation: identification of genes that code for biofilm phenotypes. J Bacteriol 182: 1374–1382.
14. Maeda K, Nagata H, Nonaka A, Kataoka K, Tanaka M, et al. (2004) Oral streptococcal glyceraldehyde-3-phosphate dehydrogenase mediates interaction with Porphyromonas gingivalis fimbriae. Microbes Infect 6: 1163–1170. 15. Molin S, Tolker-Nielsen T (2003) Gene transfer occurs with enhanced efficiency
in biofilms and induces enhanced stabilisation of the biofilm structure. Curr Opin Biotechnol 14: 255–261.
16. O’toole GA, Gibbs KA, Hager PW, Phibbs PV, Jr., et al. (2000) The global carbon metabolism regulator Crc is a component of a signal transduction pathway required for biofilm development by Pseudomonas aeruginosa. J Bacteriol 182: 425–431.
17. Lemos JA, Abranches J, Burne RA (2005) Responses of cariogenic streptococci to environmental stresses. Curr Issues Mol Biol 7: 95–107.
18. Paramonova E, Kalmykowa OJ, van der Mei HC, Busscher HJ, Sharma PK (2009) Impact of hydrodynamics on oral biofilm strength. J Dent Res 88: 922–926.
19. Zanin IC, Lobo MM, Rodrigues LK, Pimenta LA, Hofling JF, et al. (2006) Photosensitization of in vitro biofilms by toluidine blue O combined with a light-emitting diode. Eur J Oral Sci 114: 64–69.
21. Shemesh M, Tam A, Steinberg D (2007) Differential gene expression profiling of Streptococcus mutans cultured under biofilm and planktonic conditions. Microbiology 153: 1307–1317.
22. Wen ZT, Nguyen AH, Bitoun JP, Abranches J, Baker HV, et al. (2011) Transcriptome analysis of LuxS-deficient Streptococcus mutans grown in biofilms. Mol Oral Microbiol 26: 2–18.
23. Standar K, Kreikemeyer B, Redanz S, Munter WL, Laue M, et al. (2010) Setup of an in vitro test system for basic studies on biofilm behavior of mixed-species cultures with dental and periodontal pathogens. PLoS One 5.
24. Griswold AR, Chen YY, Burne RA (2004) Analysis of an agmatine deiminase gene cluster in Streptococcus mutans UA159. J Bacteriol 186: 1902–1904. 25. Jayaraman GC, Penders JE, Burne RA (1997) Transcriptional analysis of the
Streptococcus mutans hrcA, grpE and dnaK genes and regulation of expression in response to heat shock and environmental acidification. Mol Microbiol 25: 329–341.
26. Kajfasz JK, Martinez AR, Rivera-Ramos I, Abranches J, Koo H, et al. (2009) Role of Clp proteins in expression of virulence properties of Streptococcus mutans. J Bacteriol 191: 2060–2068.
27. Lemos JA, Chen YY, Burne RA (2001) Genetic and physiologic analysis of the groE operon and role of the HrcA repressor in stress gene regulation and acid tolerance in Streptococcus mutans. J Bacteriol 183: 6074–6084.
28. Paes Leme AF, Koo H, Bellato CM, Bedi G, Cury JA (2006) The role of sucrose in cariogenic dental biofilm formation–new insight. J Dent Res 85: 878–887. 85/ 10/878 [pii].
29. De Stoppelaar JD, Van HJ, Backer DO (1970) The effect of carbohydrate restriction on the presence of Streptococcus mutans, Streptococcus sanguis and iodophilic polysaccharide-producing bacteria in human dental plaque. Caries Res 4: 114–123.
30. Bukau B, Horwich AL (1998) The Hsp70 and Hsp60 chaperone machines. Cell 92: 351–366.
31. Ajdic D, McShan WM, McLaughlin RE, Savic G, Chang J, et al. (2002) Genome sequence of Streptococcus mutans UA159, a cariogenic dental pathogen. Proc Natl Acad Sci U S A 99: 14434–14439.
32. Glover JR, Lindquist S (1998) Hsp104, Hsp70, and Hsp40: a novel chaperone system that rescues previously aggregated proteins. Cell 94: 73–82.
33. Gong Y, Tian XL, Sutherland T, Sisson G, Mai J, et al. (2009) Global transcriptional analysis of acid-inducible genes in Streptococcus mutans: multiple two-component systems involved in acid adaptation. Microbiology 155: 3322–3332.
34. Vats N, Lee SF (2001) Characterization of a copper-transport operon, copYAZ, from Streptococcus mutans. Microbiology 147: 653–662.
35. Mitrakul K, Loo CY, Hughes CV, Ganeshkumar N (2004) Role of a Streptococcus gordonii copper-transport operon, copYAZ, in biofilm detach-ment. Oral Microbiol Immunol 19: 395–402.
36. Ajdic D, Pham VT (2007) Global transcriptional analysis of Streptococcus mutans sugar transporters using microarrays. J Bacteriol 189: 5049–5059. 37. Koo H, Xiao J, Klein MI, Jeon JG (2010) Exopolysaccharides produced by
Streptococcus mutans glucosyltransferases modulate the establishment of microcolonies within multispecies biofilms. J Bacteriol 192: 3024–3032. JB.01649-09 [pii];10.1128/JB.01649-09 [doi].
38. Shah DS, Russell RR (2004) A novel glucan-binding protein with lipase activity from the oral pathogen Streptococcus mutans. Microbiology 150: 1947–1956. 39. Lynch DJ, Fountain TL, Mazurkiewicz JE, Banas JA (2007) Glucan-binding
proteins are essential for shaping Streptococcus mutans biofilm architecture. FEMS Microbiol Lett 268: 158–165.
40. Irizarry RA, Bolstad BM, Collin F, Cope LM, Hobbs B, et al. (2003) Summaries of Affymetrix GeneChip probe level data. Nucleic Acids Res 31: e15. 41. Irizarry RA, Hobbs B, Collin F, Beazer-Barclay YD, Antonellis KJ, et al. (2003)