Non-Enzymatic Depurination of Nucleic
Acids: Factors and Mechanisms
Ran An, Yu Jia, Baihui Wan, Yanfang Zhang, Ping Dong, Jing Li, Xingguo Liang*
College of Food Science and Engineering, Ocean University of China, Qingdao, 266003, China
*liangxg@ouc.edu.cn
Abstract
Depurination has attracted considerable attention since a long time for it is closely related to the damage and repair of nucleic acids. In the present study, depurination using a pool of 30-nt short DNA pieces with various sequences at diverse pH values was analyzed by High Performance Liquid Chromatography (HPLC). Kinetic analysis results showed that non-enzymatic depurination of oligodeoxynucleotides exhibited typical first-order kinetics, and its temperature dependence obeyed Arrhenius’ law very well. Our results also clearly showed that the linear relationship between the logarithms of rate constants and pH values had a salient point around pH 2.5. Interestingly and unexpectedly, depurination depended greatly on the DNA sequences. The depurination of poly (dA) was found to be extremely slow, and thymine rich sequences depurinated faster than other sequences. These results could be explained to some extent by the protonation of nucleotide bases.
Moreover, two equations were obtained based on our data for predicting the rate of depurination under various conditions. These results provide basic data for gene mutagenesis and nucleic acids metabolism in acidic gastric juice and some acidic organelles, and may also help to rectify some misconceptions about depurination.
Introduction
Depurination, the release of purine bases from nucleic acids by the hydrolysis of N-glycosidic bonds, has aroused considerable interest for a long time because of its close relationship with mutation and repair of nucleic acids. At apurinic sites caused by depurination, the covalent structure of DNA becomes more susceptible to damage, which induces spontaneous mutagenesis, carcinogenesis and cellular aging [1–8]. It has been estimated that approximately 2,000–10,000 DNA purine bases are released in each human cell every day due to hydrolytic depurination [9,10]. In addition, Zhanget al.recently found that nucleic acids in food could be
OPEN ACCESS
Citation:An R, Jia Y, Wan B, Zhang Y, Dong P, et al. (2014) Non-Enzymatic Depurination of Nucleic Acids: Factors and Mechanisms. PLoS ONE 9(12): e115950. doi:10.1371/journal.pone. 0115950
Editor:Sukesh R. Bhaumik, Southern Illinois University School of Medicine, United States of America
Received:July 2, 2014
Accepted:November 27, 2014
Published:December 29, 2014
Copyright:ß2014 An et al. This is an
open-access article distributed under the terms of the
Creative Commons Attribution License, which permits unrestricted use, distribution, and repro-duction in any medium, provided the original author and source are credited.
Data Availability:The authors confirm that all data underlying the findings are fully available without restriction. All relevant data are within the paper and its Supporting Information files.
Funding:This work was supported by ‘‘Fund for Distinguished Young Scholars’’ of Shandong province [JQ201204], Program for Changjiang Scholars and Innovative Research Team in University [IRT1188], and ‘‘National Youth Qianren Plan.’’ Funding for open access charge: ‘‘Fund for Distinguished Young Scholars’’ of Shandong province [JQ201204];http://www.sdnsf.gov.cn/ portal/. XL is the author who received the funding. The funders had no role in study design, data collection and analysis, decision to publish, or preparation of the manuscript.
absorbed by alimentary systems and they regulated the expression of target genes in mammals [11]. On the other hand, efficient depurination of nucleic acids may occur in acidic gastric juice and some acidic organelles (such as lysosomes), which then shows effects on digestion and assimilation of nucleic acids [12]. Until now, very few studies have analyzed the details of the digestion of nucleic acids in the stomach.
Although depurination has been investigated for decades, there are still some unsolved controversies. For example, the depurination of mononucleotides and short oligonucleotides has been shown to be first-order reactions [13–15], but long calf thymus DNA depurinated quite slowly for the first several hours, deviating from the first-order profile [16]. Different opinions were also raised on whether there was a simple linear relationship between pH and the logarithm of depurination rate constants [17–20]. In addition, it is still not clear whether depurination depends on sequences, although some reports have claimed that
depurination was not markedly dependent on DNA sequences [10,14]. These
inconsistent results may be caused by data lacking accuracy and reliability due to some imprecise separating and detecting methods, such as dialysis and thin-layer chromatography. Furthermore, because the published data are scattered and sometimes incomprehensive, it is difficult to predict the degree of depurination under certain conditions.
In this study, we designed and used a pool of 30-nt-long short oligodeox-ynucleotides (ODNs) with various sequences for depurination and provided some answers to the above controversies by systematically investigating factors of depurination including pH, salts and secondary structure (duplex or single stranded). The effect of DNA sequences on depurination was also studied for the first time. In addition, prediction of depurination degree under various
conditions was realized based on two equations we obtained.
Materials and Methods
Materials
All ODNs used in this study were ordered from Integrated DNA Technologies, Inc. (Coralville, IA, USA) and dissolved in sterile Milli-Q water to 100 mM for
stock. M13mp18 single-stranded DNA (M13 ssDNA, 250 mg/mL), M13mp18 RF I
DNA (M13 dsDNA, 100 mg/mL) and Lambda DNA (300 mg/mL) were purchased
from New England Biolabs, Inc. (Beverly, MA, USA). Salmon sperm DNA
(Sigma-Aldrich, WI, USA) was dissolved in sterile Milli-Q water to 300 mg/mL
and used as the substrate for depurination. Nucleotide bases, including adenine, guanine, thymine, cytosine and uracil (Sigma-Aldrich, WI, USA) were used as the standard substances for HPLC analysis. They were dissolved in sterile Milli-Q water to 200 mg/mL, respectively, and diluted to the final concentration of 20 mg/
Melting temperature (
T
m) measurementThe melting curve of M13 dsDNA at pH 5.1 was obtained by measuring the change in absorbance at 260 nm versus temperature with a UV-1800 spectro-photometer equipped with a temperature-controlling device (Shimadzu Co., Kyoto, Japan) under the following conditions: 50 mM phosphate sodium buffer
(pH 5.1) and 12 mg/mL M13 dsDNA. To minimize the depurination of M13
dsDNA at pH 5.1 during the Tmmeasurement, only the heating curve was
measured. The temperature ramp was 1.0
˚
C/min.Depurination of nucleic acids
In the experiments, DNA substrates for depurination (to the final concentration
of 10 mM of ODNs, 25mg/mL of M13 ssDNA, M13 dsDNA, Salmon sperm DNA
or Lambda DNA during depurination) and uracil, serving as the internal standard (to the final concentration of 37.5 mM), were added to the following buffers:
aqueous solution of 50 mM sodium phosphate with various pH from 0.5 to 7.1 or
acidic solutions (pH 1.4 or pH 5.9) of NaCl (521000 mM) or MgCl2
(12100 mM). Depurination was performed at a constant temperature on
TC-5000 thermal cycler (Techne, Staffordshire, UK). To terminate the reaction, the pH values of aliquots were adjusted to 7.0–8.0 by NaOH solution in various concentrations.
HPLC analysis of reaction products
A 230II type of HPLC system (Elite, Dalian, China) and YMC C18 column
(25064.6 mm, 5mm; YMC, Kyoto, Japan) were used for depurination analysis.
The following HPLC conditions were used to separate free purines: a linear gradient from 4% to 14% (20 min) acetonitrile in the water containing 50 mM
ammonium formate; a flow rate of 0.5 mL/min; detection at 260 nm; and 10 mL
of loaded reaction solution.
For precise quantification, uracil was used as the internal standard. Release of
purines in each experiment under strong conditions (pH 1.6 and 100
˚
C for 1 h;Results
Depurination of a pool of 30-nt-long ODNs with various sequences
Considering that natural long-chain DNA tends to form sediments at low pH and is difficult to be analyzed on a HPLC system directly, we used a pool of 30-nt-long ODNs with various sequences (N30) to describe the general features of non-enzymatic depurination. Theoretically, there are approximately 1018 types of 30-nt-long sequences in the pool, which were synthesized on a DNA synthesizer with mixed phosphoramidite monomers (IDT, IA, USA). These sequences can comprehensively represent most genome sequences for depurination, though they are only 30-nt long. Another merit to using this pool is that almost no duplex can form, especially under acidic conditions, because only one 30-nt-long molecule for each sequence is present. The dynamic analysis becomes more accurate without the effect of sequence variation and the difference in depurination between double-stranded (dsDNA) and single-stranded DNA (ssDNA) can also be minimized.The products of depurination from N30 were completely separated and quantitatively analyzed by HPLC using uracil as the internal standard (Figure S1). Each depurination experiment was performed 3 times, and the error was further minimized by using the complete depurination samples (at pH 1.6, 100
˚
C for 1 h) as the reference of the total amounts of purines for calculating the percentage of depurination.At first, we checked the time courses of depurination from N30 under various pH values. As shown in Figure 1a, the initial rates of the depurination reactions remained constant, and the time courses obeyed the model of first-order kinetics perfectly. Thus, the rate constants (k) could be obtained from the above time courses. We also checked the depurination from DNA in various concentrations
from 0.5 mM to 50 mM and found that the rate constants were independent of
DNA concentration, which was also consistent with the first-order kinetics (data not shown). It was reported that an abnormal slowness was observed during the first several hours of depurination of long calf thymus DNA (Figure 1b), which was different from our results [16].
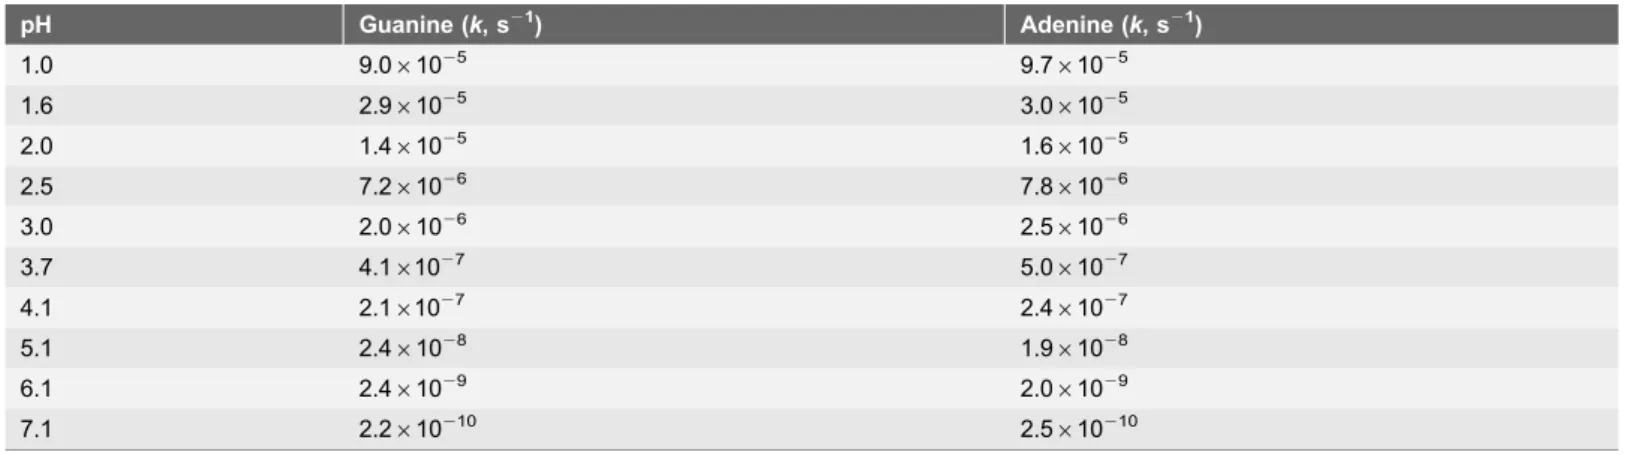
The rate constants of depurination measured at various pH values are shown in
Table 1. Certainly, depurination depended greatly on the reaction temperature and was much faster under lower pH conditions. For pH values above 5.0, detection of depurination at 37
˚
C became difficult due to the extremely low speed.After incubation at 37
˚
C for 33 d, N30 released 5.8%, 0.6% and 0.1% purines atpH 5.1, pH 6.1 and pH 7.1, respectively (Figure S2). The difference in
depurination between adenine and guanine was not obvious, and only a change of
3–25% was observed (Table 1).
Factors for depurination
and uncertainties about some of these factors. For clarifying these questions and realizing the prediction of depurination under various conditions, we checked all these factors in detail.
Effect of pH on depurination
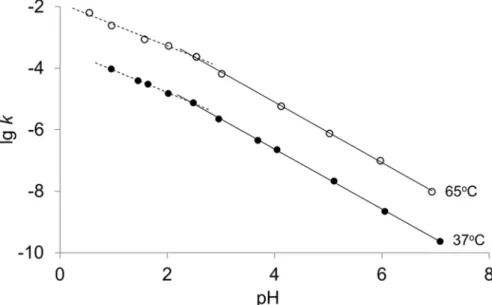
To solve the controversy about pH dependence of depurination, especially about whether the pH profile is a straight line [17–20], we checked carefully the rate constants of N30 at a wide range of pH from 0.5 to 7.1. As concluded previously, the depurination rates of adenine and guanine were very close and so the average
depurination rates of adenine and guanine were used here. As shown inFigure 2,
the logarithm of depurination rate constants (lg k) basically showed a linear relationship with pH at either 37
˚
C or 65˚
C. Interestingly, our results clearly showed that there was an inflection point at a pH of approximately 2.5 for both reaction temperatures. At 37˚
C, for example, the absolute value of the slope below pH 2.5 was obtained as 0.721, whereas it increased to 0.975 above pH 2.5, Fig. 1. Time courses of non-enzymatic depurination.(a) Quantitative analysis of purines released from N30 at 37˚C. (N) pH 1.6; (m) pH 2.0; (#) pH 2.5;( ) pH 3.0. Reaction buffers for depurination contained 50 mM sodium phosphate. Samples were prepared by collecting aliquots of the solution in each time period. The percentages of depurination were obtained by averaging the percentages of the release of adenine and guanine. The plot shows the average of three individual experiments. (b) Depurination of calf thymus DNA at 37˚C and pH 1.6 reported by Tammet al. [16]. (#) Adenine; (N) Guanine.
doi:10.1371/journal.pone.0115950.g001
Table 1.Rate constants (k, s21) of depurination from N30 at 37
˚C.
pH Guanine (k, s21) Adenine (
k, s21)
1.0 9.061025 9.761025
1.6 2.961025 3.061025
2.0 1.461025 1.661025
2.5 7.261026 7.861026
3.0 2.061026 2.561026
3.7 4.161027 5.061027
4.1 2.161027 2.461027
5.1 2.461028 1.961028
6.1 2.461029 2.061029
7.1 2.2610210 2.5610210
indicating that the effect of pH on depurination was weakened at a pH lower than 2.5.
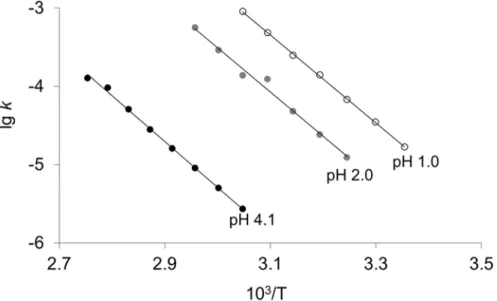
Effect of reaction temperature on depurination
Reaction temperature may not only affect the depurination reaction itself but also may affect the secondary structure of DNA, especially at a higher pH. Considering
that the dynamics of depurination at pH,2.5 were different from those at
pH.2.5, the effect of temperature was investigated at pH 1.0, pH 2.0 and pH 4.1.
As shown in Figure 3, the temperature dependence of depurination obeyed
Arrhenius’ law very well. The activation energies (Ea) and frequency factors (Ar)
were obtained from the slopes and intercepts. In terms of the activation energy, little difference was observed for depurination reactions at pH 1.0 (Ea5107.5 kJ/
mol)), pH 2.0 (Ea5108.2 kJ/mol) and pH 4.1 (Ea5112.0 kJ/mol). On the other
hand, the value of the frequency factor at pH 1.0 (Ar51.261014) was 4.3-fold
larger than that at pH 2.0, and 63-fold larger than that at pH 4.1, indicating that the observed distinction in depurination rates between different pH values was mainly caused by the difference in the frequency factors.
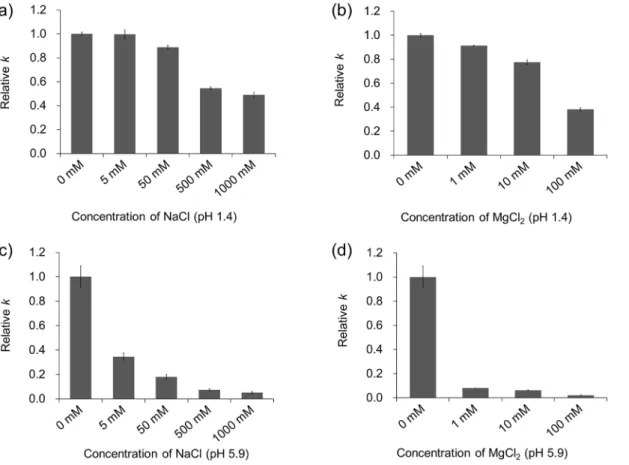
Effect of salts on depurination
Salts may affect depurination rates due to their neutralization of negative charges on phosphate groups. In addition, considering that salts intake can change the salt concentration in gastric juice, figuring out the salt effect is of great significance on depurination both in vivoand in vitro. Figure 4shows the effect of salt
concentration on the rate of depurination. For all the conditions used in our study, depurination was suppressed by salts to different degrees, and the Fig. 2. Plots of rate constants (k, s21) for the depurination of N30 as a function of pH.(
N) 37˚C, the slopes
are20.721 at pH 1.022.5 and20.975 at pH 2.527.1; (#) 65˚C, the slopes are20.694 at pH 0.522.5 and 20.983 at pH 2.527.1.
suppression degrees of salts were affected significantly by pH values. In the case of pH 1.4, for example, the rate constant (k) for 50 mM NaCl decreased by 10%
compared to that for 5 mM NaCl (Figure 4a). When N30 was incubated at
pH 5.9 (Figure 4c), depurination for 5 mM NaCl was found to be twice as fast as that for 50 mM NaCl, indicating that the suppression ability of salts on
depurination rose dramatically with the increase in pH values. The same
phenomenon was observed for the solution of MgCl2. In addition, compared with
depurination in the solution of NaCl and MgCl2at pH 5.9 (Figs. 4c and 4d), the suppression effect of 1 mM Mg2+ was basically similar to that of 500 mM Na+.
Therefore, the inhibition of Mg2+on depurination was much stronger than that of
Na+.
Prediction of depurination rates under various conditions
Summarizing the above results, we can predict the depurination rates under certain conditions. As is shown inequation (1) and (2), the rate constants (k) can be estimated at a given pH and temperature:
pHv2:5,lgk~14:6{0:707 pH{5:63|10
3=T ð1Þ
pH§2:5,lgk~16:5{0:982 pH{5:85|10
3=T ð2Þ
In the equations above, kis in s21 and T is the absolute temperature during depurination. It is worth mentioning that these predicting formulas were obtained when 50 mM sodium phosphate was used as reaction buffer. As the effect of salts is much smaller than that of pH and temperature, the depurination rate of DNA Fig. 3. Arrhenius plot for depurination from N30 at different pH values.Rate constants (k, s21) of depurination were a function of absolute temperature (T). (#) pH 1.0; (N) pH 2.0; (N) pH 4.1.
can be successfully predicted with our formulas as long as the reaction conditions are set.
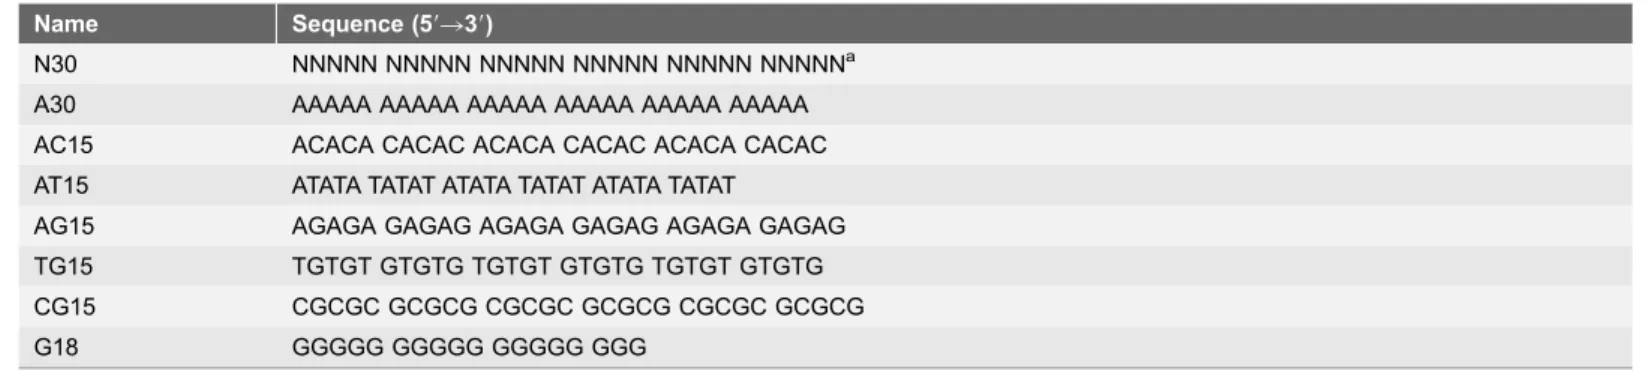
Dependence of depurination rates on sequences
Until now, the effect of DNA sequences on depurination has not been clarified because it is difficult to study this effect with natural DNA. Here, several simple repetitive sequences (Table 2) were used to amplify the sequence effect. The relative half-lives for various sequences, with the half-life of N30 (depurination of adenine) as the reference, are shown in Figure 5. Interestingly, depurination rates changed dramatically with different sequences. In terms of adenine, the order of depurination rates of these sequences at pH 1.6 was
AT15$N30.AG15.AC15.A30, and the order of guanine was
TG15$N30.CG15.AG15$G18. The orders indicated that sequences without
thymine bases depurinated much slower than N30, especially for A30. For sequences with thymine, such as AT15 and GT15, depurination was much faster. At pH 1.6, for example, the half-life of A30 (t1/2597 h) was 16.8-fold longer than Fig. 4. The effect of salts on depurination from N30.(a) Depurination in the NaCl buffer (pH 1.4); (b) Depurination in the MgCl2buffer (pH 1.4); (c) Depurination in the NaCl buffer (pH 5.9); (d) Depurination in the MgCl2buffer (pH 5.9). The pH values of the buffers were adjusted to 1.4 (¡0.1) or 5.9 (¡0.2) with an aqueous solution of HCl. The reaction was performed for 60 min at 37˚C (pH 1.4) or 24 h at 80˚C (pH 5.9) to limit the percentages of depurination less than 20%. In each chart, the depurination rate constant of N30 in the pure HCl buffer was served as the reference.
that of AT15 (Figure 5). The phenomenon that thymine accelerating the
depurination rate could also be observed when trinucleotide repetitive sequences
with 2/3 thymine were used for depurination (Table S1).
More interestingly, the diversity of depurination rates among different
sequences decreased gradually with the rise of pH (Figure 5). In the case of pH 2.5 at 37
˚
C, for example, the half-life of A30 (t1/25230 h) was 11.4 times longer than that of AT15. At pH 5.1 and 80˚
C, however, the difference was only 2.8 times. It is worth pointing out that some researchers reported that depurination was notmarkedly dependent on the DNA sequences [10,14], most likely because their
experiments were carried out at pH values above 5.0. As we described previously, the influence of incubating temperature on the difference among these sequences can be ignored.
Table 2. DNA sequences used for depurination.
Name Sequence (59R39)
N30 NNNNN NNNNN NNNNN NNNNN NNNNN NNNNNa A30 AAAAA AAAAA AAAAA AAAAA AAAAA AAAAA AC15 ACACA CACAC ACACA CACAC ACACA CACAC AT15 ATATA TATAT ATATA TATAT ATATA TATAT
AG15 AGAGA GAGAG AGAGA GAGAG AGAGA GAGAG TG15 TGTGT GTGTG TGTGT GTGTG TGTGT GTGTG CG15 CGCGC GCGCG CGCGC GCGCG CGCGC GCGCG
G18 GGGGG GGGGG GGGGG GGG
aN
5A, T, C or G.
doi:10.1371/journal.pone.0115950.t002
Fig. 5. Difference of various sequences for depurination.( ) Adenine; (%) Guanine. In each reaction condition, the half-lives of N30 (depurination of adenine) were served as the references. The sequences used for depurination are listed inTable 2. The insert is the enlarged view at pH 5.1, 80˚C.
Difference between single-stranded (ssDNA) and double-stranded
DNA (dsDNA)
To determine the difference in depurination rate between dsDNA and ssDNA, DNA from bacteriophage M13mp18 in single-stranded (M13 ssDNA) and double stranded (M13 dsDNA) forms was applied for depurination. The use of M13 ssDNA can ensure almost no duplex forms during depurination, which is better
than using denatured DNA to check the depurination rate of ssDNA [10].
At first, we checked the temperature range for M13 dsDNA to maintain the
duplex form at pH 5.1. From the melting curve we measured (Figure S3), theTm
at pH 5.1 was determined as 82.5
˚
C, and M13 dsDNA could keep the duplex formbelow 70
˚
C. Considering that depurination also decreased the Tmof a DNAduplex, we selected 60
˚
C as the reaction temperature.It is shown clearly in Figure 6a that DNA depurinated slower in the duplex
structure. After incubation for 4 d, M13 ssDNA released 15.3% of purines, while M13 dsDNA only lost 9.9%. The rate constant of M13 ssDNA (k55.761027s21)
was 2.4 times higher than that of double-stranded form.
In addition, other DNA sequences including N30, Lambda and Salmon sperm DNA were also used to confirm the difference between ssDNA and dsDNA (Figure 6b). The rate constants of depurination from N30 (ssDNA) were 2.5 and 1.9 folds larger than that from Salmon sperm DNA and Lambda DNA (dsDNA), respectively.
Discussion
In this study, a pool of 30-nt-long ODNs with various sequences (N30) was used as the substrate for depurination under various conditions. It was reported that some special sequences with a potential to form a stem-loop structure (a 59-G(T/ A)GG-39loop and 59-TNA-39or 59-GNC-39as the first closing base pair) performed self-catalyzed, site-specific depurination, which was 4–5 orders of magnitude faster than the background spontaneous depurination under physiological conditions [21,22]. However, only a tiny percentage of oligomers (,0.006%) are present in the pool of 30-nt-long ODNs, and the influence on our depurination results can be ignored. On the other hand, the sequences for self-catalytic depurination are widely distributed in genomes across the phyla [23]. The presence of these sequences in the substrate of N30 for depurination is beneficial to represent the general feature of the depurination of genome sequences.
Through quantitative analysis of the depurination from N30, several
controversies on depurination were clarified. First of all, as shown in our data, non-enzymatic depurination of ODNs was a typical first-order reaction with a constant initial rate. Tamm et al. reported that the depurination rate of calf thymus DNA was quite slow during the first several hours and became faster subsequently [16]. The possible reason causing this unexpected slowness is the precipitation of long DNA under strong acidic conditions. The rate of
progress of depurination, the precipitation of DNA may have been dissolved gradually, so that the rate of depurination recovered and showed the dynamics of a first-order reaction.
Obviously, it is difficult to observe depurination directly in physiological conditions due to its extremely slow rate. Although some researchers have
concluded that depurination occurred in vivoby measuring depurination at
neutral pH and high temperature above 70
˚
C [10,19], there has been no report on detecting depurination directly at physiological conditions until now. In this study, the depurination rate constant at physiological conditions (pH 7.1, 37˚
C) was obtained for the first time by lengthening the reaction time to several months, and the rate constant (k) of N30 was obtained as 2.4610210s21 at 37˚
C andpH 7.1 (Table 1). The rate constant was 1.561028s21at 70
˚
C and pH 7.4, whichis in agreement with the results obtained by Lindahl et al. (1.661028s21 for
ssDNA) [10].
Regarding the effect of DNA state (ds or ss) on depurination, Lindahlet al.
investigated the depurination of thermal denatured Bacillus subtilisDNA at
pH 7.4 and 70
˚
C to clarify the depurination rate of ssDNA [10]. Their results about the difference between ssDNA and dsDNA (4-fold at pH 7.4) is higher thanour results in Figure 6 (approximately twice at pH 5.1). In our experiments,
several kinds of DNA were applied in depurination and the differences between ssDNA and dsDNA at pH 5.1 were basically similar, indicating that the potential effect of sequences was not the factor causing the lower difference. Therefore, the lower difference between dsDNA and ssDNA in our study is attributed to the low pH value we used. Compared with that under neutral conditions, dsDNA prefers to dissociate under acidic conditions [10], and the dissociation may become more easily once its depurination happens.
Both our data and the reported data showed that depurination of ssDNA were several times faster than that for dsDNA. Compared with the effect of duplex formation on deamination of cytosine (the rate of dsDNA is only 0.5%–0.7% of that of ssDNA) [24], the protection of duplex formation against depurination was Fig. 6. Difference between single-stranded and double-stranded DNA for depurination at pH 5.1, 60˚C.(a) Time courses of depurination of M13 ssDNA and dsDNA. (#) M13 dsDNA; (N) M13 ssDNA. (b) The rate constants (k) of several kinds of DNA including ssDNA (M13 ssDNA and N30) and
dsDNA (M13 dsDNA, Salmon sperm DNA and Lambda DNA).Tmanalysis showed that M13 dsDNA kept duplex form below 70˚C at pH 5.1.
not as conclusive. On the other hand, most genomic DNA in cell nuleuses wraps on histones, rather than in a naked state as we used for depurination. We found that the depurination rate reduced by 95% after adding spermine, a polycation
compound similar as histones (Figure S4). The interaction of sperimine and
histones with DNA may protect it from depurinating, which is the case in vivo.
During replication and transcription, therefore, single-stranded fragments formed in genomic DNA may suffer from higher-frequency depurination, leading to the possibility of mutation.
The current accepted mechanism of acid-catalyzed depurination is illustrated in
Figure 7 [25–29]. Take adenine as an example, the attack of H+at N7 of adenine
leads to the formation of a monoprotonated intermediate, which causes a series of charge redistribution. Then, an oxocarbenium ion and a neutral adenine form after cleavage of the glycosidic bond. The oxocarbenium ion reacts with a H2O molecule, giving a deoxyribose and a neutral adenine as the end products. Under strong acidic conditions, almost all purines are monoprotonated, but the
depurination rates still increased linearly with the decline of pH values (Figure 2), indicating that the presence of double protonation may accelerate depurination
[13]. During the double protonation of adenine, hydrogen ions are prone to
attack purines at N3 [20,28], and the final products are a deoxyribose and a positive charged adenine (Figure 7). It has been reported that protonation on N7 can greatly lower the energetics of the transition state (,10 kcal/mol), while the second protonation on N3 promotes depurination by causing bases to adopt a synperiplanar or strongly chiral structure, rather than dramatically decreasing the transition state energy [30,31]. Accordingly, no large difference between the
activation energy (Ea) of depurination at pH 1.0–2.0 (double protonation) and
that at pH 4.1 (monoprotonation) was observed (Figure 3).
The effects of pH, sequences and salts on depurination can also be explained by
the above mechanism. In terms of pH, the relationship between lgkand pH was
not a simple straight line but a line with a salient point at pH approximately 2.5 (Figure 2). This result was basically in agreement with the results obtained by Hevesi et al. [18], and the salient point in their study was around pH 2. This phenomenon was most likely caused by different protonation styles of bases at pH
below and above pH 2.5. The pKavalues of guanosine monophosphate and
adenosine monophosphate are 2.4 and 3.8 [32], respectively. In the case of low
acid concentration (pH.2.5), only a part of purines were monoprotonated.
Accordingly, with the decrease of pH values, the number of protonated purines increased and the depurination rate grew linearly. Under higher acidities
(pH,2.5), most of the purines and cytosines were monoprotonated or even
In a similar way, the sequence effect on depurination may also be attributed to the protonation of bases. In terms of the repetitive sequences made up of adenine, cytosine and guanine nucleotides, such as A30 and GC15, adenine, cytosine and guanine are prone to be protonated [32] and carry positive charges under acidic conditions. High density of positive charges on these bases may restrain further protonation of adjacent neutral purines, resulting in the slow depurination of these sequences. On the other hand, in the repetitive sequences such as AT15 and
GT15, thymine is unable to be protonated under acidic conditions [32], the
density of positive charges decreases sharply due to the presence of neutral thymine. As a result, in these sequences, low-density positive charges had little influence on the protonation of adjacent purines, and the depurination rates were faster than other repetitive sequences without thymine. In the case of low pH, most of purines and cytosines were protonated resulting in the extreme high density of positive charges, which strongly restrained the depurination rates. However, at a relative high pH value, due to the low extent of protonation, the inhibition effect of positive charged bases on depurination was weakened. Therefore, the dependence of depurination rates on DNA sequences decreased gradually with an increase in pH (Figure 5). Additionally, the stacking of purines may also have effect on depurination rates. However, with a decrease in pH values, the stacking interaction was weakened [33], indicating that the stacking of purines is not the main reason for difference among depurination rates of various sequences.
The suppression of depurination by metal ions (Figure 4) could be explained by
the interaction with the phosphate groups of DNA [34]. Because the negative
charges on phosphate groups are beneficial for depurination by accelerating the protonation of purines, metal cations may neutralize the negative charges and Fig. 7. Protonation mechanism of depurination.Adenine is monoprotonated on N7 under acidic conditions, finally forming a neutral adenine and a deoxyribose as the end products. As the pH lowers, the double protonation process occurs by the attack of excessive H+on N3.
subsequently suppress depurination. This can also be demonstrated by the dependence of depurination from nucleoside derivatives (deoxyadenosine, dAMP,
dADP and dATP) on the concentration of salts at pH 1.4 and 37
˚
C. Salts had nosuppression on the depurination of deoxyadenosine; as the number of phosphate groups on nucleotides increased, salts showed an increasingly suppressive effect on depurination (Figure S5). Although the influence of salts on depurination has been roughly investigated in the past [10,19], the significant dependence of suppression degree of salts on pH values was found for the first time. In the case
of pH 5.9, much higher than the pKaof phosphate groups on DNA (,1.5),
almost all the phosphate groups were ionized and carried negative charges. Therefore metal cations had a strong tendency to interact with them, and showed
significant suppression on depurination (Figs. 4c and 4d). However, under the
condition of pH 1.4, close to the pKaof phosphate groups, over 50% of the
phosphate groups were not ionized. Accordingly, the effect of salt concentration on depurination became insignificant in the case of pH 1.4 (Figs. 4a and 4b).
Based on our results, two equations were obtained to predict the rate constant of depurination. We have estimated 49 rate constants for various types of DNA at various conditions, including M13 ssDNA, and the errors between predicted and experimental data were within 32%, which suggests that our predicting equations can estimate the rates of depurination successfully. Additionally, other factors affecting depurination, such as salts, duplex state and DNA sequence, should also be considered, and the predicted values should be adjusted slightly based on actual conditions and substrates.
In conclusion, non-enzymatic depurination of ODNs obeys a model of typical first-order kinetics. The logarithms of the rate constants (lg k) of depurination increase with a decrease in pH, and show a pseudo linear progression with an infection point at approximately pH 2.5. Besides, salts have strong protection against depurination and the suppression degree of salts depends greatly on pH values. In addition to the external factors, some internal aspects also affect depurination to different degrees. The remarkable effect of DNA sequences on depurination was found for the first time. DNA sequences without thymine are much less reactive than others, and depurination of poly (dA), such as A30 used here, is extremely low, especially at lower pH values. The rate for ssDNA is a little higher than that for dsDNA. Finally, the prediction of depurination under various pH values and temperature was realized by our equations. Our study may be useful to rectify an incorrect understanding of depurination and provides basic data for physiological activities and diseases involving gene mutagenesis, nucleic acid digestion and the possible incentive of cancer.
Supporting Information
phosphate buffer (pH 1.6) for 2 h at 37
˚
C. Peak 1: Cytosine; Peak 2: Uracil; Peak 3: Guanine; Peak 4: Thymine; Peak 5: Adenine; Peak 6: DNA substrates.doi:10.1371/journal.pone.0115950.s001 (DOC)
S2 Fig. Time courses of non-enzymatic depurination. Quantitative analysis of purines released from N30 at 37
˚
C. ( ) pH 5.1; (&) pH 6.1; (N) pH 7.1. The percentages of depurination were the average values of released adenine and guanine. Reaction systems for depurination contained 50 mM sodium phosphate. Samples were prepared by collecting aliquots of the solution in each time period. For each point, three individual experiments were conducted and analyzed separately.doi:10.1371/journal.pone.0115950.s002 (DOC)
S3 Fig. Melting curves of M13mp18 RF I DNA (M13 dsDNA) in 50 mM sodium
phosphate solution (pH 5.1). To minimize the depurination of M13 dsDNA
during the Tmmeasurement at pH 5.1, only the heating curve (from 40
˚
C to98
˚
C) was measured. The temperature ramp was 1.0˚
C/min. Melting temperature(Tm) was obtained as 82.5
˚
C. Accordingly, M13 dsDNA formed duplex well below70
˚
C.doi:10.1371/journal.pone.0115950.s003 (DOC)
S4 Fig. The suppression of spermine on depurination of N30. The rate was
analyzed in 50 mM sodium phosphate buffer (pH 3.0) at 37
˚
C. The molarconcentration of spermine was 75 folds as large as that of N30, i.e. the ratio of amine groups on spermine and phosphate groups on N30 (N/P) was 10:1.
doi:10.1371/journal.pone.0115950.s004 (DOC)
S5 Fig. The effect of salts on depurination from nucleotide derivatives. (a) Depurination in the presence of various concentration of NaCl; (b) Depurination in the presence of various concentration of MgCl2. The substrates of depurination
(to the final concentrate of 10 mM during depurination), including
deoxyade-nosine (dA), deoxyadedeoxyade-nosine monophosphate (dAMP), deoxyadedeoxyade-nosine
dipho-sphate (dADP) and deoxyadenosine triphodipho-sphate (dATP), were incubated at 30
˚
Cfor 45 min to limit the percentages of depurination to be less than 20%. The pH values of the solutions were adjusted to 1.4 (¡0.1) with an aqueous solution of HCl. In each experiment, depurination rate constant in the pure HCl buffer was served as the reference.
doi:10.1371/journal.pone.0115950.s005 (DOC)
S1 Table. Rate constants (1056k, s21) of some trinucleotide repeat sequences
depurinated at pH 1.6 and 37
˚
C.doi:10.1371/journal.pone.0115950.s006 (DOC)
Author Contributions
References
1. Dekker CA(1960) Nucleic Acids Selected Topics Related to their Enzymology and Chemistry. Annu Rev Biochem 29: 453–474.
2. Loeb LA, Preston BD(1986) Mutagenesis by apurinic/apyrimidinic sites. Annu Rev Genet 20: 201–230.
3. Chakravarti D, Mailander PC, Li KM, Higginbotham S, Zhang HL, et al.(2001) Evidence that a burst of DNA depurination in SENCAR mouse skin induces error-prone repair and forms mutations in the H-ras gene. Oncogene 20: 7945–7953.
4. Sherchan J, Choi H, Lee ES(2009) Depurination of nucleosides and calf thymus DNA induced by 2-bromopropane at the physiological condition. Bull Korean Chem Soc 30: 2309–2317.
5. Schaaper RM, Loeb LA(1981) Depurination causes mutations in SOS-induced cells. Proc Natl Acad Sci U S A 78: 1773–1777.
6. Lindahl T, Andersson A (1972) Rate of chain breakage at apurinic sites in double-stranded deoxyribonucleic acid. Biochemistry 11: 3618–3623.
7. Schaaper RM, Glickman BW, Loeb LA (1982) Role of depurination in mutagenesis by chemical carcinogens. Cancer Res 42: 3480–3485.
8. Osborne M, Merrifield K(1985) Depurination of benzo [a] pyrene-diolepoxide treated DNA. Chem Biol Interact 53: 183–195.
9. Lindahl T(1993) Instability and decay of the primary structure of DNA. Nature 362: 709–715.
10. Lindahl T, Nyberg B (1972) Rate of depurination of native deoxyribonucleic acid. Biochemistry 11: 3610–3618.
11. Zhang L, Hou D, Chen X, Li D, Zhu L, et al. (2011) Exogenous plant MIR168a specifically targets mammalian LDLRAP1: evidence of cross-kingdom regulation by microRNA. Cell Res 22: 107–126.
12. Luzio JP, Pryor PR, Bright NA(2007) Lysosomes: fusion and function. Nat Rev Mol Cell Bio 8: 622– 632.
13. Garrett ER, Mehta P (1972) Solvolysis of adenine nucleosides. I. Effects of sugars and adenine substituents on acid solvolyses. J Am Chem Soc 94: 8532–8541.
14. Suzuki T, Ohsumi S, Makino K (1994) Mechanistic studies on depurination and apurinic site chain breakage in oligodeoxyribonucleotides. Nucleic Acids Res 22: 4997–5003.
15. Garrett ER(1960) Kinetics of the hydrolytic degradation of a nucleoside, the antibiotic psicofuranine. J Am Chem Soc 82: 827–832.
16. Tamm C, Hodes M, Chargaff E(1952) The formation of apurinic acid from the desoxyribonucleic acid of calf thymus. J Biol Chem 195: 49–63.
17. Lawley P, Brookes P(1963) Further studies on the alkylation of nucleic acids and their constituent nucleotides. Biochem J 89: 127.
18. Hevesi L, Wolfson-Davidson E, Nagy J, Nagy O, Bruylants A(1972) Contribution to the mechanism of the acid-catalyzed hydrolysis of purine nucleosides. J Am Chem Soc 94: 4715–4720.
19. Greer S, Zamenhof S(1962) Studies on depurination of DNA by heat. J Mol Biol 4: 123–141.
20. Zoltewicz JA, Clark DF, Sharpless TW, Grahe G(1970) Kinetics and mechanism of the acid-catalyzed hydrolysis of some purine nucleosides. J Am Chem Soc 92: 1741–1750.
21. Amosova O, Smith A, Fresco JR(2011) The consensus sequence for self-catalyzed site-specific G residue depurination in DNA. J Biol Chem 286: 36316–36321.
22. Amosova O, Coulter R, Fresco JR(2006) Self-catalyzed site-specific depurination of guanine residues within gene sequences. Proc Natl Acad Sci 103: 4392–4397.
24. Frederico LA, Kunkel TA, Shaw BR(1990) A sensitive genetic assay for the detection of cytosine deamination: determination of rate constants and the activation energy. Biochemistry-us 29: 2532–2537.
25. Hotokka M, Lo¨nnberg H (1996) Hydrolysis of adenosine. A semiempirical and ab initio study. J Mol Struct 363: 191–201.
26. Rios-Font R, Rodrı´guez-Santiago L, Bertran J, Sodupe M(2007) Influence of N7 protonation on the mechanism of the N-glycosidic bond hydrolysis in 29-deoxyguanosine. A theoretical study. J Phys Chem B 111: 6071–6077.
27. Cavalieri E, Saeed M, Zahid M, Cassada D, Snow D, et al.(2012) Mechanism of DNA depurination by carcinogens in relation to cancer initiation. Iubmb Life 64: 169–179.
28. Tsuboi M, Kyogoku Y, Shimanouchi T (1962) Infrared absorption spectra of protonated and deprotonated nucleosides. Biochim Biophys Acta 55: 1–12.
29. Gut IG(1997) Depurination of DNA and matrix-assisted laser desorption/ionization mass spectrometry. Int J Mass Spectrom 169: 313–322.
30. Baik M-H, Friesner RA, Lippard SJ(2002) Theoretical study on the stability of N-glycosyl bonds: why does N7-platination not promote depurination? J Am Chem Soc 124: 4495–4503.
31. Cavalieri E, Vauthier E, Cosse´-Barbi A, Flisza´r S (2000) The glycosyl C192N9 bond of deoxyadenosine and deoxyguanosine: response to electrophilic attacks on the purinic nitrogen atoms. Theor Chem Acc 104: 235–239.
32. Nelson DL, Lehninger AL, Cox MM(2008) Lehninger principles of biochemistry: Macmillan.
33. Neidle S(2010) Principles of nucleic acid structure: Academic Press.