The White-Nose Syndrome Transcriptome:
Activation of Anti-fungal Host Responses in
Wing Tissue of Hibernating Little Brown
Myotis
Kenneth A. Field1*, Joseph S. Johnson1, Thomas M. Lilley1, Sophia M. Reeder1, Elizabeth J. Rogers1, Melissa J. Behr2, DeeAnn M. Reeder1
1Department of Biology, Bucknell University, Lewisburg, Pennsylvania, United States of America,
2Department of Pathobiological Sciences, School of Veterinary Medicine, University of Wisconsin-Madison, Madison, Wisconsin, United States of America
Abstract
White-nose syndrome (WNS) in North American bats is caused by an invasive cutaneous infection by the psychrophilic fungusPseudogymnoascus destructans(Pd). We compared transcriptome-wide changes in gene expression using RNA-Seq on wing skin tissue from hibernating little brown myotis (Myotis lucifugus) with WNS to bats withoutPdexposure. We found that WNS caused significant changes in gene expression in hibernating bats including pathways involved in inflammation, wound healing, and metabolism. Local acute inflammatory responses were initiated by fungal invasion. Gene expression was increased for inflammatory cytokines, including interleukins (IL) IL-1β, 6, 17C, 20, 23A, IL-24, and G-CSF and chemokines, such as Ccl2 and Ccl20. This pattern of gene expression changes demonstrates that WNS is accompanied by an innate anti-fungal host response similar to that caused by cutaneousCandida albicansinfections. However, despite the apparent production of appropriate chemokines, immune cells such as neutrophils and T cells do not appear to be recruited. We observed upregulation of acute inflammatory genes, including prostaglandin G/H synthase 2 (cyclooxygenase-2), that generate eicosanoids and other nociception mediators. We also observed differences inPdgene expression that sug-gest host-pathogen interactions that might determine WNS progression. We identified sev-eral classes of potential virulence factors that are expressed inPdduring WNS, including secreted proteases that may mediate tissue invasion. These results demonstrate that hiber-nation does not prevent a local inflammatory response toPdinfection but that recruitment of leukocytes to the site of infection does not occur. The putative virulence factors may provide novel targets for treatment or prevention of WNS. These observations support a dual role for inflammation during WNS; inflammatory responses provide protection but excessive inflammation may contribute to mortality, either by affecting torpor behavior or causing dam-age upon emergence in the spring.
a11111
OPEN ACCESS
Citation:Field KA, Johnson JS, Lilley TM, Reeder SM, Rogers EJ, Behr MJ, et al. (2015) The White-Nose Syndrome Transcriptome: Activation of Anti-fungal Host Responses in Wing Tissue of Hibernating Little Brown Myotis. PLoS Pathog 11(10): e1005168. doi:10.1371/journal.ppat.1005168
Editor:Bruce S Klein, University of Wisconsin-Madison, UNITED STATES
Received:July 17, 2015
Accepted:August 25, 2015
Published:October 1, 2015
Copyright:© 2015 Field et al. This is an open access article distributed under the terms of the
Creative Commons Attribution License, which permits unrestricted use, distribution, and reproduction in any medium, provided the original author and source are credited.
Data Availability Statement:All RNA-Seq files are available from the SRA database (accession number SRP055976). All metagenome files are available from the MG-RAST database (project 11709).
Author Summary
White-nose syndrome is the most devastating epizootic wildlife disease of mammals in history, having killed millions of hibernating bats in North America since 2007. We have used next-generation RNA sequencing to provide a survey of the gene expression changes that accompany this disease in the skin of bats infected with the causative fungus. We identified possible new mechanisms that may either provide protection or contribute to mortality, including inflammatory immune responses. Contrary to expectations that hibernation represents a period of dormancy, we found that gene expression pathways were responsive to the environment. We also examined which genes were expressed in the pathogen and identified several classes of genes that could contribute to the virulence of this disease. Gene expression changes in the host were associated with local inflammation despite the fact that the bats were hibernating. However, we found that hibernating bats with white-nose syndrome lack some of the responses known to defend other mammals from fungal infection. We propose that bats could be protected from white-nose syndrome if these responses could be established prior to hibernation or if treatments could block the virulence factors expressed by the pathogen.
Introduction
White-nose syndrome (WNS) is an epizootic disease that has killed millions of bats in North America [1,2]. WNS is caused by the psychrophilePseudogymnoascus destructans(Pd) (for-merlyGeomyces destructans), an ascomycete fungal pathogen [3–5] that affects bats during hibernation.Pdgrows at temperatures between 2 and 18°C and can infect bats while they hibernate [4,6].Pdis invasive and damages the cutaneous tissues of bats, including the wing [7], forming characteristic cupping erosions that are diagnostic ofPdinfection [8]. Mortality rates due to WNS vary by species. In the little brown myotis,Myotis lucifugus, the mortality rate is up to 91% in affected caves [9,10] whereas WNS resistance has been reported in the big brown bat,Eptesicus fuscus[11]. Bats in Europe are exposed to endemicPd, but do not exhibit WNS mortality and appear to be resistant to the disease [12], despite cutaneous invasion byPd [13].
Cutaneous infection byPdcauses some species of bats to arouse more frequently from tor-por [5,14,15]. Although hibernating mammals spend less than 1% of their time euthermic [16], they use up to 90% of their stored energy during these periods [17,18]. Because each arousal in little brown myotis utilizes an estimated 108 mg of stored fat [18], the increase in arousal frequency caused by WNS explains 58% of the morbidity rate associated withPd infec-tion [14]. Other factors that are also associated WNS pathology include effects ofPdinfection on the integrity of wing tissue [7,19], electrolyte balance and hydration [7,20,21], chronic respiratory acidosis [22], oxidative stress [23], and immune function [24]. The relative impor-tance of each of these mechanisms in causing death in WNS is not clear, and the most likely model that has emerged is a multi-stage progression of WNS with contributions of several of these factors [22]. Differences in susceptibility to WNS between species in North America may be explained in part by different responses toPdinfection such as changes in thermoregulatory behavior. Understanding host responses toPdinfection may provide insight that could be use-ful for improving survival of affected species.
Cutaneous fungal infections in mammals are first recognized by components of the innate immune system, including C-type lectin receptors and Toll-like receptors [25]. Conserved components of the fungal cell wall activate pattern recognition receptors on phagocytes such as Competing Interests:The authors have declared
neutrophils, macrophages, and dendritic cells, and on epithelial cells [26]. Activation of these cells can lead to induction of the inflammasome, the production of inflammatory cytokines, and generation of reactive oxygen species that can mediate fungal cell killing [25]. The impor-tance of the innate immune response to the initial recognition of fungal infections is demon-strated by the observation that deficiencies in these signaling pathways can lead to chronic fungal infections in humans [27,28]. In the absence of invasion, colonization by commensal fungi can be maintained through tolerance mechanisms mediated by interactions with den-dritic cells and epithelial cells in the skin [29]. Local activation of innate immune pathways can slow the growth of invasive pathogenic fungi and promote tolerance, possibly leading to a com-mensal relationship with the fungus [30], but is not usually sufficient to clear infections. Clear-ance of infections typically requires T helper (Th) cells, as demonstrated by the susceptibility of patients with acquired immune deficiency syndrome, immunosuppressant therapy, or chemo-therapy to fungal infections [31]. These T cell responses can be mediated by Th17 cells [32,33] or, in some cases, Th1 cells [34], with Th2 responses typically associated with greater suscepti-bility [35]. Th17 responses can contribute to clearance of invasive fungal infections through the actions of IL-17A and IL-22 [36] and the further recruitment and activation of neutrophils [37]. These T cell subsets have not been well characterized in bats, but those T-cell mediated immune mechanisms that have been studied appear to be conserved between bats and other mammals [38–41].
Fungal infections in animals are typically life-threatening only upon suppression of adaptive immune responses in the host, such as when chytrid fungus (Batrachochytrium dendrobatidis) blocks lymphocyte-mediated inflammatory responses [42]. Hibernation produces a natural suppression of some immune responses in mammal species where it has been studied. During hibernation, when the conservation of energy is critical, certain immunological mechanisms are downregulated while others remain unaffected [43–51]. Changes during hibernation can include depressed antibody responses [44,52], decreased ability of T and B lymphocytes to proliferate in response to challenge [53,54], and reduced complement activity [47]. Hiberna-tion does not affect all immune responses equally, as shown in thirteen-lined ground squirrels (Ictidomys tridecemlineatus) that have a suppressed T-independent antibody response but are capable of mounting a T cell-dependent response during hibernation [44]. Studies of transcrip-tome-wide changes during hibernation in squirrels [55–59] have shown expression changes in genes involved in metabolism, oxidative stress, protein folding, ischemia/hypoxia, and other processes, but these studies were not examining an active immune response. Hibernation is also known to affect the distribution of leukocytes [45,60] and platelets [61]. However, we have an incomplete understanding of how hibernation affects the suppression, or subsequent recovery, of immune responses [43], or how immune physiology in bats during hibernation may differ from that of rodents.
with innate mechanisms alone may allowPdto proliferate and invade the cutaneous tissues of bats.
The WNS panzootic has created an urgent need to understand if North American bat popu-lations can persist in the presence of the fungal pathogen [1,10]. Understanding the complete array of host responses mounted by bats afflicted with WNS may help illuminate sources of variation in survival within and among bat species. To determine which host responses are activated byPdinfection, we measured transcriptome-wide gene expression levels in bat wing tissue from hibernating bats affected by WNS. Gene expression was compared to bats that were hibernated in captivity in the absence ofPdexposure. We hypothesized thatPdinfection would cause changes in gene expression that would reveal physiological responses during WNS that might be either protective or pathological. By using next-generation RNA sequenc-ing to examine transcriptome-wide gene expression changes we expected to discover consistent patterns of host responses that occur inPd-infected tissues. Combined with changes in gene expression within thePdpathogen, these results have provided a survey of the host and patho-gen interactions occurring during WNS.
Results
Gene Expression Changes Revealed by Next Generation RNA
Sequencing
To determine the host response mounted by little brown myotis toPdduring hibernation, we measured changes in gene expression at the whole transcriptome level. Wing tissue samples were obtained from hibernating little brown myotis with no known exposure toPdand bats exhibiting physical signs of WNS, as shown inTable 1. Histopathology [8] and quantitative PCR (qPCR) forPd[64] were used to confirm the WNS status of each bat (Table 1). Cupping erosions diagnostic of WNS were found on all 6 bats captured in Kentucky, but on none of the 5 bats from states negative for WNS at the time of capture. Low levels of neutrophilic inflam-mation were found in all 11 wing samples (Table 1; Infl), although this inflammation was not associated with sites ofPdinfection. All 6 WNS-affected bats tested positive forPdby qPCR, although the fungal load measured on wing swabs (Table 1; qPCR) did not correlate with the number of cupping erosions found by histology (Table 1; WNS). As previously shown [5,14,
15], WNS-affected bats had significantly lower body condition (Table 1; SMI; p = 0.017, t = 2.9255, df = 9).
Next generation RNA sequencing (RNA-Seq) was performed using poly-A selected RNA isolated from each RNAlater-preserved wing tissue sample (S1 Table). Using expression levels ofPd-derived transcripts, we confirmed that all 6 WNS-affected bats had abundant expression ofPdgenes. ThePd-derived transcripts were not present at significant levels in any of the 5 samples from unaffected bats (S2 Table; p = 2.2x10⁻⁶, t = 21.5, df = 5.33), including the MN090 sample that had tested positive forPdby qPCR in one of the two replicates (Table 1). Because high levels of differential expression ofPdtranscripts would make it more difficult to detect sig-nificant changes in host gene expression, the assembly was filtered [65] to removePd-derived sequences. Comparison of the filtered assembly with the original revealed that removing thePd sequences did not significantly decrease the completeness of the assembly (S3 Table) as deter-mined by BUSCO [66]. This filtered assembly (S1 Dataset) was used to calculate differential expression in host genes between the unaffected and WNS-affected samples.
WNS-Table 1. Samples used for next generation RNA sequencing.
Sample Location Date Captured Date Sampled Sex Mass SMI1 PdLoad by qPCR2 Histology
WNS3 Infl4
MI011 Mine in Dickinson Co, MI 5-Nov-2011 22-Mar-2012 M 6.70 6.69 Negative 0 9
MN064 Mine in Saint Louis Co, MN 16-Nov-2011 22-Mar-2012 F 7.41 7.15 Negative 0 2
MN075 Mine in Saint Louis Co, MN 16-Nov-2011 22-Mar-2012 F 7.47 7.68 Negative 0 50
MN090 Mine in Saint Louis Co, MN 16-Nov-2011 22-Mar-2012 M 7.66 7.51 Neg/Pos? 0 13
IL114 Mine in LaSalle Co, IL 17-Nov-2011 22-Mar-2012 F 7.13 7.40 Negative 0 2
KY06 Cave 1 in Breckinridge Co, KY 12-Mar-2014 12-Mar-2014 F 6.04 6.17 120 000 352 25
KY07 Cave 1 in Breckinridge Co, KY 12-Mar-2014 12-Mar-2014 F 6.90 6.89 13 000 438 57
KY11 Cave 1 in Breckinridge Co, KY 12-Mar-2014 12-Mar-2014 M 5.47 6.12 169 000 288 3
KY19 Cave 2 in Breckinridge Co, KY 12-Mar-2014 12-Mar-2014 M 6.28 6.93 64 000 117 9
KY23 Cave 2 in Breckinridge Co, KY 12-Mar-2014 12-Mar-2014 F 6.58 6.89 21 000 234 10
KY39 Cave in Jackson Co, KY 13-Mar-2014 13-Mar-2014 M 6.28 6.69 120 000 197 10
1Scaled mass index: (mass(in g))*(38.01/(forearm length(in mm))^1.406
2Wing swabs from MI, MN, and IL were measured in duplicate and determined to be positive forPdif the cycle-threshold was less than 40. Samples from
KY were quantified inPdgenomic equivalents relative to swabs spiked with 10 000Pdconidia.
3Cupping erosions characteristic of WNS per roll of wing tissue. 4Foci of neutrophilic inflammation per roll of wing tissue.
doi:10.1371/journal.ppat.1005168.t001
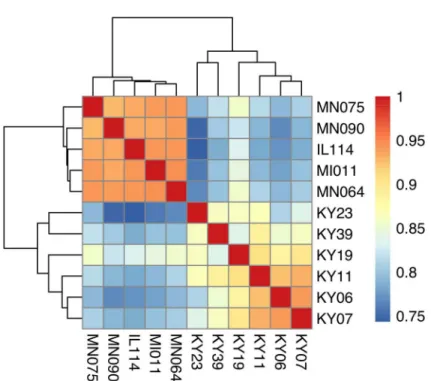
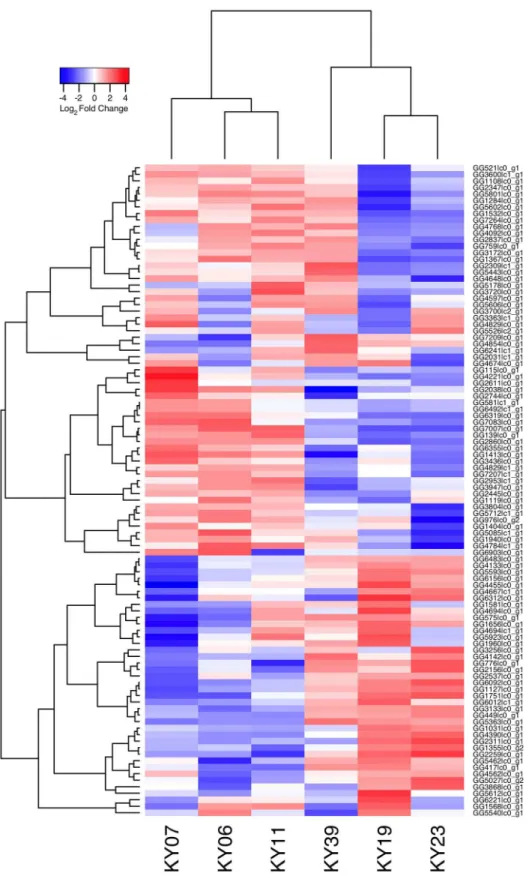
Fig 1. Hierarchical clustering of gene expression in WNS-affected and unaffected bats.Hierarchical clustering of differentially expressed genes using Pearson correlation complete-linkage clustering. Scale shows Pearson correlation coefficient.
affected bat tissues (S4 Table). Hierarchical clustering (Fig 1) revealed that expression of these transcripts from all 5 bats without WNS was similar to each other. Gene expression in wing tis-sue from WNS-affected bats was different from unaffected bats and more similar to each other, as predicted. The normalized expression levels of the 3729 identified transcript clusters differ-entially expressed are listed inS4 Table.
Differential expression of individual gene isoforms was further analyzed using EBSeq [68], an empirical Bayesian approach to modeling gene expression. For each transcript cluster iden-tified as differentially expressed by DESeq2, we used EBSeq to determine if any of the individ-ual transcripts were differentially expressed at a posterior probability greater than 0.99 (S4 Table). Of the 3729 differentially expressed transcript clusters identified by DESeq2, EBSeq identified at least one differentially expressed transcript for 1427 (38% of total, 43% of upregu-lated genes and 33% of downreguupregu-lated genes). These results indicate that differences in gene expression are likely due to alternative splicing or other isoform differences for many of the dif-ferentially expressed genes.
To annotate the functions of these genes and identify those likely to be involved with host responses toPdinfection, we used the Trinotate pipeline. BLAST was used to identify 1365 upregulated transcripts and 325 downregulated transcripts in WNS-affected tissues with signif-icant homology to known genes from vertebrates in the Swissprot database. Of the 2295 remaining transcripts, 13 were mapped to genes from non-vertebrates in the Swissprot data-base, presumably due to environmental contamination or incomplete removal ofPdtranscript sequences. Of the 2842 trinity transcript clusters without a BLASTx match in Swissprot, 2731 (96%) were found to align to sequences (e-value<0.0001) in the little brown myotis genome.
Of the aligned transcripts, 204 (7.4%) were found to correspond to previously identified non-coding RNA sequences. Of the 111 transcript clusters without a transcript that aligned to the little brown myotis genome or Swissprot, BLAST was used to align their transcripts to the Uni-Ref90 database. We found that 7 genes aligned to vertebrate homologs, 9 aligned to fungal homologs, and 15 aligned to other metagenomic sequences. We were unable to identify homol-ogous sequences for any transcripts from 80 (2.1%) of the transcript clusters that were differen-tially expressed.
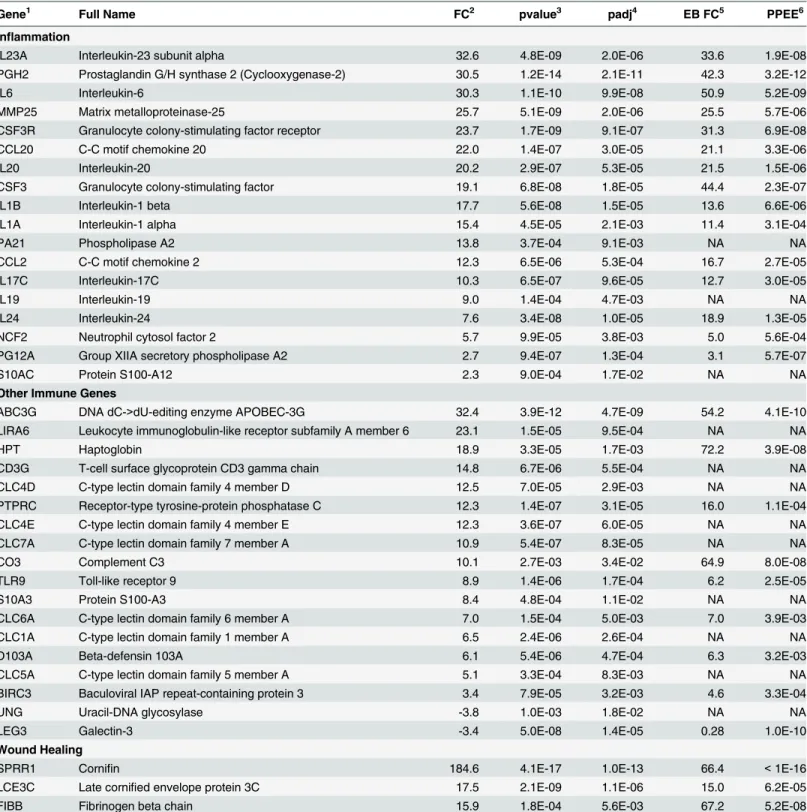
Expression levels for the Swissprot-identified transcript clusters with the 100 lowest adjusted p values are shown inFig 2(seeS4 Tablefor all results). Some of the differentially expressed genes with putative functions that were predicted to associate with host responses to a fungal pathogen are listed inTable 2. WNS caused dramatic changes in expression of genes involved in inflammation, immune responses, wound healing, metabolism, and oxidative stress, even though the bats were hibernating during thePdinfection. Most of these genes were upregulated in WNS-affected tissues, while a much smaller number of identified genes with putative functions in these categories were downregulated (Tables2andS4).
Fig 2. Global transcriptional analysis of WNS-affected and unaffected bats by RNA-Seq.Centered log2fold changes are shown for the 100 most
estimates is centered and log2scaled from a minimum of -4.8 to a maximum of 4.8. Transcripts were identified by BLAST alignment to the SwissProt
database.
doi:10.1371/journal.ppat.1005168.g002
Table 2. Selected genes differentially expressed in WNS-affected tissues.
Gene1 Full Name FC2 pvalue3 padj4 EB FC5 PPEE6
Inflammation
IL23A Interleukin-23 subunit alpha 32.6 4.8E-09 2.0E-06 33.6 1.9E-08
PGH2 Prostaglandin G/H synthase 2 (Cyclooxygenase-2) 30.5 1.2E-14 2.1E-11 42.3 3.2E-12
IL6 Interleukin-6 30.3 1.1E-10 9.9E-08 50.9 5.2E-09
MMP25 Matrix metalloproteinase-25 25.7 5.1E-09 2.0E-06 25.5 5.7E-06
CSF3R Granulocyte colony-stimulating factor receptor 23.7 1.7E-09 9.1E-07 31.3 6.9E-08
CCL20 C-C motif chemokine 20 22.0 1.4E-07 3.0E-05 21.1 3.3E-06
IL20 Interleukin-20 20.2 2.9E-07 5.3E-05 21.5 1.5E-06
CSF3 Granulocyte colony-stimulating factor 19.1 6.8E-08 1.8E-05 44.4 2.3E-07
IL1B Interleukin-1 beta 17.7 5.6E-08 1.5E-05 13.6 6.6E-06
IL1A Interleukin-1 alpha 15.4 4.5E-05 2.1E-03 11.4 3.1E-04
PA21 Phospholipase A2 13.8 3.7E-04 9.1E-03 NA NA
CCL2 C-C motif chemokine 2 12.3 6.5E-06 5.3E-04 16.7 2.7E-05
IL17C Interleukin-17C 10.3 6.5E-07 9.6E-05 12.7 3.0E-05
IL19 Interleukin-19 9.0 1.4E-04 4.7E-03 NA NA
IL24 Interleukin-24 7.6 3.4E-08 1.0E-05 18.9 1.3E-05
NCF2 Neutrophil cytosol factor 2 5.7 9.9E-05 3.8E-03 5.0 5.6E-04
PG12A Group XIIA secretory phospholipase A2 2.7 9.4E-07 1.3E-04 3.1 5.7E-07
S10AC Protein S100-A12 2.3 9.0E-04 1.7E-02 NA NA
Other Immune Genes
ABC3G DNA dC->dU-editing enzyme APOBEC-3G 32.4 3.9E-12 4.7E-09 54.2 4.1E-10
LIRA6 Leukocyte immunoglobulin-like receptor subfamily A member 6 23.1 1.5E-05 9.5E-04 NA NA
HPT Haptoglobin 18.9 3.3E-05 1.7E-03 72.2 3.9E-08
CD3G T-cell surface glycoprotein CD3 gamma chain 14.8 6.7E-06 5.5E-04 NA NA
CLC4D C-type lectin domain family 4 member D 12.5 7.0E-05 2.9E-03 NA NA
PTPRC Receptor-type tyrosine-protein phosphatase C 12.3 1.4E-07 3.1E-05 16.0 1.1E-04
CLC4E C-type lectin domain family 4 member E 12.3 3.6E-07 6.0E-05 NA NA
CLC7A C-type lectin domain family 7 member A 10.9 5.4E-07 8.3E-05 NA NA
CO3 Complement C3 10.1 2.7E-03 3.4E-02 64.9 8.0E-08
TLR9 Toll-like receptor 9 8.9 1.4E-06 1.7E-04 6.2 2.5E-05
S10A3 Protein S100-A3 8.4 4.8E-04 1.1E-02 NA NA
CLC6A C-type lectin domain family 6 member A 7.0 1.5E-04 5.0E-03 7.0 3.9E-03
CLC1A C-type lectin domain family 1 member A 6.5 2.4E-06 2.6E-04 NA NA
D103A Beta-defensin 103A 6.1 5.4E-06 4.7E-04 6.3 3.2E-03
CLC5A C-type lectin domain family 5 member A 5.1 3.3E-04 8.3E-03 NA NA
BIRC3 Baculoviral IAP repeat-containing protein 3 3.4 7.9E-05 3.2E-03 4.6 3.3E-04
UNG Uracil-DNA glycosylase -3.8 1.0E-03 1.8E-02 NA NA
LEG3 Galectin-3 -3.4 5.0E-08 1.4E-05 0.28 1.0E-10
Wound Healing
SPRR1 Cornifin 184.6 4.1E-17 1.0E-13 66.4 <1E-16
LCE3C Late cornified envelope protein 3C 17.5 2.1E-09 1.1E-06 15.0 6.2E-05
FIBB Fibrinogen beta chain 15.9 1.8E-04 5.6E-03 67.2 5.2E-08
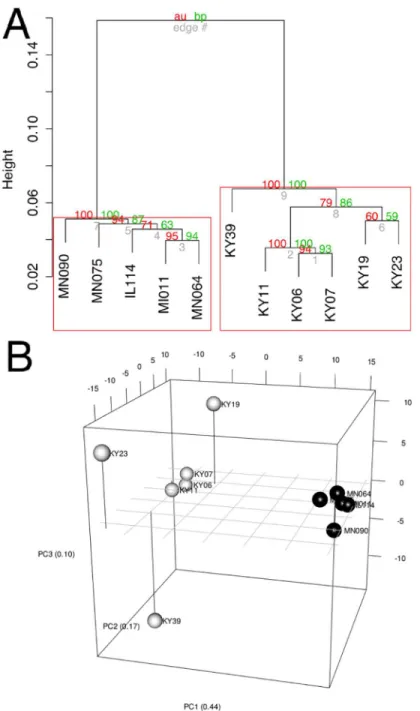
the variance) distinguish the KY19, KY23, and KY39 samples from the other two WNS-affected samples and from the unWNS-affected samples. The rotation values of principal component analysis (S5 Table) reveal that inflammatory genes made the greatest contribution to PC2. Clustering analysis revealed diverse host responses among the bats infected withPd.
Metabolic and Inflammatory Immune Pathways Associated with WNS
We next examined the functional pathways that were most affected in little brown myotis infected withPd. For this gene ontology analysis, DESeq2 results on transcript isoforms were used with a higher FDR threshold of 0.1, as is typical for this type of analysis. From WNS-affected bat tissue, 3104 upregulated transcripts were aligned with BLAST to the human Uni-prot database. Homologs for these transcripts were identified and a list of 1937 unique Ensembl IDs associated with upregulated genes was generated (S6 Table). GOrilla [70] was used to Table 2. (Continued)Gene1 Full Name FC2 pvalue3 padj4 EB FC5 PPEE6
FIBA Fibrinogen alpha chain 12.4 1.1E-03 1.9E-02 88.1 1.6E-08
ARGI1 Arginase-1 11.9 4.8E-04 1.1E-02 NA NA
FIBG Fibrinogen gamma chain 11.8 1.4E-03 2.2E-02 48.9 1.6E-07
EPGN Epigen 10.3 2.0E-09 1.1E-06 13.1 7.3E-06
EREG Proepiregulin 8.8 6.9E-07 1.0E-04 10.7 4.8E-04
KLK6 Kallikrein-6 8.1 3.4E-07 5.9E-05 9.1 4.2E-04
K1C17 Keratin, type I cytoskeletal 17 5.9 1.3E-05 8.7E-04 6.6 3.7E-03
P63 Tumor protein 63 3.1 2.0E-05 1.2E-03 16.9 9.8E-05
Metabolism
PLAC8 Placenta-specific gene 8 protein 37.0 1.5E-09 8.4E-07 25.9 1.3E-05
LIPP Pancreatic triacylglycerol lipase 22.3 1.0E-06 1.3E-04 19.4 2.7E-06
ANGL3 Angiopoietin-related protein 3 17.2 1.5E-04 4.9E-03 NA NA
APOC4 Apolipoprotein C-IV 16.1 7.9E-05 3.2E-03 NA NA
APOC3 Apolipoprotein C-III 15.8 1.8E-04 5.5E-03 42.5 8.7E-07
APOC2 Apolipoprotein C-II 14.5 3.7E-04 9.2E-03 45.0 6.8E-07
FFAR2 Free fatty acid receptor 2 7.7 1.8E-05 1.1E-03 7.3 9.1E-04
HCAR2 Hydroxycarboxylic acid receptor 2 4.0 6.9E-04 1.4E-02 NA NA
IP6K2 Inositol hexakisphosphate kinase 2 -5.0 3.8E-06 3.6E-04 0.19 2.2E-03
ACACA Acetyl-CoA carboxylase 1 -4.2 1.1E-03 1.9E-02 0.16 6.7E-03
Other Oxidative Stress
MMP3 Stromelysin-1 34.0 3.4E-10 2.5E-07 57.7 6.6E-08
PERT Thyroid peroxidase 3.7 2.7E-03 3.4E-02 NA NA
PRDX2 Peroxiredoxin-2 3.6 1.1E-05 7.8E-04 NA NA
HMOX1 Heme oxygenase 1 3.0 5.4E-04 1.2E-02 8.2 1.7E-03
1BLAST hit with the lowest E-value in the Swissprot database. Only genes with E<1E-05 were considered.
2Fold change in gene expression of the WNS-affected samples compared to the unaffected samples as determined by DESeq2. Negative values indicate
higher expression in the unaffected samples.
3Probability of differential expression determined by DESeq2.
4Adjusted probability of differential expression after Benjamini-Hochberg FDR correction.
5Posterior probability fold change in EBSeq-estimated expression of each transcript in WNS-affected tissues over unaffected tissues. NA indicates that no
isoform for that gene was differentially expressed at an FDR<0.001
6Posterior probability estimate by EBSeq that the isoform is differentially expressed.
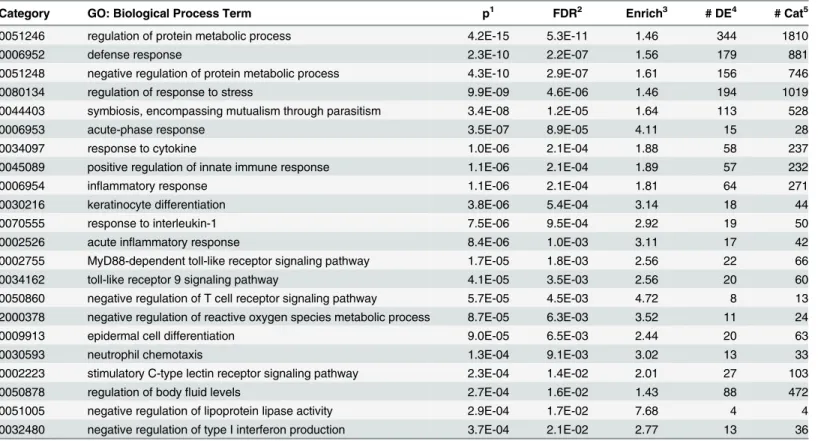
determine significantly upregulated gene ontology categories from the Uniprot GO ID data-base (Table 3andS7 Table) and REVIGO [71] was used to visualize biological processes that were significantly overrepresented in the WNS-affected transcriptome (Fig 4). The functional analysis revealed thatPdinfection increases expression of genes involved in metabolism, defense responses, and other pathways (Table 3).
Fig 3. Clustering of gene expression patterns.(A) Bootstrap analysis of regularized-log transformed
counts to assign confidence levels to sample clustering. Red values are approximately unbiased p values and green values are bootstrap probabilities. Red boxes indicate clusters supported at a confidence level of 99%. (B) Principal component analysis of regularized-log transformed counts of differentially expressed genes. Black spheres represent unaffected bats and white spheres represent WNS-affected bats.
For the transcripts that showed lower expression in WNS-affected tissue (Fig 2), the same analysis was performed. Of the 1152 identified transcripts that were downregulated at an FDR of 0.1, 694 homologous human genes were identified by BLAST and mapped to Ensembl gene IDs (S6 Table). GOrilla did not identify any Biological Process categories that were significantly downregulated in the WNS-affected bat tissue.
Host-Pathogen Interactions during WNS
To examine the gene expression of thePdpathogen using a dual RNA-Seq approach [72], we separately generated a genome-guided Trinity assembly (S3 Dataset) with the Broad Institute G.destructansgenome. The reads from each of the WNS-affected tissues were mapped onto this assembly with Bowtie and gene expression estimated using RSEM (S4 Dataset). Expression levels for thePdgenes with the greatest variance are shown inFig 5. Hierarchical clustering (Fig 6) and principal component analysis (S2 Fig) of the differentially expressed transcripts indicated thatPdgene expression was most similar in the wing tissues from bats obtained from the same hibernaculum (Table 1). The expression patterns ofPdgenes were more similar for KY06, KY07, and KY11, which corresponds to bats captured in Cave 1 in Kentucky, and for KY19 and KY23, which were captured from Cave 2.
Table 3. Selected over-represented gene ontology biological process categories.
Category GO: Biological Process Term p1 FDR2 Enrich3 # DE4 # Cat5
0051246 regulation of protein metabolic process 4.2E-15 5.3E-11 1.46 344 1810
0006952 defense response 2.3E-10 2.2E-07 1.56 179 881
0051248 negative regulation of protein metabolic process 4.3E-10 2.9E-07 1.61 156 746
0080134 regulation of response to stress 9.9E-09 4.6E-06 1.46 194 1019
0044403 symbiosis, encompassing mutualism through parasitism 3.4E-08 1.2E-05 1.64 113 528
0006953 acute-phase response 3.5E-07 8.9E-05 4.11 15 28
0034097 response to cytokine 1.0E-06 2.1E-04 1.88 58 237
0045089 positive regulation of innate immune response 1.1E-06 2.1E-04 1.89 57 232
0006954 inflammatory response 1.1E-06 2.1E-04 1.81 64 271
0030216 keratinocyte differentiation 3.8E-06 5.4E-04 3.14 18 44
0070555 response to interleukin-1 7.5E-06 9.5E-04 2.92 19 50
0002526 acute inflammatory response 8.4E-06 1.0E-03 3.11 17 42
0002755 MyD88-dependent toll-like receptor signaling pathway 1.7E-05 1.8E-03 2.56 22 66
0034162 toll-like receptor 9 signaling pathway 4.1E-05 3.5E-03 2.56 20 60
0050860 negative regulation of T cell receptor signaling pathway 5.7E-05 4.5E-03 4.72 8 13 2000378 negative regulation of reactive oxygen species metabolic process 8.7E-05 6.3E-03 3.52 11 24
0009913 epidermal cell differentiation 9.0E-05 6.5E-03 2.44 20 63
0030593 neutrophil chemotaxis 1.3E-04 9.1E-03 3.02 13 33
0002223 stimulatory C-type lectin receptor signaling pathway 2.3E-04 1.4E-02 2.01 27 103
0050878 regulation of bodyfluid levels 2.7E-04 1.6E-02 1.43 88 472
0051005 negative regulation of lipoprotein lipase activity 2.9E-04 1.7E-02 7.68 4 4
0032480 negative regulation of type I interferon production 3.7E-04 2.1E-02 2.77 13 36
1Over-represented p value.
2False discovery rate after Benjamini-Hochberg adjustment for multiple comparisons. 3Enrichment of differentially expressed genes in this category.
4Number of differentially expressed genes in this category identi
fied by GOrilla at a p value cutoff of 0.001.
5Number of genes in this GO category represented in the background set.
Fig 4. REVIGO treemap summarizing gene ontology biological process categories over-represented in WNS-affected tissues.GOrilla was used to identify Gene Ontology Biological Processes that were over-represented among transcripts more highly expressed in WNS-affected tissues at an FDR cutoff of 0.1 (S6 Table). Over-represented categories with p values of less than 0.001 (290 terms) were used to generate a treemap colored by functional category. The size of each rectangle is proportional to the p value for that category.
Fig 5. Transcriptional analysis ofPdgene expression on bats with WNS.Centered log2fold changes are
shown for 100Pdgenes with the greatest variance and a minimum TMM-normalized FPKM expression of 1 in all 6 samples. The heatmap is scaled from a minimum of -4.4 to a maximum of 4.4.
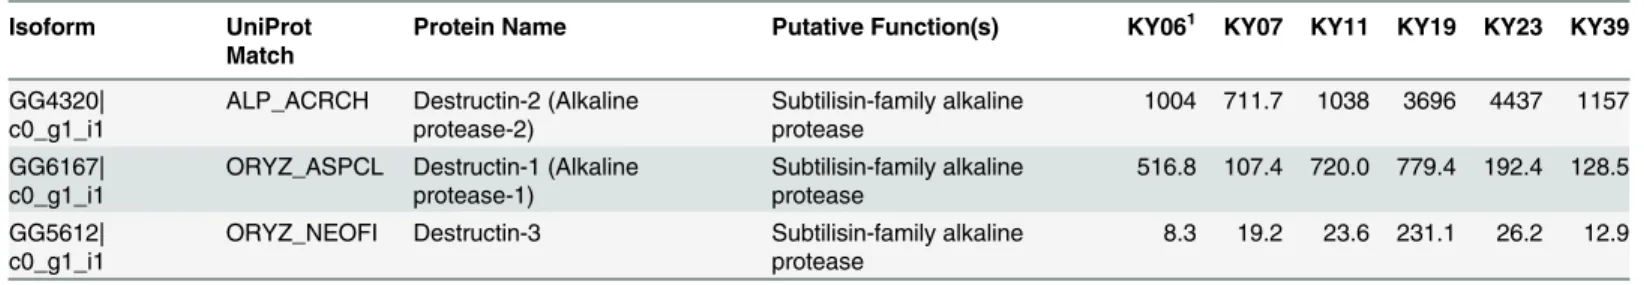
The possible functions of thePdgenes expressed among the WNS-affected samples were analyzed by sequence homology. We first examined the expression levels of a family of secreted proteases that have been proposed to be involved in Pd virulence [73,74] and found that these alkaline proteases were expressed byPdin all 6 wing samples (Table 4). Destructin-2 was the most highly expressed isoform in all WNS-affected batPdsamples.
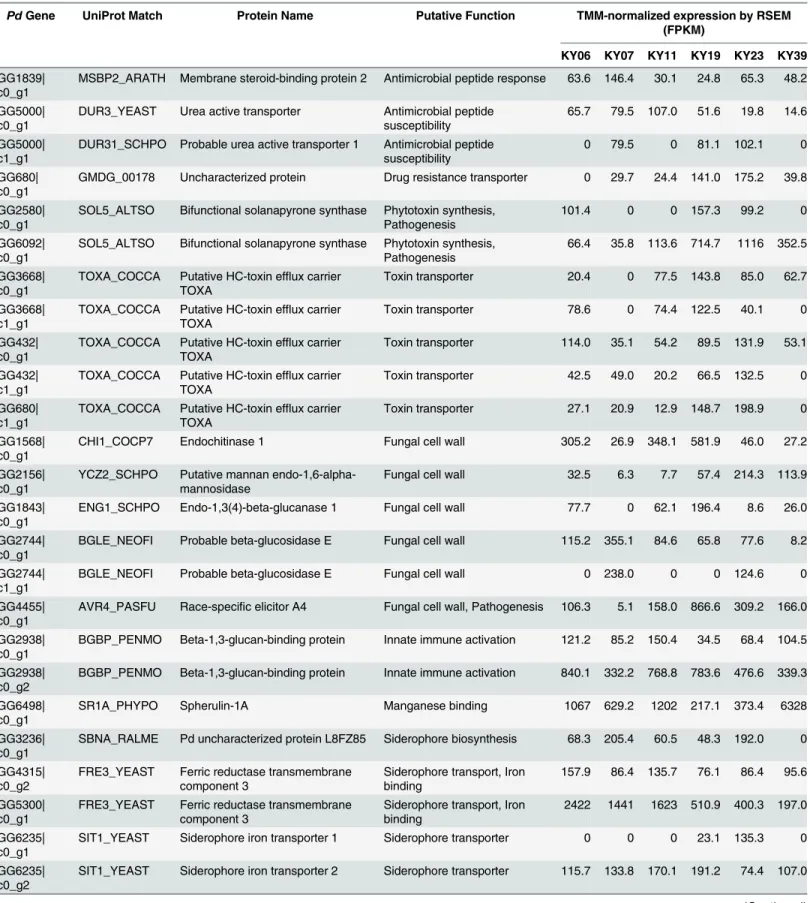
We next examined thePdtranscript clusters for additional factors that could affect viru-lence. Alignment by BLAST to the Swissprot and Uniprot90 databases identified 12 056 tran-scripts with significant homology to known fungal genes (S8 Table). For the remaining 67Pd transcript clusters, Trinotate was not able to identify known functional domains or signal pep-tides present in these previously uncharacterizedPdtranscripts. The results from the BLAST alignment were examined for genes known to be involved in processes that could affectPd vir-ulence, such as secreted proteases [73–75], metal binding proteins [76], fungal cell wall remod-eling [76,77], and other virulence factors [75,77,78]. This analysis identified 46Pdgenes that could be involved in pathogenesis (Table 5), including additional secreted proteases that could be involved in tissue invasion.
Fig 6. Hierarchical clustering ofPdgene expression on bats with WNS.Hierarchical clustering of differentially expressed Pd genes using Pearson correlation complete-linkage clustering. Scale shows Pearson correlation coefficient.
doi:10.1371/journal.ppat.1005168.g006
Table 4. Expression of destructin transcripts inPdgrowing on WNS-affected bats.
Isoform UniProt
Match
Protein Name Putative Function(s) KY061 KY07 KY11 KY19 KY23 KY39
GG4320|
c0_g1_i1 ALP_ACRCH Destructin-2 (Alkalineprotease-2) Subtilisin-family alkalineprotease 1004 711.7 1038 3696 4437 1157 GG6167|
c0_g1_i1 ORYZ_ASPCL Destructin-1 (Alkalineprotease-1) Subtilisin-family alkalineprotease 516.8 107.4 720.0 779.4 192.4 128.5 GG5612|
c0_g1_i1 ORYZ_NEOFI Destructin-3 Subtilisin-family alkalineprotease 8.3 19.2 23.6 231.1 26.2 12.9
1Trimmed mean of M-values- (TMM-) normalized expression determined by RSEM in fragments per kilobase of transcript per million mapped reads
(FPKM).
Table 5. Possible virulence genes expressed inPdgrowing on WNS-affected bats.
PdGene UniProt Match Protein Name Putative Function TMM-normalized expression by RSEM
(FPKM)
KY06 KY07 KY11 KY19 KY23 KY39
GG1839|
c0_g1 MSBP2_ARATH Membrane steroid-binding protein 2 Antimicrobial peptide response 63.6 146.4 30.1 24.8 65.3 48.2 GG5000|
c0_g1 DUR3_YEAST Urea active transporter Antimicrobial peptidesusceptibility 65.7 79.5 107.0 51.6 19.8 14.6 GG5000|
c1_g1 DUR31_SCHPO Probable urea active transporter 1 Antimicrobial peptidesusceptibility 0 79.5 0 81.1 102.1 0 GG680|
c0_g1 GMDG_00178 Uncharacterized protein Drug resistance transporter 0 29.7 24.4 141.0 175.2 39.8 GG2580|
c0_g1 SOL5_ALTSO Bifunctional solanapyrone synthase Phytotoxin synthesis,Pathogenesis 101.4 0 0 157.3 99.2 0 GG6092|
c0_g1 SOL5_ALTSO Bifunctional solanapyrone synthase Phytotoxin synthesis,Pathogenesis 66.4 35.8 113.6 714.7 1116 352.5 GG3668|
c0_g1 TOXA_COCCA Putative HC-toxin efflux carrierTOXA Toxin transporter 20.4 0 77.5 143.8 85.0 62.7 GG3668|
c1_g1 TOXA_COCCA Putative HC-toxin efflux carrierTOXA Toxin transporter 78.6 0 74.4 122.5 40.1 0 GG432|
c0_g1 TOXA_COCCA Putative HC-toxin efflux carrierTOXA Toxin transporter 114.0 35.1 54.2 89.5 131.9 53.1 GG432|
c1_g1 TOXA_COCCA Putative HC-toxin efflux carrierTOXA Toxin transporter 42.5 49.0 20.2 66.5 132.5 0 GG680|
c1_g1 TOXA_COCCA Putative HC-toxin efflux carrierTOXA Toxin transporter 27.1 20.9 12.9 148.7 198.9 0 GG1568|
c0_g1 CHI1_COCP7 Endochitinase 1 Fungal cell wall 305.2 26.9 348.1 581.9 46.0 27.2
GG2156|
c0_g1 YCZ2_SCHPO Putative mannan endo-1,6-alpha-mannosidase Fungal cell wall 32.5 6.3 7.7 57.4 214.3 113.9 GG1843|
c0_g1 ENG1_SCHPO Endo-1,3(4)-beta-glucanase 1 Fungal cell wall 77.7 0 62.1 196.4 8.6 26.0 GG2744|
c0_g1 BGLE_NEOFI Probable beta-glucosidase E Fungal cell wall 115.2 355.1 84.6 65.8 77.6 8.2 GG2744|
c1_g1 BGLE_NEOFI Probable beta-glucosidase E Fungal cell wall 0 238.0 0 0 124.6 0
GG4455|
c0_g1 AVR4_PASFU Race-specific elicitor A4 Fungal cell wall, Pathogenesis 106.3 5.1 158.0 866.6 309.2 166.0 GG2938|
c0_g1 BGBP_PENMO Beta-1,3-glucan-binding protein Innate immune activation 121.2 85.2 150.4 34.5 68.4 104.5 GG2938|
c0_g2 BGBP_PENMO Beta-1,3-glucan-binding protein Innate immune activation 840.1 332.2 768.8 783.6 476.6 339.3 GG6498|
c0_g1 SR1A_PHYPO Spherulin-1A Manganese binding 1067 629.2 1202 217.1 373.4 6328
GG3236|
c0_g1 SBNA_RALME Pd uncharacterized protein L8FZ85 Siderophore biosynthesis 68.3 205.4 60.5 48.3 192.0 0 GG4315|
c0_g2 FRE3_YEAST Ferric reductase transmembranecomponent 3 Siderophore transport, Ironbinding 157.9 86.4 135.7 76.1 86.4 95.6 GG5300|
c0_g1 FRE3_YEAST Ferric reductase transmembranecomponent 3 Siderophore transport, Ironbinding 2422 1441 1623 510.9 400.3 197.0 GG6235|
c0_g1 SIT1_YEAST Siderophore iron transporter 1 Siderophore transporter 0 0 0 23.1 135.3 0 GG6235|
Because the tissue samples were collected from bats from 6 different hibernacula for this study, it is possible that differences in host or pathogen gene expression reflect differences in the environmental conditions present in each location, including the microbiome. In addition, the housing of the unaffected bats in captivity for 13 weeks prior to analysis could also have affected the microbiome. To examine the differences in the skin microbiome between the bats, we used MG-RAST to identify the lowest common ancestor of metagenomic sequences present Table 5. (Continued)
PdGene UniProt Match Protein Name Putative Function TMM-normalized expression by RSEM
(FPKM)
KY06 KY07 KY11 KY19 KY23 KY39
GG2118|
c0_g2 ZRT1_YEAST Zinc-regulated transporter 1 Zinc transporter 1873 1637 1447 924.5 1211 501.3 GG5016|
c0_g2 ZRT1_YEAST Zinc-regulated transporter 2 Zinc transporter 457.4 310.7 449.3 66.9 137.0 564.1 GG3064|
c0_g1 MIRB_EMENI Siderophore iron transporter mirB Response to iron ionstarvation 547.5 169.3 220.7 136.1 425.8 259.6 GG861|
c0_g1 MIRB_EMENI Siderophore iron transporter mirB Response to iron ionstarvation 656.0 410.1 712.3 913.4 1324 541.4 GG4694|
c1_g1 LAC2_PODAS Laccase-2 Melanin biosynthesis 64.2 19.8 329.4 553.8 69.1 179.0
GG6611|
c0_g1 UREA_ASPFU Urease Nitrogen metabolism 49.8 0 0 38.8 151.1 222.7
GG6611|
c1_g1 UREA_ASPFU Urease Nitrogen metabolism 0 28.2 34.8 28.6 112.6 0
GG6611|
c3_g1 UREA_ASPFU Urease Nitrogen metabolism 0 54.8 0 55.7 142.6 0
GG6612|
c0_g1 UREA_ASPFU Urease Nitrogen metabolism 0 0 0 499.6 0 0
GG3518|
c0_g1 ALL2_ASPFU Major allergen Asp f 2 Metallopeptidase, Fungalallergen 2789 4105 1021 3510 5373 449.6 GG2311|
c0_g1 PRTA_ASPNG Aspergillopepsin-2 Aspartic endopeptidase 59.3 79.9 84.5 709.2 1149 68.8 GG2082|
c0_g1 PEPA_ASPOR Aspartic protease pep1 Secreted asparticendopeptidase 64.5 31.0 45.9 95.5 370.1 0 GG2082|
c0_g2 PEPA_ASPOR Aspartic protease pep1 Secreted asparticendopeptidase 0.1 0.1 0.1 189.7 5.1 0 GG4492|
c0_g1 CARP_CRYPA Endothiapepsin Secreted asparticendopeptidase 648.7 460.5 311.8 406.5 423.6 216.0 GG448|
c0_g1 LAP1_SCLS1 Leucine aminopeptidase 1 Secreted leucyl endopeptidase 100.7 84.0 95.7 283.3 265.6 183.0 GG788|
c0_g1 SPM1_MAGO7 Subtilisin-like proteinase Spm1 Secreted serineendopeptidase 956.8 952.7 525.5 1260 1176 919.4 GG2765|
c0_g1 PEPS_ASPPH Carboxypeptidase cpdS Serine carboxypeptidase 83.2 114.5 146.9 775.2 981.3 408.6 GG3562|
c1_g1 SED4_ARTOC Tripeptidyl-peptidase SED4 Serine endopeptidase,Pathogenesis 715.7 366.5 690.3 1703 2009 191.9 GG2259|
c0_g1 SOD6_CANAL Cell surface superoxide dismutase[Cu-Zn] 6 Superoxide metabolism,Pathogenesis 43.5 44.6 13.8 556.7 880.6 179.3 GG4408|
c0_g1 CCPR2_ASPFU Putative heme-binding peroxidase Oxidative stress response, Ironbinding 1044 842.8 477.1 63.0 42.3 421.4 GG6788|
c0_g1 HOG1_CRYPA Mitogen-activated protein kinaseHOG1 Virulence and conidiaformation 735.1 816.2 959.1 325.7 373.5 772.8
(S8 Table). Although there were some differences observed in the bacterial microbiomes pres-ent on the wings of the 11 bats, there were no significant changes between the WNS-affected and unaffected samples when bacteria were identified at the class level. Several strains of Pseu-domonas fluorescensisolated from bat tissues have been identified withPdgrowth inhibiting properties [79]. MG-RAST analysis showed thatPseudomonasspecies are present in all 11 samples (S8 Table).P.fluorescenstranscripts represented 2.8±0.6% of transcripts identified from gammaproteobacteria and 0.40±0.05% of all bacteria on the wings of unaffected bats and 0.37±0.07% of all bacteria on WNS-affected bats.P.fluorescenswas present on all little brown myotis sampled, but was rare and relative abundance was not statistically different between WNS-affected and unaffected bats (p = 0.49, t = -0.71, df = 9).
Discussion
The comparison of host gene expression between WNS-affected and unaffected little brown myotis clearly demonstrates thatPdinfection causes physiological responses in wing tissue, where substantial fungal invasion of the skin occurs in WNS-affected bats [8]. The changes in transcript levels that we have observed indicate that host responses to fungal infection remain intact during hibernation and are similar to those observed during the initial stages of fungal infection in euthermic mammals [32]. These host responses include acute inflammation, wound healing, and metabolic changes. Pathogen gene expression varies among bats with WNS, suggesting host-pathogen interactions that mediate pathogenesis. Together, these results lay a foundation to determine which host and pathogen responses contribute to WNS resis-tance and susceptibility and identify targets to increase survival.
Host Response to
Pd
Infection
The gene expression changes we observed in the wing tissue of WNS-affected bats are similar to those observed in other cutaneous fungal infections [80]. CutaneousCandida albicans infec-tions in humans and mice typically initiate an immune response by activating pattern recogni-tion receptors of the C-type lectin family [81–83] and the toll-like receptor family, both of which we found upregulated in WNS-affected bat wing tissue (S4 Table). These included C-type lectin domain (CLEC) family members CLEC4D (MCL), CLEC4E (MINCLE), CLEC7A (Dectin-1), CLEC6A (Dectin-2), and Toll-like receptor 9. In mice and humans, protective host responses toC.albicansare usually characterized by many of the same cytokines and chemo-kines [29] that we have found upgregulated in WNS-affected wing tissue, including the cyto-kines IL-1β, IL-6, G-CSF, IL-23A, and IL-17C. Little brown myotis infected withPdare increasing transcription of the key genes necessary for initiating a host response that provides protection from fungal infection. This clearly demonstrates that hibernation does not prevent innate immune responses in bats infected withPdand that, although they are not closely related to rodents and primates [41], bats respond to fungal infections similarly to these other mammals.
transcription factor p65, NFκB, and P-selectin glycoprotein ligand 1 (S4 Table). Another important cytokine produced by epithelial cells in response to infection is IL-17C [87]. This is an atypical IL-17 family member that is expressed by epithelial cells and causes autocrine responses in the epithelial cells that also express the IL-17RA and IL-17RE heterodimeric IL-17 receptor [87]. The wing tissue transcriptomes from WNS-affected and unaffected bats show similar expression levels of both IL-17RA and IL-17RE (S2 Dataset) and would, therefore, be expected to be responsive to IL-17C. The gene ontology analysis also found evidence for func-tional enrichment of genes involved in keratinocyte differentiation, presumably due to wound healing responses. Keratinocytes or other epithelial cells in bat wing tissue appear to have responded to the invasion of the epidermis by fungal hyphae.
Genes for pro-inflammatory mediators characterized the innate immune response that we observed in the wing tissue ofPdinfected bats. Under euthermic conditions this would be expected to provide protection by the recruitment of monocytes and neutrophils, mediated by G-CSF, IL-23A, Ccl2, IL-17C and IL-6 [88], and the initiation of an adaptive Th17 or Th1 response. However, under the constraints of hibernation, responses that require leukocyte migration do not appear to occur inPd-infected bats. We do not find strong evidence of increased expression for genes characteristic of either innate or adaptive leukocytes, except for L-selectin, which is expressed on T cells, and CD177, which is expressed on neutrophils. Lower than expected levels of monocyte, neutrophil, Th1, and Th17 cell recruitment may be related to the sequestration of leukocytes during hibernation [45]. However, we have observed neutrophil recruitment in hibernating little brown myotis in response to another fungal infection
(Table 1). In the histological examination of the current samples, we found neutrophilic inflammation in both WNS-affected and unaffected wing tissue (Table 1). However, this inflam-mation did not occur at the sites ofPdinfection. Curiously, we found a significant increase in WNS-affected tissue for transcripts for CD3γand CD45 that could be expressed by gamma-delta T cells or other innate lymphocytes that reside in the skin [89]. It is possible thatPdis spe-cifically suppressing neutrophil and/or T cell recruitment by interfering with chemotactic sig-nals, similar to the suppression of inflammatory immune responses during chytridiomycosis in amphibians [42]. However, analysis of tissue levels of the cytokines and chemokines is necessary to confirm the secretion of these proteins. Because neutrophils and T cells do not appear to be recruited to sites ofPdinfection during hibernation, only local inflammatory mediators may be available and they appear to be unable to control the infection in little brown myotis.
In addition to immune responses, hibernating bats also respond toPdinfection in other ways. We found transcripts for proteins from many pathways involved in metabolism, signal-ing, gene expression, transport, migration, and differentiation that were altered in WNS-affected bats (Fig 4). We cannot exclude the possibility that some of these differences were due to the different hibernation conditions of the two groups of bats. However, the differential expression of the genes in these pathways demonstrates that they are subject to regulation dur-ing hibernation and can respond to infection, tissue damage, and/or environmental changes.
are driven by differences in the host environment or vice versa. Although all 6 WNS-affected bats had visible signs of WNS, had similarPdburdens, and similar histopathology, it is possible that the differences in host or pathogen gene expression that we observed may have affected progression of WNS and survival.
Responses that May Contribute to WNS Mortality
Because the increased frequency of arousals from torpor appears to be a primary cause of WNS mortality [5,14,22], we considered possible mechanisms that could affect torpor bout length. The increased gene expression of IL-1, IL-6, and other pro-inflammatory cytokines mediates a local acute inflammatory response toPd. These cytokines also have systemic effects that modify behavior and thermoregulation [91]. In addition to cytokine and chemokine transcript
increases, we also found increased transcripts for the enzyme cyclooxygenase-2 (prostaglandin G/H synthase 2) and both secreted and cytosolic phospholipase A2 that form critical inflam-matory lipid mediators such as prostaglandin H2. The eicosanoids generated by these enzymes, along with the actions of the upregulated genes kallikrein-6 and cathepsin S, are expected to generate pain and itching by locally activating neuronal nociceptors [92,93]. This, in turn, could affect torpor bout length and/or behavior during periodic arousals. Indeed, we have doc-umented significantly more grooming in WNS-affected bats infected in the wild [94], although a different study on laboratory-infected bats did not find similar behavior changes [95]. Together, the upregulated genes will likely generate an inflammatory microenvironment within the wing that may contribute to the robust wound healing response that we observe in WNS-affected bats. However, inflammation can also play a detrimental role in some diseases [96]. Further tissue damage and subsequent wound healing occurs in surviving bats upon emergence from hibernation [19]. These local affects of inflammation (pain and itching) as well as sys-temic effects are likely to play a key role in WNS pathology.
In addition to the gene expression changes that may contribute to acute inflammation locally within the epithelial tissues invaded byPd, the systemic release of febrile cytokines such as IL-6 could affect the signals that control hibernation arousal. However, an exogenous pyro-gen, lipopolysaccharide, is not able to provoke arousals in hibernating golden-mantled ground squirrels [97], so it may be unlikely that inflammation or febrile cytokines can directly trigger arousal in WNS-affected bats. Intracerebroventricular injection of prostaglandin E2in golden-mantled ground squirrels induces arousal from torpor and a febrile response during an extended periodic arousal [97]. Our observation of increased expression of the enzyme that generates prostaglandin H2may provide a mechanism that explains the shortened torpor bouts in WNS-affected bats, if it can be shown that this enzyme is active in the tissue and produces enough prostaglandin H2to act systemically.
The other changes in host gene expression that we observed are consistent with a multi-stage progression model of WNS [22]. We also found support for changes in genes involved in oxidative stress [23] and body fluid levels, which may contribute to WNS progression.
Together, the pattern of gene expression changes that we find in little brown myotis with WNS suggests that a combination of maladaptive responses may contribute to mortality. However, the number of upregulated genes involved in the acute inflammatory response suggests that excessive inflammation may also be a factor contributing to pathology even prior to emergence from hibernation when it is suspected to contribute to wing damage [101].
Implications for Future Studies
The changes in host transcript levels that we have found are presumably caused by physiologi-cal responses of the host to infection. However, caution must be used when extending these transcriptional responses to functional mechanisms because the current study does not mea-sure protein or metabolite levels directly. Future studies will be necessary to determine which of the gene expression changes observed affect which host response mechanisms.
The little brown myotis chosen for the WNS-affected samples were exhibiting WNS pathol-ogy and appeared unlikely to survive at the time of sample collection. For this reason, it is pres-ently uncertain which of the gene expression changes that we have observed are contributing to protection and which are pathological. Another factor that likely contributes to the variation in gene expression that we observed among the samples collected from free-ranging bats is the time since the most recent arousal from torpor. Prior to collection of each wing tissue sample, bats were artificially aroused for 30 to 120 minutes. This period of arousal is similar in duration to the natural arousals during hibernation for little brown myotis [14], and presumably of suffi-cient duration for some innate immune responses to occur and for transcript levels to be altered. One reason for this procedure was to avoid disparities between the elapsed time from the most recent arousal bout until tissue collection. For the WNS-affected bats we could not determine when the most recent natural arousal would have occurred, but it would have likely been more recently than in unaffected animals, as affected animals arouse from torpor more frequently [14]. In the current study we cannot resolve whether the changes in gene expression that we observed occurred during the most recent arousal, during previous periodic arousals, or during torpor. Future studies will be needed to determine which of the changes in gene expression that we observed during WNS in bats in the wild also vary in controlled captive hibernation conditions when prior arousal patterns are known. Further studies are also needed to compare the physiological responses in bats exhibiting WNS morbidity to responses in less susceptible bats, such as European species, North American species that are less susceptible like the big brown bat [11], and the remnant populations of little brown myotis that appear to have developed tolerance or resistance toPd[1]. Such studies should point to a path forward for bats in North America to persist in a landscape wherePdis endemic.
Conclusions
responses, metabolic pathways, and transcription. NumerousPdgenes that may contribute to virulence were identified and these represent potential pathogen responses to host defense. Hibernation does not prevent a host response to infection and a better understanding of the differences between host and pathogen responses in bats susceptible to WNS and those resis-tant may lead to ways for increasing survival.
Materials and Methods
Ethics Statement
This study was carried out on bats from non-endangered species in strict accordance with the recommendations in the Guide for the Care and Use of Laboratory Animals of the National Institutes of Health. All methods were approved by the Institutional Animal Care and Use Committee at Bucknell University (protocol DMR-016). Animals were humanely euthanized by isoflurane anesthesia overdose followed by decapitation. In Illinois, animal collection was conducted by state wildlife officials and a numbered permit was not required. Scientific collec-tor’s permits were obtained in Michigan (SC1448), Minnesota (201174), and Kentucky (SC1411147).
Samples
We collected hibernating little brown myotis from cave or mine walls at the locations listed in
Table 1. Bats collected from all locations are expected to be from the same genetic population of eastern little brown myotis [102]. For bats unaffected by WNS, little brown myotis were first swabbed on the left forearm for quantitative PCR analysis. After measurements were taken, bats were individually placed in cloth bags and hung in constant temperature thermoelectric coolers (Koolatron PC-3) maintained at ~7°C. Water-saturated sponges were placed in the bot-tom of each cooler to maintain humidity during transportation to Bucknell University. Bats were housed for 13 weeks in a Percival (model I36VLC8) environmental chamber with condi-tions set to 4°C and 95% relative humidity. Bats were provided water throughout hibernation. Bats were aroused from hibernation for 30–120 minutes prior to euthanasia. For WNS-affected bats, little brown myotis were collected in the field, measured, swabbed for quantitative PCR, and humanely euthanized after being aroused from hibernation for 60–120 minutes. Scaled mass index (SMI) was calculated using the formula (mass(in g))(38.01/(forearm length(in mm))^1.406 [103]. Wing tissue was placed in formalin for histology and placed in RNAlater (Sigma-Aldrich) for gene expression analysis. RNAlater samples were stored at ambient tem-perature for up to 24 hours before long-term storage at -80°C. RNA was purified from 50 mg of wing tissue using a QIAGEN RNeasy Mini Kit. All samples used for RNA sequencing had RNA integrity values greater than 7.0 using an Agilent Bioanalyzer.
Verification of WNS Status
To determine presence or absence ofPdon bats unaffected by WNS, each swab was tested twice by quantitative PCR [64] by Jeffrey T. Foster at University of New Hampshire. A cycle-threshold less than 40 was used as a positive result. One of the 5 unaffected bats had one posi-tive and one negaposi-tive test (Table 1), but histology (Table 1) and subsequent RNA sequencing determined this to most likely be a false positive (S2 Table; p = 2.2x10⁻⁶). For bats affected by WNS, we performed quantitative PCR to measure thePdload, in genomic equivalents normal-ized to swabs spiked with 10 000Pdconidia, that were detected on each bat [15].
Next Generation RNA Sequencing
The Genome Sequencing and Analysis Facility at the University of Texas at Austin performed all library preparation and quality control procedures. Directional RNA libraries were prepared with poly-A mRNA enrichment, dUTP/UDG strand-specific labeling, fragmentation, and 200 base pair size selection. RNA-Seq was performed in two lanes of an Illumina HiSeq 2500 with 101 base pair length reads obtained.
Transcriptome Assemblies
The paired reads from all samples were preprocessed by removing adapters and using trimmo-matic PE [104] with settings of Illumina clip:2:30:10, seed mismatches:2, palindrome thresh-old:30, clip threshold:10, leading:5, trailing:5, minlength:36. The remaining paired reads were then combined and Trinity (v2.0.4) was used in strand-specific mode (RF) to construct a de novo assembly [105]. K-mer in silico read normalization with maximum coverage of 50 resulted in 22 482 456 read pairs that were used for assembly out of 177 755 004 total. The assembly was then filtered to removePdsequences using the program Deconseq [65] with the Broad InstituteGeomyces destructansgenome 20631–21 used to identify pathogen sequences and with the little brown myotis genome (Myoluc2.0) used to retain host sequences. Bowtie 1.0.1 [106] was used to determine the number of reads that mapped to each transcript in the assembly.
Differential Expression
The script align_and_estimate_abundance.pl included in the Trinity v2.0.6 distribution [105] was used to estimate expression levels for each transcript. Bowtie 1.0.1 [106] was used to map reads (including unpaired reads after quality trimming) from each sample onto the assembly. RSEM v1.2.20 [107] was used to apply an expectation maximization algorithm to predict gene expression counts for each transcript. Expression levels are presented after trimmed mean of M-values (TMM) normalization in fragments per kilobase of transcript per million mapped reads (FPKM). DESeq2 v1.8.1 [67] was used to determine the probability of differential expres-sion for each Trinity transcript cluster that had a minimum RSEM-estimated count, before normalization, of 5 across all samples. For DESeq2 analysis, the default values for removing outliers and filtering lowly expressed transcripts were used. An alpha value of 0.05 was used instead of the default of 0.1 to decrease the number of differentially expressed genes identified. Posterior probabilities of differential expression for individual transcript isoforms were esti-mated using a Bayesian approach with EBSeq v1.8.0 [68]. False discovery rate [108] was used to control for multiple comparisons. NCBI BLAST v2.2.29+ [109] was used to identify the highest-ranking match for each isoform in the UniProt Swissprot database (downloaded on Sep 17, 2014) with an e-value cutoff of 1x10⁻⁵.
using the pvclust 1.3–2 package and 1000 replications [69]. Principal component analysis was performed using the prcomp function and visualized with the rgl 0.93.1098 package.
Gene Ontology
NCBI BLAST v2.2.29+ [109] was used with an e-value cutoff of 1x10⁻⁵to identify homologs in the Uniprot Swissprot human protein database (downloaded on Nov 25, 2014) for transcripts significantly upregulated in WNS-affected bat wing tissue with an FDR of less than 0.1 (in order to increase the number of genes prior to subsequent analysis with higher stringency FDR). Unique Ensembl gene IDs were identified for 1144 of the 1922 upregulated transcripts and 481 of the 1356 downregulated transcripts. GOrilla [70] was used with a p value cutoff of 0.001 to identify upregulated or downregulated biological processes by comparison to the back-ground list of 12 828 human genes identified by BLAST in the Trinity assembly. Multiple test-ing correction [108] was used with an FDR cutoff of 0.01. Results were visualized as a treemap with REVIGO [71].
Pd
Gene Analysis
Trinity v2.0.4 was used to generate aPdassembly in genome-guided mode with jaccard clip-ping and using the Broad InstituteG.destructansgenome 20631–21. This assembly was used to assess pathogen gene expression in the samples from WNS-affected bats using RSEM v1.2.20 [107]. Trinotate v2 was used to annotate thePdtranscripts by using NCBI BLAST v2.2.29+ [109] and both the Swissprot and Uniref90 databases (downloaded on Sep 17, 2014).
Metagenome Analysis
Reads for each sample were analyzed using MG-RAST v.3.5 [110] to identify metagenomic sequences after filtering against theB.taurusgenome (the taxonomically closest genome avail-able for filtering). For assignment of organism abundance, the best hit classification was used with the M5NR database, maximum e-value cutoff of 1x10⁻⁵, minimum identity cutoff of 60%, and minimum alignment length cutoff of 15.
Supporting Information
S1 Fig. MA plot of gene expression using the trinity transcriptome assembly.Expression levels for every gene are shown by comparing RSEM-estimated counts to the fold-change in expression between unaffected and WNS-affected bat tissues. Blue points indicate significant differential expression determined by DESeq2 using an FDR cutoff of 0.05. Genes that are more highly expressed in WNS-affected tissues are found in the lower side of the graph. (TIF)
S2 Fig. Principal component analysis ofPdgenes.The Trinity utility PtR was used to conduct principal component analysis on thePdgenes with a minimum expression of 10 FPKM. (PDF)
S1 Table. Read statistics of RNA-Seq samples. (DOCX)
S2 Table. FPKM analysis ofPd-derived transcripts prior to removal. (DOCX)
S4 Table. Differentially expressed genes determined by RSEM and DESeq2 combined with EBSeq and trinotate results.
(XLSX)
S5 Table. Principal component analysis rotation values. (XLSX)
S6 Table. Differentially expressed genes used for GOrilla analysis. (XLSX)
S7 Table. Gene ontology biological process categories over-represented in WNS-affected tissues.
(XLSX)
S8 Table.Pdgene expression estimated by RSEM combined with trinotate results. (XLSX)
S9 Table. MG-RAST analysis of best hit classification for bacterial genes. (XLSX)
S1 Dataset. FASTA file of de novo assembly of little brown myotis transcriptome. (ZIP)
S2 Dataset. RSEM gene expression matrices used for differential host gene expression cal-culations.
(ZIP)
S3 Dataset. FASTA file of genome-guided trinity assembly ofPdtranscriptome. (ZIP)
S4 Dataset. RSEM gene expression matrices forPdtranscripts. (ZIP)
Acknowledgments
We thank Marianne Moore, Sarah Bouboulis, Megan Vodzak, Allen Kurta, Brooke Hines, Larisa Bishop-Boros, and Shayne Lumadue for assistance in collecting samples. James W. McMichael III provided technical assistance and performed thePdqPCR of the WNS-affected samples. Jef-frey Foster performedPdqPCR of the unaffected samples. Cindy Rhone, Gretchen Long, and the rest of the animal care staff at Bucknell University assisted in providing excellent care for the cap-tive animals for this study. We thank Jeremy Dreese and Michael Harvey for technical support with performing bioinformatics analysis on the Bucknell Linux cluster. We acknowledge Brian Haas, Tiago Hori, and the rest of the trinityrnaseq-users mailing list for helpful assistance with data analysis. We thank Scott Hunicke-Smith and the Genome Sequencing and Analysis Facility at the University of Texas at Austin for performing library preparation and RNA sequencing.
Author Contributions
Conceived and designed the experiments: KAF JSJ DMR. Performed the experiments: KAF SMR EJR MJB. Analyzed the data: KAF. Wrote the paper: KAF JSJ TML DMR.
References
2. Blehert DS. (2012) Fungal disease and the developing story of bat white-nose syndrome. PLoS Pathog 8: e1002779. doi:10.1371/journal.ppat.1002779PMID:22829763
3. Blehert DS, Hicks AC, Behr M, Meteyer CU, Berlowski-Zier BM, et al. (2009) Bat white-nose syn-drome: an emerging fungal pathogen? Science 323: 227–227. doi:10.1126/science.1163874PMID:
18974316
4. Lorch JM, Meteyer CU, Behr MJ, Boyles JG, Cryan PM, et al. (2011) Experimental infection of bats
withGeomyces destructanscauses white-nose syndrome. Nature 480: 376–378. doi:10.1038/ nature10590PMID:22031324
5. Warnecke L, Turner JM, Bollinger TK, Lorch JM, Misra V, et al. (2012) Inoculation of bats with Euro-peanGeomyces destructanssupports the novel pathogen hypothesis for the origin of white-nose syn-drome. Proc Natl Acad Sci U S A 109: 6999–7003. doi:10.1073/pnas.1200374109PMID:22493237 6. Verant ML, Boyles JG, Waldrep Jr W, Wibbelt G, Blehert DS. (2012) Temperature-dependent growth
ofGeomyces destructans, the fungus that causes bat white-nose syndrome.
7. Cryan PM, Meteyer CU, Boyles JG, Blehert DS. (2010) Wing pathology of white-nose syndrome in
bats suggests life-threatening disruption of physiology. BMC Biol 8: 135-7007-8-135.
8. Meteyer CU, Buckles EL, Blehert DS, Hicks AC, Green DE, et al. (2009) Histopathologic criteria to confirm white-nose syndrome in bats. Journal of Veterinary Diagnostic Investigation 21: 411–414. PMID:19564488
9. Turner GG, Reeder DM, Coleman JTH. (2011) A five year assessment of mortality and geographic spread of white-nose syndrome in North American bats and a look to the future. Bat Research News 52: 13–27.
10. Frick WF, Puechmaille SJ, Hoyt JR, Nickel BA, Langwig KE, et al. (2015) Disease alters macroecolo-gical patterns of North American bats. Global Ecol Biogeogr 24: 741–749.
11. Frank CL, Michalski A, McDonough AA, Rahimian M, Rudd RJ, et al. (2014) The Resistance of a North American Bat Species (Eptesicus fuscus) to White-Nose Syndrome (WNS). PloS One 9: e113958. doi:10.1371/journal.pone.0113958PMID:25437448
12. Wibbelt G, Puechmaille SJ, Ohlendorf B, Mühldorfer K, Bosch T, et al. (2013) Skin Lesions in Euro-pean Hibernating Bats Associated withGeomyces destructans, the Etiologic Agent of White-Nose Syndrome. PloS One 8: e74105. doi:10.1371/journal.pone.0074105PMID:24023927
13. Bandouchova H, Bartonicka T, Berkova H, Brichta J, Cerny J, et al. (2015)Pseudogymnoascus destructans: evidence of virulent skin invasion for bats under natural conditions, Europe. Transbound-ary and Emerging Diseases 62: 1–5. doi:10.1111/tbed.12282PMID:25268034
14. Reeder DM, Frank CL, Turner GG, Meteyer CU, Kurta A, et al. (2012) Frequent arousal from hiberna-tion linked to severity of infechiberna-tion and mortality in bats with white-nose syndrome. PLoS One 7: e38920. doi:10.1371/journal.pone.0038920PMID:22745688
15. Johnson JS, Reeder DM, McMichael JW III, Meierhofer MB, Stern DW, et al. (2014) Host, pathogen, and environmental characteristics predict white-nose syndrome mortality in captive little brown myotis (Myotis lucifugus). PLoS ONE 9: e112502. doi:10.1371/journal.pone.0112502PMID:25409028 16. Geiser F. (2004) Metabolic rate and body temperature reduction during hibernation and daily torpor.
Annu Rev Physiol 66: 239–274. PMID:14977403
17. Thomas DW, Cloutier D. (1992) Evaporative water loss by hibernating little brown bats,Myotis lucifu-gus. Physiol Zool: 443–456.
18. Thomas DW, Dorais M, Bergeron J. (1990) Winter energy budgets and cost of arousals for hibernating
little brown bats,Myotis lucifugus. J Mammal 71: 475–479.
19. Fuller NW, Reichard JD, Nabhan ML, Fellows SR, Pepin LC, et al. (2011) Free-ranging little brown myotis (Myotis lucifugus) heal from wing damage associated with white-nose syndrome. Ecohealth 8: 154–162. doi:10.1007/s10393-011-0705-yPMID:21922344
20. Cryan PM, Meteyer CU, Blehert DS, Lorch JM, Reeder DM, et al. (2013) Electrolyte depletion in white-nose syndrome bats. J Wildl Dis 49: 398–402. doi:10.7589/2012-04-121PMID:23568916
21. Willis CK, Menzies AK, Boyles JG, Wojciechowski MS. (2011) Evaporative water loss is a plausible explanation for mortality of bats from white-nose syndrome. Integr Comp Biol 51: 364–373. doi:10. 1093/icb/icr076PMID:21742778
22. Verant ML, Meteyer CU, Speakman JR, Cryan PM, Lorch JM, et al. (2014) White-nose syndrome initi-ates a cascade of physiologic disturbances in the hibernating bat host. BMC Physiol 14: 10. doi:10. 1186/s12899-014-0010-4PMID:25487871
24. Moore MS, Reichard JD, Murtha TD, Zahedi B, Fallier RM, et al. (2011) Specific alterations in comple-ment protein activity of little brown myotis (Myotis lucifugus) hibernating in white-nose syndrome affected sites. PLoS One 6: e27430. doi:10.1371/journal.pone.0027430PMID:22140440 25. LeibundGut-Landmann S, Wüthrich M, Hohl TM. (2012) Immunity to fungi. Curr Opin Immunol 24:
449–458. doi:10.1016/j.coi.2012.04.007PMID:22613091
26. Brown GD. (2011) Innate antifungal immunity: the key role of phagocytes. Annu Rev Immunol 29: 1.
doi:10.1146/annurev-immunol-030409-101229PMID:20936972
27. Holland SM, DeLeo FR, Elloumi HZ, Hsu AP, Uzel G, et al. (2007) STAT3 mutations in the hyper-IgE
syndrome. N Engl J Med 357: 1608–1619. PMID:17881745
28. Liu L, Okada S, Kong X, Kreins AY, Cypowyj S, et al. (2011) Gain-of-function human STAT1 muta-tions impair IL-17 immunity and underlie chronic mucocutaneous candidiasis. J Exp Med 208: 1635– 1648. doi:10.1084/jem.20110958PMID:21727188
29. Gow NA, van de Veerdonk, Frank L, Brown AJ, Netea MG. (2012)Candida albicansmorphogenesis and host defence: discriminating invasion from colonization. Nature Reviews Microbiology 10: 112– 122.
30. Netea MG, Brown GD, Kullberg BJ, Gow NA. (2008) An integrated model of the recognition of Can-dida albicansby the innate immune system. Nature Reviews Microbiology 6: 67–78. PMID:
18079743
31. Romani L. (2011) Immunity to fungal infections. Nat Rev Immunol 11: 275–288. doi:10.1038/nri2939
PMID:21394104
32. Hernández-Santos N, Gaffen SL. (2012) Th17 cells in immunity toCandida albicans. Cell Host & Microbe 11: 425–435.
33. Kagami S, Rizzo HL, Kurtz SE, Miller LS, Blauvelt A. (2010) IL-23 and IL-17A, but not IL-12 and IL-22, are required for optimal skin host defense againstCandida albicans. J Immunol 185: 5453–5462. doi:
10.4049/jimmunol.1001153PMID:20921529
34. Smeekens SP, Ng A, Kumar V, Johnson MD, Plantinga TS, et al. (2013) Functional genomics identi-fies type I interferon pathway as central for host defense againstCandida albicans. Nature Communi-cations 4: 1342. doi:10.1038/ncomms2343PMID:23299892
35. Blanco JL, Garcia ME. (2008) Immune response to fungal infections. Vet Immunol Immunopathol 125: 47–70. doi:10.1016/j.vetimm.2008.04.020PMID:18565595
36. De Luca A, Zelante T, D'Angelo C, Zagarella S, Fallarino F, et al. (2010) IL-22 defines a novel immune
pathway of antifungal resistance. Mucosal Immunology.
37. Conti HR, Shen F, Nayyar N, Stocum E, Sun JN, et al. (2009) Th17 cells and IL-17 receptor signaling are essential for mucosal host defense against oral candidiasis. J Exp Med 206: 299–311. doi:10.
1084/jem.20081463PMID:19204111
38. Brook CE, Dobson AP. (2015) Bats as‘special’reservoirs for emerging zoonotic pathogens. Trends Microbiol 23: 172–180. doi:10.1016/j.tim.2014.12.004PMID:25572882
39. Cogswell-Hawkinson AC, McGlaughlin ME, Calisher CH, Adams R, Schountz T. (2011) Molecular and phylogenetic characterization of cytokine genes from Seba’s short-tailed bat (Carollia perspicil-lata). Open Immunology Journal 4: 31–39.
40. Iha K, Omatsu T, Watanabe S, Ueda N, Taniguchi S, et al. (2009) Molecular cloning and sequencing of the cDNAs encoding the bat interleukin (IL)-2, IL-4, IL-6, IL-10, IL-12p40, and tumor necrosis factor-alpha. Journal of Veterinary Medical Science 71: 1691–1695. PMID:20046044
41. Zhang G, Cowled C, Shi Z, Huang Z, Bishop-Lilly KA, et al. (2013) Comparative analysis of bat genomes provides insight into the evolution of flight and immunity. Science 339: 456–460. doi:10.
1126/science.1230835PMID:23258410
42. Fites JS, Ramsey JP, Holden WM, Collier SP, Sutherland DM, et al. (2013) The invasive chytrid fun-gus of amphibians paralyzes lymphocyte responses. Science 342: 366–369. doi:10.1126/science. 1243316PMID:24136969
43. Bouma HR, Carey HV, Kroese FG. (2010a) Hibernation: the immune system at rest? J Leukoc Biol 88: 619–624.
44. Bouma HR, Henning RH, Kroese FG, Carey HV. (2012) Hibernation is associated with depression of T-cell independent humoral immune responses in the 13-lined ground squirrel. Dev Comp Immunol.
45. Bouma HR, Strijkstra AM, Boerema AS, Deelman LE, Epema AH, et al. (2010b) Blood cell dynamics
during hibernation in the European Ground Squirrel. Vet Immunol Immunopathol 136: 319–323.