fungal gene expression in infected leaves at the stage has been difficult because very few numbers of fungal cells are present. Using the emerging RNA-Seq technique, which has a wide dynamic range for expression analyses, we analyzed the mixed transcriptome of rice and blast fungus in infected leaves at 24 hours post-inoculation, which is the point when the primary infection hyphae penetrate leaf epidermal cells. We demonstrated that our method detected the gene expression of both the host plant and pathogen simultaneously in the same infected leaf blades in natural infection conditions without any artificial treatments. The upregulation of 240 fungal transcripts encoding putative secreted proteins was observed, suggesting that these candidates of fungal effector genes may play important roles in initial infection processes. The upregulation of transcripts encoding glycosyl hydrolases, cutinases and LysM domain-containing proteins were observed in the blast fungus, whereas pathogenesis-related and phytoalexin biosynthetic genes were upregulated in rice. Furthermore, more drastic changes in expression were observed in the incompatible interactions compared with the compatible ones in both rice and blast fungus at this stage. Our mixed transcriptome analysis is useful for the simultaneous elucidation of the tactics of host plant defense and pathogen attack.
Citation:Kawahara Y, Oono Y, Kanamori H, Matsumoto T, Itoh T, et al. (2012) Simultaneous RNA-Seq Analysis of a Mixed Transcriptome of Rice and Blast Fungus Interaction. PLoS ONE 7(11): e49423. doi:10.1371/journal.pone.0049423
Editor:Yong-Hwan Lee, Seoul National University, Republic of Korea
ReceivedMay 14, 2012;AcceptedOctober 8, 2012;PublishedNovember 6, 2012
Copyright:ß2012 Kawahara et al. This is an open-access article distributed under the terms of the Creative Commons Attribution License, which permits
unrestricted use, distribution, and reproduction in any medium, provided the original author and source are credited.
Funding:This work was supported by Genomics for Agricultural Innovation (RTR0001) from the Ministry of Agriculture, Forestry and Fisheries (MAFF) of Japan. The funders had no role in study design, data collection and analysis, decision to publish, or preparation of the manuscript.
Competing Interests:The authors have declared that no competing interests exist.
* E-mail: [email protected]
Introduction
Rice is one of the world’s most important food crops, and it feeds over 50% of the world’s population. A map-based, finished quality sequence of Oryza sativa L. ssp. japonica cv. Nipponbare was determined by the International Rice Genome Sequencing Project (IRGSP) in 2005 [1]. The curated genome annotation has continued to be provided by the Rice Annotation Project (RAP) and is available in the RAP-DB [2]. A filamentous fungus,Magnaporthe oryzae, which is the causal agent of blast disease in rice, is the most serious pathogen affecting rice worldwide. Infection by the rice blast fungus causes annual yield losses averaging upwards of 30% [3]. The genome of the rice blast fungus strain ‘‘70–15’’ was determined in 2005 [4]. Automated gene predictions and annotations were performed by the Broad Institute, and the latest version of the data (MG6) is available on the website http://www.broadinstitute.org/annotation/genome/ magnaporthe_grisea/MultiHome.html. In addition, National Insti-tute of Agrobiological Sciences (NIAS) constructed cDNA libraries of M. oryzaestrain Guy11 and performed gene annotation based on the mate-pair EST sequences of the cDNA clones and ab initio gene prediction [5]. The availability of reference genome sequences and
gene annotation enabled us to useO. sativaandM. oryzaeas models to study the molecular interactions between the host plant and its pathogen.
subset of fungal genes or an expressed gene catalog in which expression levels were not provided. Furthermore, they focused on gene expression levels at a relatively late infection stage (3–10 days post-inoculation (dpi)), which was too late to investigate the early infection processes that are important during its establishment. Because only a small number of plant cells are invaded, and it is difficult to detect the gene expression levels of the fungal genes in the infected tissue, the ascertainment of the genome-wide gene expression profile and elucidation of the molecular mechanisms of blast fungus invasion at the early infection stage in infected rice leaves have remained poorly understood.
The expression profiles of both the rice and blast fungus genes in a spatially and temporally equivalent biological sample could help us to understand the molecular mechanisms of both rice defense and blast fungus infection strategies simultaneously. To date, a few studies have analyzed the genome-wide expression profiles of both the rice and blast fungus genes simultaneously in the same infected sample. Matsumuraet al. [15] analyzed infected leaves at 10 dpi to obtain a sufficient amount of fungal RNA for the SuperSAGE analysis. As previously mentioned, this is too late of a stage to investigate the molecular interaction that is involved in the establishment of infection. Mosqueraet al. [16] examined both rice and fungal gene expression profiles at a relatively early infection stage (36 hours post-inoculation (hpi)) using oligonucle-otide microarray technology. However, the detection of fungal gene expression in infected tissues using microarrays requires tough mechanical sample manipulations, such as the fluorescent labeling of invaded fungal cells and chopped, infected rice cells by laser microdissection. These sample manipulations may have had outside effects on the host plant and pathogen cells, and it is difficult to observed infection-responsive reactions in a natural state. Furthermore, in that study, infected leaf sheaths were used as the host plant samples, but plant cells on the surfaces of leaf blades are invaded by blast fungus in nature. Thus, it is necessary to obtain the responsive expression profiles of the infected leaf blades to understand the true molecular interactions between rice and blast fungus.
Emerging massively parallel sequencing techniques enable the rapid acquisition of huge amounts of genomic or transcriptomic sequence data at relatively low costs [17]. To date, microarray techniques have been predominantly used for gene expression analyses particularly for well-studied model organisms for which typically high-quality gene annotation data were available. Compared with microarrays, RNA-Seq is known to have a wider dynamic range, higher technical reproducibility, and provide a better estimate of absolute expression levels [18,19]. Although two NGS methodologies, RNA-Seq and high throughput-SuperSAGE (HT-SuperSAGE), provide very similar levels of sensitivity from the points of view of the sequencing cost and accuracies of the measured expression levels, HT-SuperSAGE is much more cost-effective [12]. However, the expression profiles of unannotated transcripts cannot be analyzed by microarrays because the probes on microarray chips are designed based on annotation data. HT-SuperSAGE also requires gene structure information to convert tag counts to corresponding transcript expression levels and does not provide entire gene structures. However, RNA-Seq can measure the expression levels of all transcripts without prior knowledge because entire RNA molecules can be sequenced, and all sequence information from the transcribed regions can be obtained. Recently, several transcript structure prediction methods that are based on reference genomes and RNA-Seq data have been developed, and unannotated transcript structures can be constructed with their expression levels using the programs [20– 22].
To elucidate the comprehensive gene expression profiles for both the host plant and its fungal pathogen simultaneously, we developed a workflow to analyze the mixed transcriptome of rice and blast fungus that was obtained from infected rice leaf blades using RNA-Seq. Here, we report that this method can detect both rice and in planta fungal gene expression, and large numbers of rice and fungal transcripts are responding to infection at 24 hpi. At this stage, approximately 50% of the intact appressorium succeeded in the primarily penetration, while less than 1% of those extended hyphae into more than one cell of epidermis of leaf sheath (unpublished data). Many pathogenesis-related genes, WRKY type transcription factors and phytoalexin biosynthetic genes showed strong responsive expression in rice. For blast fungus, approximately 38% of the responsive transcripts encoded putative secretory proteins, suggesting that they are good candidate fungal effectors that are involved in attacking a host plant. Using compatible (Ina86-137) and incompatible (P91-15B) fungal strains as pathogens, we revealed the differential expression profiles of the compatible and incompatible interactions and observed that the responsive gene expression was more drastic in the incompatible interaction. Using the RNA-Seq method, we observed the transcriptional activity on the genome at the nucleotide level, and information describing all transcribed regions and expression profiles before and after the infection are available for both rice and blast fungus from the Plant-Pathogen Mixed RNA-Seq Database http://anise.dna.affrc.go.jp/ppmix/.
Results and Discussion
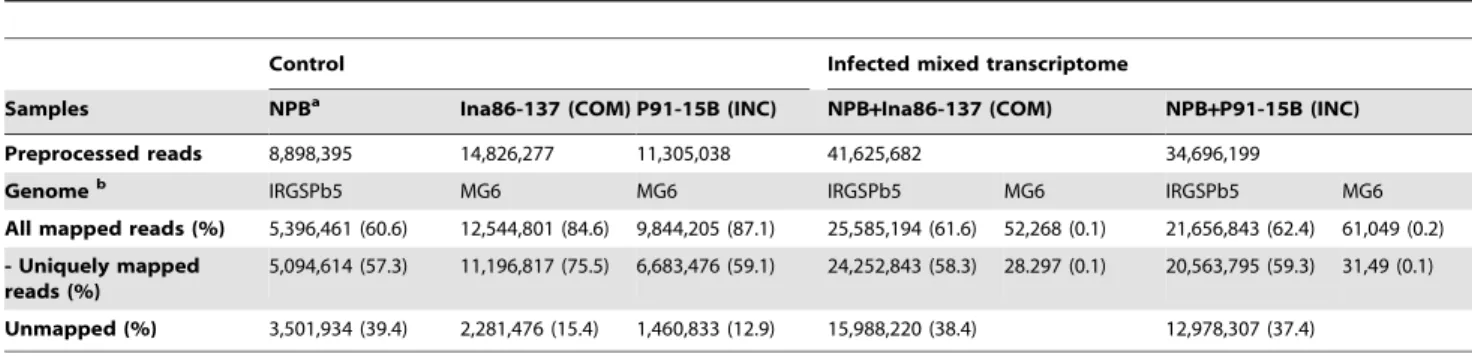
At the initial stage (24 hpi) of rice and blast fungus infection, because most plant cells in the leaf blades have not yet encountered the fungal invasion, the amount of fungal cells that are present in the plant cells is expected to be very low compared with that of the rice leaf cells. Therefore, the detection of fungal transcripts in a mixed transcriptome that has been isolated from infected leaves is expected to be very difficult. The mapping results of the RNA-Seq reads could provide rough estimates of the ratios of rice and fungal RNA concentrations in the mixed transcriptome samples because the number of RNA-Seq reads should be correlated with the amount of RNA molecules in a sample. Indeed, for the mixed transcriptome, 61.5–62.4% of the prepro-cessed reads mapped to the host rice genome but only 0.1–0.2% mapped to the fungal genome. Based on the mapping results, the
ratios of the numbers of mapped reads to the rice and fungal genomes are 490:1 (25,585,194:52,268) for NPB+Ina86-137 and 355:1 (21,656,843:61,049) for NPB+P91-15B (Table 1), indicating an estimated frequency of fungal transcripts in the mixed transcriptome of 0.2–0.3%. The fungal RNA concentrations in the mixed transcriptome were assessed by quantitative Real-Time RT-PCR of artificial mixed transcriptome samples with several concentration gradients (Figure 2). As a result, the concentration of the fungal RNAs in the samples were estimated to be between 0– 0.5%. These frequencies were consistent with estimates that were based on the mapping rates (0.2–0.3%). Fungal RNA concentra-tions will increase throughout the course of infection, and the detection of fungal RNAs in infected samples should be easier in the later infection stages. Still, a large amount of reads could not Figure 1. Schematic representation of RNA-seq analysis of mixed transcriptome obtained from blast fungus-infected rice leaves. First, mRNA were extracted from theOryza sativassp.japonicacv. Nipponbare (Pia) rice leaf blades 24 hours after water treatment (rice, control) and inoculation (rice+blast fungus, infected, 24hpi), and also from conidial suspensions of the compatible and incompatible blast strains (blast fungus, control). RNA-Seq were conducted for each sample using the illumine GAIIx sequencer. In the preprocessing of reads, low quality bases, adapter sequences, rRNA sequences and too short reads (,20 bp) were removed. For the rice analysis, all of the preprocessed reads were mapped to the fungal genome to filter out contaminated fungal reads. For the fungal analysis, contaminated rice reads were removed by mapping all of the reads against the rice genome. Finally, all of the filtered reads were mapped to the reference genomes by TopHat and transcript structures are predicted by Cufflinks. For each rice and fungal transcript, expression levels were estimated using the numbers of uniquely mapped reads to the transcript structures.
be mapped to the reference genomes (12.9–39.4%). There could be several reasons for the unmapped reads, such as sequencing errors, failure to remove the adapter, the presence of contaminat-ed sequences that could not be detectcontaminat-ed in the filtering processes and an incomplete of the reference genome. In particular, for the fungal transcriptome, because we used the fungal strains (Ina86-137 and P91-15B) that differ from the reference strain (70–15), the unmapped reads may be derived from strain-specific or highly divergent transcribed regions.
Estimation of expression profiles and detection of infection-responsive rice and fungal transcripts at the initial infection stage
In principle, the number of RNA-Seq reads should be correlated with the amount of RNA molecules in a sample. By using the normalized number of reads overlapped with the
transcribed regions, we can estimate the expression levels of each transcript. Here, we calculated the normalized expression levels (RPKM: reads per kilobase exon model per million mapped reads) of each rice and fungal transcript using uniquely mapped reads onto the genomes [24]. Two biological replicates were available for the mixed transcriptome samples. To evaluate the reproduc-ibility and biological variations of the mixed transcriptome analysis, we first calculated the RPKMs of the annotated rice and fungal transcripts for each biological replicate separately and compared them between replicates. The resulting Pearson’s correlation coefficients (R) were significantly high (R= 0.81–0.99; P,0.001) between the replicates for both the rice and blast fungus (Figure S1). Compared with the correlation coefficients for the rice transcripts (R= 0.89–0.99;P,0.001), those for the blast transcripts (R= 0.81–0.83; P,0.001) were relatively lower. The lower correlations were due to the smaller number of mapped reads for the blast fungus. To increase the accuracies of the measured expression levels for further analyses, data from two biological replicates were merged, and RPKM values were calculated based on the merged dataset.
The estimations of the expression levels revealed that known rice transcripts have mean (6SD) expression levels (RPKMs) of 24.36233.4, 23.16163.3 21.16111.6 for the control (NPB), compatible (NPB+Ina86-137) and incompatible (NPB+P91-15B) interaction samples, respectively (Figure 3). The mean values (6SD) of the RPKMs for the fungal transcripts were 57.26837.5, 52.96253.2, 48.06225.4 and 49.66161.7 for the compatible (Ina86-137), incompatible (P91-15B) control, compatible (NPB+Ina86-137) and incompatible (NPB+P91-15B) interaction samples, respectively (Figure 3). For the mixed transcriptome samples, the minimum RPKM value among the fungal annotated transcripts was 2.59, which was much larger than that of rice (0.01), suggesting that lowly expressed transcripts may be missed to detect for the blast fungus. Such low levels of in planta fungal gene expression could not be detected by the oligonucleotide micro-array due to the lower detection sensitivity; however, in principle, RNA-Seq can detect any level of expression if sufficient sequencing data is available. Substantial progress in sequencing technology will overcome the issues of sequencing throughput and the sensitivity of RNA-Seq analyses in the near future. However, although there were many undetectable transcripts with low expression levels, the expression levels of most genes (60.2%; 10,142/16,856 fungal annotated transcripts) were detected (RPKM.0) in this RNA-Seq analysis.
To examine whether the two fungal strains (Ina86-137 and P91-15B) and the reference strain (70–15) are similar at the molecular Table 1.Mapping results of RNA-Seq reads.
Control Infected mixed transcriptome
Samples NPBa Ina86-137 (COM) P91-15B (INC) NPB
+Ina86-137 (COM) NPB+P91-15B (INC)
Preprocessed reads 8,898,395 14,826,277 11,305,038 41,625,682 34,696,199
Genomeb IRGSPb5 MG6 MG6 IRGSPb5 MG6 IRGSPb5 MG6
All mapped reads (%) 5,396,461 (60.6) 12,544,801 (84.6) 9,844,205 (87.1) 25,585,194 (61.6) 52,268 (0.1) 21,656,843 (62.4) 61,049 (0.2)
- Uniquely mapped reads (%)
5,094,614 (57.3) 11,196,817 (75.5) 6,683,476 (59.1) 24,252,843 (58.3) 28.297 (0.1) 20,563,795 (59.3) 31,49 (0.1)
Unmapped (%) 3,501,934 (39.4) 2,281,476 (15.4) 1,460,833 (12.9) 15,988,220 (38.4) 12,978,307 (37.4)
aNPB: control sample ofOryza sativassp.japonicacv. Nipponbare.
bReference genome sequences used for mapping; IRGSPb5:Oryza sativassp.japonicacv. Nipponbare IRGSP build 5 genome, MG6: Magnaporthe grisea 70–15 release 6 genome.
doi:10.1371/journal.pone.0049423.t001
Figure 2. quantitative Real-Time RT-PCR experiments to assess fungal RNA contents in mixed transcriptome samples. The presence of fungal RNA in the mixed transcriptome samples (COM: compatible, INC: incompatible interactions) was examined by qRT-PCR using artificial mixed transcriptome samples at several fungal RNA concentrations (0, 0.5, 1, 3, 5, 10, 20, 30, 40 and 100%). Crossing point (CP) values represent the point at which the amount of the amplified fungal actin reached a fixed threshold. High CP values indicate low abundance of fungal RNAs. The means and standard errors of CP values of three technical replicates are shown for each sample.
level, we estimated the nucleotide differences between the strains using uniquely mapped RNA-Seq reads on the reference genome. As a result, the number of nucleotide substitution was estimated to be 0.00018 for both Ina86-137 and P91-15B. Therefore, all the three strains are quite similar at the transcribed sequence level. Furthermore, the distributions of RPKM values were almost identical between the two fungal strains in the conidial condition (Figure S2). Taken together, these results suggest that the evolutionary divergence of the fungal strains did not lead to biased estimations of gene expression levels.
The overall trends of changes in expression levels that are caused by fungal infection could be regarded as correlated to the RPKM distributions of the control and infected samples. For rice, a higher correlation of expression levels between the control and compatible interaction (NPB vs. NPB+Ina86-137; R= 0.95; P,0.001) was observed compared with that between the control and incompatible interaction (NPB vs. NPB+P91-15B; R= 0.47; P,0.001) (Figure 3A–B). The correlation of the expression levels of the fungal transcripts indicated that more stable and similar expression profiles existed between the two different fungal strains in the conidial condition (Ina86-137 vs. P91-15B; R= 0.65; P,0.001) compared with those that were infected (NPB+ Ina86-137 vs. NPB+P91-15B; R= 0.59; P,0.001). In the comparisons
between the control and infected samples, the compatible interaction (Ina86-137 vs. NPB+Ina86-137; R= 0.55; P,0.001) showed a higher correlation than the incompatible interaction (P91-15B vs. NPB+P91-15B; R= 0.27; P,0.001) (Figure 3C–D). Taken together, these results indicate that in both the rice and blast fungus, the changes in expression levels that are caused by rice-fungal infection are greater in the incompatible than the compatible interaction. This suggests that the responsive reactions that are involved in the plant defense and pathogen attack are more active in the incompatible interaction.
Compared with the microarray and SuperSAGE techniques, the biggest advantage of the RNA-Seq technique is that it can predict exon-intron structures and their expression levels concur-rently without any prior knowledge. Using the Cufflinks program, we predicted novel unannotated rice and fungal transcripts that did not overlap with any annotated transcripts. As a result, 6,223 and 2,341 unannotated transcribed regions of 100 bp or longer in length were predicted in the rice and blast fungus genomes, respectively. We calculated expression levels for each unannotated transcript using the same method as that for known transcripts. The mean (6SD) expression levels of the unannotated rice transcripts were 3.2617.4, 3.1620.2 and 3.0616.5 for the control, compatible and incompatible interaction samples, respec-Figure 3. Distributions of expression levels for rice and fungal annotated transcripts.The distributions of the expression levels (log2
RPKMs) are shown for rice (A, B) and blast fungus (C, D). For rice, (A) the control (NPB) and infected (NPB+Ina86-137) samples in the compatible interaction and (B) the control (NPB) and infected (NPB+P91-15B) samples in the incompatible interaction are compared. For blast fungus, (C) the control (Ina86-137) and infected (NPB+Ina86-137) samples in the compatible interaction and (D) the control (P91-15B) and infected (NPB+P91-15B) samples in the incompatible interaction are compared. Significantly differentially expressed transcripts between the control and infected conditions are plotted in colors (red: upregulated, blue: downregulated). Pearson’s correlation coefficients (R2) between replicates are presented.
tively. For the unannotated fungal transcripts, the mean expression levels were 33.86718.9, 108.362525.0, 135.363250.2 and 98.262247.2 for the compatible, incompatible control, compatible and incompatible interaction samples, respectively. The unanno-tated rice transcripts may have had relatively lower expression levels and may be specifically expressed in certain conditions, because the rice annotation is quite enriched, and the majority of commonly expressed transcribed regions have already been discovered. The large variations in the expression levels of the fungal unannotated transcripts were partially due to the same reasons as those of rice. Furthermore, highly expressed rRNA may still be contaminating the predictions because blast fungus rRNA sequences were not fully available, and yeast rRNA sequences were used in the filtering process instead.
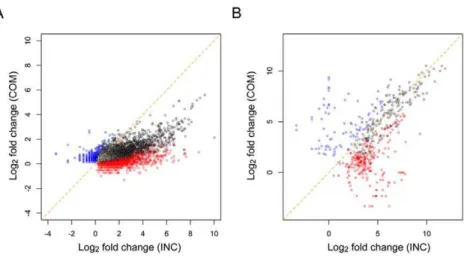
To find the differentially expressed rice and fungal transcripts between the control and infected conditions, we comprehensively compared the expression levels of each transcript between the two conditions and conducted a statistical test, the G-test, for each comparison with a 0.1% false discovery rate (FDR) [25]. As a result, 15,616 (30.0%) and 872 (5.2%) transcripts showed significant differential expression in the annotated rice and fungal transcripts, respectively (Table 2; all differentially expressed annotated transcripts are listed in Table S1, S2). From the Cufflinks-predicted unannotated transcripts, 432 (6.9%) rice and 17 (0.7%) fungal transcripts also showed differential expression (Table 2; all differentially expressed unannotated transcripts are listed in Table S3, S4). The infection-responsive differential expression of 5,311 (34.0%) and 234 (26.8%) annotated, and 63 (14.6%) and 6 (35.3%) unannotated transcripts of rice and blast fungus, respectively, were commonly observed in the compatible and incompatible interactions (‘‘Common’’), and the remaining showed different responsive expression profiles between the two interactions (‘‘COM-specific’’ and ‘‘INC-specific’’). Furthermore, larger numbers of transcripts responded to the infection in the incompatible compared with the compatible interaction, and this pattern was commonly observed for both the rice and blast fungus. The fold-changes of the upregulated rice and fungal transcripts were greater in the incompatible interaction even though there were significant commonly upregulated transcripts in both the compatible and incompatible interactions (Figure 4). These observations support the aforementioned drastic infection-respon-sive reactions of the rice and blast fungus in the incompatible interaction. The differential responses of rice defense-related transcripts to the infection of compatible and incompatible fungal strains has been observed using microarray and northern blot analyses [26–28]. However, this is the first report to show the differential response of in planta fungal gene expression between compatible and incompatible interactions at the initial infection stage.
To examine whether the previously reported infection-respon-sive rice and fungal transcripts were detected as differentially expressed in our mixed transcriptome RNA-Seq analysis, the expression levels of several known responsive transcripts were measured by qRT-PCR using gene-specific primers (Table S5). The rice pathogenesis-related proteins PR1 and PR10 were chosen because they have been shown to display strong induction during infection with blast fungus [29,30]. One of rice peroxidase genes, POX22, which was also reported to show induced expression during the infection of Xanthomonas oryzae and Magnaporthe grisea, was also used for validation [26,31]. As a result of both the RNA-Seq and qRT-PCR analyses, PR1, PR10 and POX22 were characterized to be differentially expressed at the initial infection stage (Figure 5). For PR1, no significant difference was observed between the control and compatible interaction at
the 0.1% FDR level. However, at the 1% FDR level, PR1 showed significant differential expression. Furthermore, significantly stronger responsive upregulations were observed in the incompat-ible compared with the compatincompat-ible interaction for all three genes (FDR,0.1%). To confirm the differential expression of well-known fungal-responsive transcripts, we chose members of the BAS family of genes (BAS1, BAS2, BAS3 and BAS4), which have been reported to show responsive expression patterns and encode biotrophy-associated secretory proteins [16]. The upregulation of these fungal genes was confirmed by both RNA-Seq and qRT-PCR (Figure 6). However, the stronger responsive upregulations in the incompatible compared with the compatible interaction as seen in the rice-responsive genes were not observed for the fungal BAS genes. These results suggest that the degree of differential responses between the compatible and incompatible interactions differed among genes and also proved that our mixed transcrip-tome analysis can detect the infection-responsive expressions that has been reported in past studies in both rice and blast fungus even at the initial infection stage.
Responsive expression of rice defense-related genes at the initial infection stage
We detected the infection responsive up-regulation of 8,541 annotated and 210 Cufflinks-predicted unannotated transcripts. Of those, 23 rice-annotated genes with functional annotations showed greater than 150-fold upregulations in their expression levels in either the compatible or incompatible interactions (highly upregulated rice genes; Table 3). Of those, 18 genes showed upregulation in both the compatible and incompatible interac-tions, and the remaining were incompatible-specific upregulated genes. However, compatible-specific, highly elevated upregula-tions were not observed. Furthermore, even for the common highly upregulated genes, the fold changes for the incompatible interaction (average fold change: 280.7) were approximately 22 times greater than those for the compatible interaction (average fold change: 12.9). These results indicate that the rice defense responses against fungal infection were stronger in the incompat-ible interaction at the initial infection stage. During the infection of Xanthomonas oryzae pv. oryzae, it has been reported that rice peroxidase genes show faster responsive expression in the incompatible compared with the compatible interactions [26]. Another study, which used Agilent rice DNA chips (G4138A, Agilent Technologies) with time-series samples at 24 and 48 hpi, reported that the peaks of the responsive expression of rice genes against fungal infection in the compatible interaction were delayed compared with those in the incompatible interaction [27]. However, these studies examined only a limited number of genes. The findings in our comprehensive RNA-Seq analysis indicate that differential inductions of the expression of infection-responsive genes between the compatible and incompatible interactions were commonly observed at the genome-wide level at the initial infection stage.
development of antimicrobial agents [33]. Chitinases are classified into the PR3, 4, 8 and 11 families and are able to bind and hydrolyze chitin in the cell walls of plant pathogens. The expression levels of 24 chitinases were upregulated and most of them were predicted to be putative secretory proteins in our analysis, suggesting that they were secreted outside of cells to degrade the cell walls of pathogens. Glycosyl hydrolases (GHs), which are enzymes that catalyze the hydrolysis of the glycosidic bonds between sugars and other moieties, can be classified into more than 100 families [34]. In particular, b-1,3-glucanases (GH17) catalyze the endo-type hydrolytic cleavage of the 1,3-b -D-glucosidic linkages in b-1,3-glucans and are referred to as pathogenesis-related proteins belonging to the PR2 family [35]. Peroxidase (POX) genes, which are classified into the PR9 family, are known to be induced by pathogen infection, suggesting that they are defense-related proteins [26]. The infection-responsive upregulation of 23 GH17 protein-coding genes, includingb -1,3-glucanases and 40 peroxidase genes, were detected in our analysis. The upregulation of these PR genes indicates that the degradation of the cell wall components (glucans, chitin and proteins) of pathogens is an important defense reaction in rice against fungal pathogens at the initial infection stage.
Major rice diterpene phytoalexins (PAs) are known to be low-molecular-weight compounds that are produced in response to pathogen attack. To date, the accumulation of the PAs after fungal infection has been reported for momilactone A, oryzalexin E, oryzalexin S and phytocassanes A-E in rice. The increased expression levels of genes that are involved in PA biosynthesis were also observed [36]. Here, we found that many genes that are involved in the PA biosynthesis were upregulated at the initial infection stage. The expression levels of OsCPS2 (Os02g0571100) and OsKSL7 (Os02g0570400), which are involved in phytocas-sane A-E synthesis, were upregulated in the incompatible interaction. Moreover, OsCPS4 (Os04g0178300) and OsKSL4 (Os04g0179700), which are involved in the biosynthesis of momilactone A and B also showed incompatible-specific upregu-lation. OsKSL10 (Os12g0491800) and OsKSL8 (Os11g0474800), which are involved in the biosynthesis of oryzalexin A-F and S, showed upregulation in both the compatible and incompatible interactions. However, the fold changes of OsKSL10 and OsKSL8 expression were larger in the incompatible compared with the compatible interaction. Recently, more abundant and rapid phytoalexin accumulations in the resistant compared with the susceptible plant have been reported at 2 dpi [36]. Our results Figure 4. Distribution of fold-changes of rice and fungal significantly upregulated transcripts.The fold-changes (log2) of the significantly
upregulated transcripts in the compatible and incompatible interactions are plotted for (A) rice and (B) blast fungus. The colors represent the types of interactions in which the upregulations occurred (black: Common, blue: COM-specific, red: INC-specific).
doi:10.1371/journal.pone.0049423.g004
Table 2.Number of significant infection-responsive rice and fungal transcripts.
Annotated Cufflinks-predicted unannotated
Upregulated Downregulated Upregulated Downregulated
Ricea
Common 3,310 2,001 26 37
COM-specific 1,329 131 23 9
INC-specific 3,902 4,943 161 176
Blast fungusb
Common 163 71 6 0
COM-specific 108 41 5 0
INC-specific 359 130 2 4
suggested that, when the same rice cultivar, Nipponbare (Pia), is used in our analysis, the stronger induction of the expression of rice phytoalexin biosynthetic genes are observed in the infection of the incompatible fungal strain compared with that of the compatible one at the initial infection stage.
Plants are able to recognize potential microbial pathogens through pathogen-associated molecular patterns (PAMPs) by host sensors, which are known as pattern-recognition receptors (PRRs) that initiate a series of defense responses called PAMP-triggered immunity (PTI) [6]. Mitogen-activated protein kinase (MAPK) cascades are known to play important roles in mediating PAMP signals and also in plant stress responses [37,38]. Several MAPK and MAPK kinase (MAPKK) genes have been characterized in the response of plants to fungal infection [39]. We found that the expression of OsMPK6 (Os06g0154500), which is known to be essential for the chitin elicitor-induced biosynthesis of diterpenoid phytoalexins, was specifically induced in the incompatible interaction. The inductions of the expressions of OsMPK3 (Os03g0285800) and OsMKK4 (Os02g0787300) were observed in both the compatible and incompatible interactions at the initial
infection stage. The hypersensitive response (HR) is a common plant immune response against the infection of pathogens and is a type of programmed cell death. We found that the transcription factor OsNAC4 (Os01g0816100), which plays a role in the initiation of hypersensitive cell death in rice [40], was also upregulated at the initial infection stage. Other transcription factors, including the WRKY family genes, have been suggested to play roles in controlling the transcription of defense-related genes through the W-box in their promoters, which is a key cis-element in defense-related transcriptional regulation [10,41,42]. The upregulated rice transcripts included 41 genes that were annotated as WRKY transcription factors. In particular, the expression levels of WRKY transcription factors 19, 26, 28, 45, 62 and 76 were highly upregulated (.50 fold-change), suggesting that they may play important roles as key regulators in the rice defense response against the infection of blast fungus at the initial infection stage.
One of the biggest advantages of the RNA-Seq technique is that it predicts novel, unannotated transcript structures and their expression levels. The Cufflinks-predicted unannotated rice transcripts included 210 that were upregulated at the initial Figure 5. Confirmation of differential expression of known infection-responsive rice genes by qRT-PCR and RNA-Seq.The expression profiles of known infection-responsive rice genes, (A) PR1, (B) PR10 and (C) POX22, were examined by both qRT-PCR and RNA-Seq techniques. For the qRT-PCR data, the mean6standard errors for the three replicates are represented. The statistically significant differential gene expression between the control (Cont) and infected (Inf) samples for the compatible (COM) and incompatible (INC) interactions was tested by the Student’st-test and G-test for qRT-PRC and RNA-Seq, respectively. The asterisks show the statistical significances (*:P,0.05, **:P,0.01 and ***:P,0.001).
infection stage. Eight of those transcripts encoded putative protein kinase family proteins (Rice_CUFF.34181.1, CUFF.34181.2, Rice_CUFF.2283.1, Rice_CUFF.2282.1, Rice_-CUFF.7414.1, Rice_CUFF.23507.1, Rice_CUFF.28691.1 and Rice_CUFF.7415.1), two were NB-ARC domains that are thought to be involved in disease resistance, including the transcripts Rice_CUFF.6912.1 and Rice_CUFF.26220.2, and one was an oxidoreductase domain containing transcript Rice_-CUFF.28752.2. As described above, our analysis could detect the infection-responsive expression of a large number of genes that are thought to be involved in plant defense against fungal pathogens. Therefore, these unannotated, upregulated transcripts may have important functions in rice defense against pathogen infection. These results strongly suggest that even for the well-annotated rice genome, RNA-Seq is a powerful tool for the detection of unannotated transcripts and the enrichment of functional annotations for not only unannotated but also annotated transcripts.
Responsive expression of fungal effector candidates at the initial infection stage
The infection-responsive upregulation of 630 and 13 fungal annotated and unannotated transcripts were detected, respectively. Of those 35 fungal genes having any functional annotations, showed a greater than 150-fold upregulation in their expression
levels in either the compatible or incompatible interactions (highly upregulated fungal genes; Table 4). These transcripts may play important roles during pathogen attack in the host plant at the initial infection stage.
The genes involved in appressorium development should be included in the upregulated genes, because we compared the fungal gene expression profiles in germinated conidia and infected leaves at 24 hpi. To examine how many upregulated genes were related to appressorium development, we compared our data with 1,696 genes that were upregulated in the process of appressorium development in a previous study [12]. As a result, 29.6% of the upregulated transcripts detected in our RNA-Seq analysis were also upregulated during appressorium development, suggesting that these genes play important roles in the appressorium development.
Rice blast effectors, which are secreted from biotrophic-invasive hyphae at the plant-pathogen interface and suppress the innate immune response, are known to play important roles in the establishment of fungal infection. Through the prediction of signal sequences and the cellular localization of each fungal transcript, we found that a significantly larger number of upregulated transcripts (38.1% = 240/630) encoded putative secreted proteins that may be potential candidates of fungal effectors compared with the non-responsive transcripts (14.3% = 2,285/15,974) (Table 5). In particular, more than half of the highly upregulated genes (54.3% = 19/35) encoded putative secreted proteins. This suggests Figure 6. Confirmation of differential expression of known infection-responsive fungal genes by qRT-PCR and RNA-Seq. The expression profiles of known infection-responsive fungal genes, biotrophy-associated secreted (BAS) proteins (A) 1, (B) 2, (C) 3 and (D) 4, were examined by both qRT-PCR and RNA-Seq techniques. For the qRT-PCR data, the mean6standard errors for the three replicates are represented. The statistically significant differential gene expression between the control (Cont) and infected (Inf) samples for the compatible (COM) and incompatible (INC) interactions were tested by the Student’st-test and G-test for qRT-PRC and RNA-Seq, respectively. The asterisks show the statistical significances (*:P,0.05, **:P,0.01 and ***:P,0.001).
that the upregulation of secreted protein-coding genes is a remarkable feature of fungal attack at the initial infection stage. We also found 69 other highly upregulated fungal genes having no functional annotation in the MgNEST-DB and Broad Magna-porthe grisea Database, which were expected to encode putative secretory genes, suggesting that the functional annotation of the fungal genome was still insufficient and that these genes are good candidates for novel fungal effectors (Table S7).
Two LysM domain-containing intracellular hyphae protein-coding genes, Slp1 (MgP02232 [MGG_10097]) and Slp2 (MgP09192 [MGG_03468]), which were annotated as putative secretory proteins, were found to be upregulated. Recently, it was proposed that fungal LysM effectors play roles in the sequestration of chitin oligosaccharides to suppress PAMP-triggered host immunity [43,44]. Indeed, Slp1 showed binding activity with chitin and was able to suppress the chitin-induced plant immune response [45]. In addition, four MAS3 (Magnaporthe appressoria-specific) protein-coding genes (MgP06228 [MGG_00703],
MgP11266 [MGG_12337], MgP01185 [MGG_04202],
MgA02141 [MGG_00703]), which are essential for the pathoge-nicity of M. oryzaeand highly expressed in the appressoria [46], were up-regulated.
A cuticle, which is composed of an insoluble polymeric structural compound, cutin, protects plant leaf surfaces. One of the functions of the cuticle layer is to act as a physical barrier that
resists penetration by fungal pathogens. Plant pathogenic fungi produce extracellular degradative enzymes that play important roles in pathogenesis. They include cutinase, which hydrolyses cutin, facilitating fungal penetration through the cuticle [47]. Our analysis found that two cutinase genes, MgP04456 [MGG_02393] and MgP00673 [MGG_14095], were upregulated, suggesting that they may play a role in the degradation of plant cuticles at the initial infection stage. Furthermore, five fungal chitinases,
MgP03906 [MGG_04732], MgP03585 [MGG_05533],
MgA00835 [MGG_06594], MgP06906 [MGG_00086] and MgP02656 [MGG_06594] were also upregulated. It has been suggested that in filamentous fungi, chitinases may act during hyphal growth and autolysis [48]. Therefore, the upregulation of these five fungal chitinases may be involved in the control of hyphal growth in planta during the infection.
In a large-scale secretome study using two-dimensional gel electrophoresis coupled with mass spectrometry analysis under nitrogen starvation conditions, which are similar to the conditions that are present during fungal infection, the authors reported that the identified proteins were mainly cell wall hydrolase enzymes, protein and lipid hydrolases and reactive-oxygen-species-detoxify-ing proteins [49]. In our analysis, two phenylacetone
monooxy-genases (MgA00533 [MGG_09323] and MgP06107
[MGG_00824]), three ent-kaurene oxidases (MgP11603 [MGG_08385], MgP06649 [MGG_00300] and MgP01608 Table 3.Highly upregulated (fold change$150) rice genes.
Gene ID Fold change Annotation Secreted
COM INC
Common
Os03g0797500 4.4 1036.3 Similar to Indole-3-glycerol phosphate lyase No
Os01g0615100 48.5 594.1 Similar to Substilin/chymotrypsin-like inhibitor (Proteinase inhibitor) No
Os06g0530600 40.7 449.5 VQ motif containing protein No
Os01g0615050 35.9 372.1 Proteinase inhibitor I13, potato inhibitor I family protein No
Os01g0940700 24.9 274.4 Similar to Glucan endo-1,3-b-glucosidase GII precursor Yes Os12g0555000 10.5 273.0 Similar to Probenazole-inducible protein PBZ1 No
Os12g0628600 22.3 266.6 Similar to Thaumatin-like pathogenesis-related protein 3 precursor Yes
Os12g0555200 9.2 233.5 Similar to Probenazole-inducible protein PBZ1 No
Os08g0509100 12.1 231.9 Similar to Lipoxygenase No
Os12g0437800 4.7 191.0 Similar to MPI (maize protease inhibitor) No
Os01g0816100 12.7 185.9 Similar to NAC domain protein [OsNAC4] No
Os06g0649000 21.9 184.2 Similar to WRKY transcription factor 28 No Os10g0527800 7.2 181.2 Similar to Tau class Glutathione S-transferase protein 3 No
Os11g0530600 2.2 180.0 Similar to Chalcone synthase C2 No
Os05g0427400 6.7 172.4 Similar to Phenylalanine ammonia-lyase No Os12g0448900 10.2 164.1 Similar to Pathogen-inducible alpha-dioxygenase No
Os03g0663500 6.5 154.2 Similar to Osmotin precursor Yes
Os01g0955100 7.8 151.5 Similar to Avr9/Cf-9 rapidly elicited protein 57 No
INC-specific
Os07g0526400 1.9 416.8 Polyketide synthase, type III domain containing protein No
Os07g0526600 1.5 196.5 Alpha/beta hydrolase fold-3 domain containing protein No
Os09g0417600 1.8 188.9 WRKY transcription factor 76 No
Os03g0830500 1.7 180.9 Similar to PGPS/D12 Yes
Os06g0569500 2.2 177.6 Similar to Ent-kaurene oxidase 1 [OsKOL2] Yes
[MGG_03834]), two galactose oxidases (MgP08908 [MGG_10878] and MgP08366 [MGG_12681]), a hydroxyquinol 1,2-dioxygenase (MgA00497 [MGG_03773]) and a 12-oxophyto-dienoate reductase (MgA00148 [MGG_10583]), which are enzymes that belong to the family of oxidoreductases, showed highly up-regulated expression profiles. Furthermore, in addition to the plant defense reaction, many transcripts encoding fungal glycosyl hydrolase family proteins were also highly up-regulated in blast fungus at the initial infection stage, including an endoglu-canase belonging to the glycoside hydrolase family 61 (MgA03201
[MGG_06069]), an endo-1,4-b-xylanase (MgP00996 [MGG_14243, MGG_14244]) and an alpha-mannosidase (MgP06908 [MGG_00084]). It is known that fungi constantly produce several glycosyl hydrolase enzymes that degrade cell wall polysaccharides during cell division, growth and morphogenesis [50]. The expression of glycoside hydrolase proteins was shown to contribute to the degradation of host cell wall polysaccharides, and the soluble oligosaccharides that are produced by glycoside hydrolase digestion were transported to the inside of the fungal cell and metabolized [51]. A large-scale microarray study found
MgP08240 (MGG_15040) 340.3 64.7 cytochrome P450 3A9 Yes
MgP07935 (MGG_02778) 219.1 183.5 Hydrophobic surface binding protein A Yes
MgP06218 (MGG_00715) 260.4 32.9 Similar to Glucose-repressible gene protein (P22151) No
MgP00511 (MGG_09640) 156.2 131.2 alpha-amylase 1 Yes
MgP05331 (MGG_09085) 201.6 73.2 malic acid transport protein No
MgP03306 (MGG_05575) 165.5 107.6 Hydrophobic surface binding protein A Yes
MgP03986 (MGG_05555) 88.2 182.3 xenobiotic compound monooxygenase No
MgP11608 (MGG_08379) 200.7 60.8 cytochrome P450 Yes
MgP11266 (MGG_12337) 190.3 58.4 MAS3 protein Yes
MgP01421 (MGG_03988) 74.0 162.7 Collagen triple helix repeat (20 copies) Yes
COM-specific
MgP00850 (MGG_08498) 575.8 1.0 isotrichodermin C-15 hydroxylase Yes
MgP04809 (MGG_02329) 218.1 4.0 isotrichodermin C-15 hydroxylase No
MgP11597 (MGG_08391) 154.0 30.5 Zinc-binding dehydrogenase No
INC-specific
MgP02232 (MGG_10097) 38.4 715.3 intracellular hyphae protein 1 (LysM domain) Yes
MgP10026 (MGG_08957) 199.0 534.7 Similar to OTU domain-containing protein 1 (Q9CUB6) No
MgP01990 (MGG_09693) 53.4 278.4 BAS2 Yes
MgP05133 (MGG_02212) 72.0 256.1 Hydrophobic surface binding protein A Yes
MgP08325 (MGG_10237) 0.9 288.2 Similar to Ice-structuring glycoprotein (P24856) Yes MgP08339 (MGG_12505) 46.0 204.0 alpha-ketoglutarate-dependent taurine dioxygenase No
MgP11630 (MGG_08356) 54.3 192.6 polysaccharide deacetylase family protein No
MgP08310 (MGG_10254) 8.1 229.8 taurine catabolism dioxygenase TauD No
MgP01674 (MGG_03764) 0.9 220.5 salicylate hydroxylase No
MgP01122 (MGG_04257) 0.9 219.5 secretory lipase family protein Yes
MgP06107 (MGG_00824) 35.9 175.1 phenylacetone monooxygenase No
MgP07676 (MGG_03036) 46.4 163.1 NmrA-like family No
MgP07648 (MGG_14179) 29.5 172.1 Ubiquitin 3 binding protein But2 C-terminal domain Ys
MgP09137 (MGG_03421) 1.0 181.4 Phosphotransferase enzyme family No
MgP01647 (MGG_03793) 1.0 164.9 2,3-dihydroxybenzoic acid decarboxylase No
that a group of genes encoding enzymes that are involved in cell wall degradation, glucan mobilization and cell wall glycoprotein processing were upregulated in appressorium induction and maturation [11]. Taken together, these results suggest that glycosyl hydrolase family proteins play important roles in host cell wall degradation and appressorium formation at the initial infection stage. In addition, in our RNA-Seq analysis, the upregulation of glycosyl hydrolase-encoding transcripts was commonly observed in rice and blast fungus, suggesting that the enzymes that are involved in cell wall degradation play important roles in both plant defense and pathogen attack.
There were six transcripts encoding HsbA (hydrophobic surface binding protein A) domain-containing proteins (MgP07935
[MGG_02778], MgP11632 [MGG_08354], MgP03306
[MGG_05575], MgP05133 [MGG_02212], MgP00995
[MGG_11009] and MgP07089 [MGG_09460]) in the fungal responsive transcripts. It was reported thatAspergillus oryzaeHsbA adsorbed to hydrophobic PBSA surfaces in the presence of NaCl or CaCl2and promoted polybutylen succinate-co-adipate (PBSA)
degradation via the CutL1 polyesterase [52]. Our results suggested that Magnaporthe oryzae may function in the biodegradation of polymers and be used for fungal biodegradation.
Of all upregulated fungal transcripts, 278 (44.1%) had no meaningful functional annotation in the current databases. These transcripts may play some roles during the initial infection stage of rice with blast fungus. Furthermore, 13 Cufflinks-predicted fungal unannotated transcripts were upregulated. Of those, two tran-scripts were annotated as putative secreted protein-coding transcripts in our analysis, suggesting that they may be candidate novel fungal effectors.
Conclusions
Using RNA-Seq, we have revealed the expression profiles of both rice and blast fungus simultaneously in rice-infected leaf blades at the initial infection stage (24 hpi). This analysis provided comprehensive infection-responsive expression profiles for both rice and fungal transcripts that may interact at precise moments and locations. We found that 16,048 rice and 889 fungal transcripts, including 432 and 17 unannotated ones, respectively, showed infection-responsive expression. These findings provide us with knowledge regarding the molecular basis of the interaction of rice and blast fungus at the initial infection stage (Figure 7). In addition, we found unannotated infection-responsive genes that may play roles in plant defense and pathogen attack. Using two different types of fungal strains, we revealed that the differential responsive expression patterns between the compatible and
incompatible interactions and more drastic responsive reactions in the incompatible interaction were common features of both rice and blast fungus at the initial infection stage. To reveal the responsive expression profile more precisely through the infection stages, additional time-course samples will be needed. Further-more, this RNA-Seq analysis has provided information regarding transcriptional activity at the nucleotide level, unannotated novel transcript structures and expression profiles at the initial infection stage for both rice and blast fungus using the Plant-Pathogen Mixed RNA-Seq Database (http://anise.dna.affrc.go.jp/ppmix/). This information is valuable, particularly for the blast fungus research community, because the fungal genome still has relatively poor functional annotations. Our research provides a powerful tool for the comprehensive mixed transcriptome analysis of various combinations of host plants and pathogens.
Materials and Methods
Preparation of control and infected samples for host plants and pathogens
Oryza sativaL. ssp.japonicacv. Nipponbare carrying the rice blast resistance gene, Pia, was used as the host plants. The rice blast fungusMagnaporthe oryzae field isolates, P91-15B (race 001.0) and Ina86-137 (race 007.0, MAFF 101511), were used as the compatible and incompatible pathogens against Nipponbare (NPB), respectively. The fungal strains were cultured on oatmeal agar plates at 26uC. Seedlings of rice were grown hydroponically in a nutrient solution for 3 weeks as described previously [53]. The fourth leaves of intact plants were sprayed with the conidial suspensions. The fourth leaves of the inoculated plants were dissected at 24 hpi and used as infected samples (NPB+P91-15B and NPB+Ina86-137). For the rice control sample (NPB), the fourth leaves were dissected at 24 hpi with distilled and sterile water. All samples were frozen in liquid nitrogen immediately after collection and stored at -80uC. For the blast control samples, conidia of both fungal isolates were incubated for 1 hour at room temperature to allow germination followed by RNA extraction. At this time point, most of the conidia (76–87%) were germinated.
RNA extraction, mRNA-seq library construction and sequencing
For all samples, total RNAs were extracted using TRIzolH reagent (Life Technologies, Rockville, MD, USA). Total mRNAs were isolated by oligo(dT) selection using DynalHmagnetic beads (Invitrogen). Double-stranded cDNA molecules were generated using random hexadeoxynucleotide primers and then sequenced Table 5.Numbers of fungal putative secretory protein-coding genes for each differential expression category.
Category Number of putative secreted proteins (%) Significancea
Blast fungus, upregulation
- Common 94 (57.7) **
- COM-specific 51 (47.2) **
- INC-specific 95 (26.5) **
Blast fungus, downregulation
- Common 22 (31.0) **
- COM-specific 7 (17.1)
-- INC--specific 19 (14.6)
using the illumina (San Diego, CA) mRNA-Seq single-end protocol on a Genome Analyzer IIx with 76 cycles.
Preprocessing and mapping of illumina reads
In total, 11,106,935, 11,718,807, 14,695,841, 41,610,361 and 50,942,135 single-end reads of 76 bp in length were obtained from the NPB, P91-15B, Ina86-137, NPB+P91-15B and NPB+ Ina86-137 samples, respectively. All of the primary sequencing data can be found in the DDBJ Sequence Read Archive (DRA) under the accession number DRA000542. Using an in-house program, low quality bases (,Q15) were trimmed out from both the 59- and 39 -ends of reads until a stretch of 3 bp or more of high quality ($Q15) bases appeared. Contaminated illumina adapter
sequenc-es (59P-GATCGGAAGAGCGGTTCAGCAGGAATGCCGAG)
were also trimmed out using a python script ‘‘cutadapt’’ (ver. 0.9.4) [54]. Rice and fungal reads derived from ribosomal RNAs (rRNAs) were removed by the mapping of all reads against rice rRNA sequences in the RAP-DB and yeast rRNA sequences (RDN18-1, RDN18-2, RDN25-1, RDN25-2, 1, RDN37-2, RDN5-1, RDN5-RDN37-2, RDN5-3, RDN5-4, RDN5-5, RDN5-6, RDN58-1 and RDN58-2) in the Saccharomyces Genome Database (SGD), respectively, using the Bowtie program (ver. 0.12.7) with the default parameters. Additionally, reads that were too short in length (,20 bp) were discarded after the aforemen-tioned processes. At the final step of read preprocessing, to avoid the contamination of reads from the interaction partners (which were rice for blast fungus and vice versa), we mapped all of the reads against the reference genome of the interaction partner (filtering contamination step in Figure 1). Next, the remaining unmapped non-blast and non-rice reads were used to examine the expression profiles of rice and blast fungus, respectively.
Measurement of gene expression levels and detection of novel unannotated transcripts
Annotated rice transcripts (52,053 transcripts) on the IRGSP build5 reference genome were downloaded from the RAP-DB as of June 1st, 2011. For blast fungus, two different annotation datasets on the Magnaporthe grisea Assembly release 6 were downloaded from the Magnaporthe grisea Database at the Broad Institute [4] and Magnaporthe grisea NIAS EST Database (MgNEST-DB) at National Institute of Agrobiological Sciences [5]. To construct a unified fungal transcript dataset, we merged all of the transcripts in the MgNEST-DB (16,257 transcripts) with those in the Magnaporthe grisea Database that did not overlap with any of the MgNEST-DB transcripts (599 transcripts).
A series of programs, including Bowtie, TopHat (ver. 1.3.0) and Cufflinks (ver. 1.0.3), were used to map reads against reference genomes and predict transcript structures based on the RNA-Seq data. Cufflinks-predicted transcripts that did not overlap with any other annotated transcripts were used as the novel unannotated transcripts. The gene expression levels for each annotated and novel unannotated transcript were estimated as the number of reads per kilobase of exon model per million mapped reads (RPKM) using only uniquely mapped reads in exonic regions. The significantly differentially expressed transcripts between the control and infected samples were detected using the G-test at the 0.1% significance level. The FDR [25] was used to maintain the significance level at 0.1%. Fold changes of expression levels between samples were calculated after adding one to each RPKM value to avoid division by zero.
Functional annotation for annotated and novel unannotated transcripts
To infer the molecular functions of the rice and fungal novel unannotated transcripts, we performed homology searches against the protein databases (Swiss-Prot entries in UniProt release Figure 7. Overview of rice plant defense and blast fungus pathogen attack at the initial infection stage.
2011_1 [55], and validated and reviewed protein entries in RefSeq release 45 [56]) using the BLASTx (ver. 2.2.24) program with the following parameters: -e 1e-2. Because the unified fungal transcripts were derived from two different data sources, we also conducted a homology search for all of the fungal annotated transcripts to conduct an annotation using the same criteria. Putative protein-coding sequences for each novel unannotated transcript were predicted by the getorf program in the EMBOSS package (ver. 5.0.0) [57]. The longest ORF sequences ($30aa) were used for further analyses. To assign further functional information to the rice and fungal protein-coding transcripts, we conducted a functional domain search using the Pfam database release 25.0 [58] and the ‘‘pfam_scan.pl’’ script, and then gene ontology terms were assigned to each transcripts using the pfam2go conversion table that is provided on the Gene Ontology website (http://www.geneontology.org/). To identify the tran-scripts encoding putative secretory proteins, signal peptides were predicted by SignalP 3.0 [59], and cellular localizations were predicted by TargetP 1.1 [60] and WoLFPSORT ver. 0.2 [61] for each transcript. Proteins that were predicted as secretory proteins by SignalP and also predicted as secretory pathways or extracellular localized proteins by TargetP and WoLFPSORT, respectively, were considered to be putative secretory proteins.
Estimation of the fungal RNA concentrations in the mixed transcriptome samples by quantitative Real-Time RT-PCR (qRT-PCR)
cDNA was synthesized using 1mg of the total RNA of the mixed transcriptome samples from infected leaves and the artificial mixed transcriptome samples (0, 0.5, 1, 3, 5, 10, 20, 30, 40 and 100% fungal RNA) by the SuperScriptH III First-Strand Synthesis System (Invitrogen, Carlsbad, CA, USA) after DNase I (TaKaRa, Shiga, Japan) treatment. The cDNAs were amplified using gene-specific primers that were designed for the fungal actin genes (Table S5). qRT-PCR experiments were performed with three technical replicates for each sample in 20ml reaction mixtures containing 2x SYBR Master Mix and 1ml of 1:10 diluted cDNA template with gene-specific primers (Table S5) using the Light-Cycler 480 system and its quantification software (Roche, Basel, Switzerland). By comparing the crossing point (CP) values of the mixed transcriptome samples with those of each artificial control sample, the amounts of fungal RNA were estimated.
Confirmation of the infection-responsive expression profiles by qRT-PCR
To confirm the infection-responsive expression profiles for the known rice and fungal genes, we performed qRT-PCR experi-ments using the Transcriptor First-Strand cDNA Synthesis Kit (Roche, Basel, Switzerland), in which 4mg of the total RNA samples were reverse transcribed in a 20ml reaction mixture following DNase I treatment. qRT-PCR was also performed using three technical replicates for each gene in 20ml reaction mixtures containing 2x SYBR Master Mix and 1ml of 1:10 diluted cDNA template with gene-specific primers (Table S5) using the Light-Cycler 480 system and its quantification software (Roche, Basel,
Switzerland). The detection threshold cycle for each reaction was normalized against the expression levels of the rice ubiquitin1 and fungal actin genes (Table S5).
Supporting Information
Figure S1 Correlation of RPKM distribution between two biological replicates for mixed transcriptome samples. Comparisons of estimated RPKM distributions be-tween biological replicates for (A) rice compatible, (B) rice incompatible, (C) fungal compatible and (D) fungal incompatible interactions. Pearson’s correlation coefficients (R2) between replicates and statistical significance levels are presented. (TIF)
Figure S2 Cumulative curves of RPKM values for gene expressions of two fungal strains in the conidial conditions.
(TIF)
Table S1 Expression profiles and functional annota-tions of infection-responsive rice annotated transcripts.
(XLSX)
Table S2 Expression profiles and functional annota-tions of infection-responsive fungal annotated tran-scripts.
(XLSX)
Table S3 Expression profiles and functional annota-tions of infection-responsive rice Cufflinks-predicted unannotated transcripts.
(XLSX)
Table S4 Expression profiles and functional annota-tions of infection-responsive fungal Cufflinks-predicted unannotated transcripts.
(XLSX)
Table S5 Primer sequences for RT-PCR experiments.
(XLSX)
Table S6 Upregulated rice pathogenesis-related genes.
(XLSX)
Table S7 Highly upregulated candidate fungal effec-tors.
(XLSX)
Acknowledgments
The authors are grateful to Drs Yoko Nishizawa and Naoki Yokotani of National Institute of Agrobiological Sciences for valuable discussions and providing the results of leaf sheath assay, respectively.
Author Contributions
Conceived and designed the experiments: YK TM TI EM. Performed the experiments: YK YO HK EM. Analyzed the data: YK YO. Wrote the paper: YK.
References
1. International Rice Genome Sequencing Project (2005) The Map-Based Sequence of the Rice Genome. Nature 436: 793–800.
2. Tanaka T, Antonio BA, Kikuchi S, Matsumoto T, Nagamura Y, et al. (2008) The Rice Annotation Project Database (RAP-DB): 2008 update. Nucleic Acids Res 36: D1028–D1033.
3. Skamnioti P, Gurr SJ (2009) Against the grain: safeguarding rice from rice blast disease. Trends Biotechnol 27: 141–150.
4. Dean RA, Talbot NJ, Ebbole DJ, Farman ML, Mitchell TK, et al. (2005) The genome sequence of the rice blast fungus Magnaporthe grisea. Nature 434: 980– 986.
14. Kim S, Park J, Park S-Y, Mitchell TK, Lee Y-H (2010) Identification and analysis of in planta expressed genes of Magnaporthe oryzae. BMC Genomics 11: 104.
15. Matsumura H, Reich S, Ito A, Saitoh H, Kamoun S, et al. (2003) Gene expression analysis of plant host-pathogen interactions by SuperSAGE. Proc Natl Acad Sci USA 100: 15718–15723.
16. Mosquera G, Giraldo MC, Khang CH, Coughlan S, Valent B (2009) Interaction transcriptome analysis identifies Magnaporthe oryzae BAS1–4 as Biotrophy-associated secreted proteins in rice blast disease. Plant Cell 21: 1273–1290. 17. Wang Z, Gerstein M, Snyder M (2009) RNA-Seq: a revolutionary tool for
transcriptomics. Nat Rev Genet 10: 57–63.
18. Fu X, Fu N, Guo S, Yan Z, Xu Y, et al. (2009) Estimating accuracy of RNA-Seq and microarrays with proteomics. BMC Genomics 10: 161.
19. Marioni JC, Mason CE, Mane SM, Stephens M, Gilad Y (2008) RNA-seq: an assessment of technical reproducibility and comparison with gene expression arrays. 18: 1509–1517.
20. Langmead B, Trapnell C, Pop M, Salzberg S (2009) Ultrafast and memory-efficient alignment of short DNA sequences to the human genome. Genome Biol 10: R25.
21. Trapnell C, Pachter L, Salzberg SL (2009) TopHat: discovering splice junctions with RNA-Seq. Bioinformatics 25: 1105–1111.
22. Trapnell C, Williams BA, Pertea G, Mortazavi A, Kwan G, et al. (2010) Transcript assembly and quantification by RNA-Seq reveals unannotated transcripts and isoform switching during cell differentiation. Nat Biotechnol 28: 511–515.
23. Kankanala P, Czymmek K, Valent B (2007) Roles for rice membrane dynamics and plasmodesmata during biotrophic invasion by the blast fungus. Plant Cell 19: 706–724.
24. Mortazavi A, Williams BA, McCue K, Schaeffer L, Wold B (2008) Mapping and quantifying mammalian transcriptomes by RNA-Seq. Nat Methods 5: 621–628. 25. Benjamini Y (1995) Controlling the false discovery rate: a practical and powerful approach to multiple testing. Journal of the Royal Statistical Society Series B (Methodological) 57: 289–300.
26. Chittoor JM, Leach JE, White FF (1997) Differential induction of a peroxidase gene family during infection of rice by Xanthomonas oryzae pv. oryzae. Mol Plant Microbe Interact 10: 861–871.
27. Kato T, Tanabe S, Nishimura M, Ohtake Y, Nishizawa Y, et al. (2009) Differential responses of rice to inoculation with wild-type and non-pathogenic mutants of Magnaporthe oryzae. Plant Mol Biol 70: 617–625.
28. Lu G, Jantasuriyarat C, Zhou B, Wang G-L (2004) Isolation and characteriza-tion of novel defense response genes involved in compatible and incompatible interactions between rice and Magnaporthe grisea. Theor Appl Genet 108: 525– 534.
29. Agrawal G, Rakwal R, Jwa N, Agrawal V (2001) Signalling molecules and blast pathogen attack activates rice OsPR1a and OsPR1b genes: A model illustrating components participating during defence/stress response. Plant Physiol Bioch 39: 1095–1103.
30. McGee JD, Hamer JE, Hodges TK (2001) Characterization of a PR-10 pathogenesis-related gene family induced in rice during infection with Magnaporthe grisea. Mol Plant Microbe Interact 14: 877–886.
31. Rauyaree P, Choi W, Fang E, Blackmon B, Dean RA (2001) Genes expressed during early stages of rice infection with the rice blast fungus Magnaporthe grisea. Mol Plant Pathol 2: 347–354.
cell death. EMBO J 28: 926–936.
41. Rushton PJ, Somssich IE, Ringler P, Shen QJ (2010) WRKY transcription factors. Trends Plant Sci 15: 247–258.
42. Rice WRKY Working Group (2012) Nomenclature report on rice WRKY’s. -Conflict regarding gene names and its solution. Rice 5: 3.
43. de Jonge R, Thomma BPHJ (2009) Fungal LysM effectors: extinguishers of host immunity? Trends Microbiol 17: 151–157.
44. de Jonge R, van Esse HP, Kombrink A, Shinya T, Desaki Y, et al. (2010) Conserved fungal LysM effector Ecp6 prevents chitin-triggered immunity in plants. Science 329: 953–955.
45. Mentlak TA, Kombrink A, Shinya T, Ryder LS, Otomo I, et al. (2012) Effector-Mediated Suppression of Chitin-Triggered Immunity by Magnaporthe oryzae Is Necessary for Rice Blast Disease. Plant Cell 24: 322–335.
46. Xue C, Park G, Choi W, Zheng L, Dean RA, et al. (2002) Two novel fungal virulence genes specifically expressed in appressoria of the rice blast fungus. Plant Cell 14: 2107–2119.
47. Skamnioti P, Gurr SJ (2007) Magnaporthe grisea cutinase2 mediates appressorium differentiation and host penetration and is required for full virulence. Plant Cell 19: 2674–2689.
48. Duo-Chuan L (2006) Review of fungal chitinases. Mycopathologia 161: 345– 360.
49. Wang Y, Wu J, Park ZY, Kim SG, Rakwal R, et al. (2011) Comparative secretome investigation of Magnaporthe oryzae proteins responsive to nitrogen starvation. J Proteome Res 10: 3136–3148.
50. Adams DJ (2004) Fungal cell wall chitinases and glucanases. Microbiology 150: 2029–2035.
51. Wilson DB (2008) Three microbial strategies for plant cell wall degradation. Ann N Y Acad Sci 1125: 289–297.
52. Ohtaki S, Maeda H, Takahashi T, Yamagata Y, Hasegawa F, et al. (2006) Novel hydrophobic surface binding protein, HsbA, produced by Aspergillus oryzae. Appl Environ Microbiol 72: 2407–2413.
53. Tanabe S, Okada M, Jikumaru Y, Yamane H, Kaku H, et al. (2006) Induction of resistance against rice blast fungus in rice plants treated with a potent elicitor, N-acetylchitooligosaccharide. Biosci Biotechnol Biochem 70: 1599–1605. 54. Martin M (2011) Cutadapt removes adapter sequences from high-throughput
sequencing reads. EMBnet.journal 17: 10–12.
55. UniProt Consortium (2012) Reorganizing the protein space at the Universal Protein Resource (UniProt). Nucleic Acids Res 40: D71–D75.
56. Pruitt KD, Tatusova T, Brown GR, Maglott DR (2012) NCBI Reference Sequences (RefSeq): current status, new features and genome annotation policy. Nucleic Acids Res 40: D130–D135.
57. Rice P, Longden I, Bleasby A (2000) EMBOSS: the European Molecular Biology Open Software Suite. Trends Genet 16: 276–277.
58. Punta M, Coggill PC, Eberhardt RY, Mistry J, Tate J, et al. (2012) The Pfam protein families database. Nucleic Acids Res 40: D290–D301.
59. Bendtsen JD, Nielsen H, Heijne von G, Brunak S (2004) Improved prediction of signal peptides: SignalP 3.0. J Mol Biol 340: 783–795.
60. Emanuelsson O, Nielsen H, Brunak S, Heijne von G (2000) Predicting subcellular localization of proteins based on their N-terminal amino acid sequence. J Mol Biol 300: 1005–1016.