Abstract—This paper proposes a novel technique for content-based image retrieval based on tree matching. Image objects and their relations are some of the important features to match similar images. This new algorithm segments the image into some specific regions and then extracts their color, size, position, shape and object’s relation. This research, for the first time, employs object distance and minimum spanning tree of image graph for the region and image matching, respectively. The proposed algorithm computes center of each segment and connects center of them to obtain the image graph. By obtaining minimum spanning tree and then tree matching, we compare the image that is being searched in the database against the sample image. The simulation results are achieved from performing this method on an image database containing 10000 images and the superiority of proposed algorithm has been proved in terms of recall rate and precision rate.
Index Terms— Content Based Image Retrieval, Color Histogram, Minimum Spanning Tree, Object Relation, Region Based Retrieval.
I. INTRODUCTION
Increasing developments in computer and communication technologies have led to enormous archives of digital images in various areas such as digital library, medicine, art galleries, remote sensing, education, entertainment and so on. That is why transfer of digital images has been considered as one of the most important research topics for more than 40 years and today most of the efforts are that firstly to decrease the volume of storage and secondly to retrieve the proposed images with acceptable speed and precision rate. In this area a wide range of researches revolves on search based techniques on image databases as a critical need. The primary search-based solutions depend on textural descriptions provided by human operators which two problems were associated with this approach: expensiveness and low efficiency. The first one comes out of the amount of manual labor time required for image annotation and the second one comes out of the fact that each image may contain several Manuscript received March 26, 2008. This work was supported in part by the vice president of didactic department of Islamic Azad University of Qazvin, Iran.
M. Rezaei Ghahroudi is with Islamic Azad University of Qazvin, Iran, Department of Electrical and Computer Engineering and as the Member of Scientific Board. (Phone: +912-125-6587; Fax: +98-21-44089795; E-mail: [email protected]).
M. R. Sarshar, is with Islamic Azad University of Karaj Branch, Iran, He is now with the Department of Computer Engineering, as the member of academic staff, (E-mail: [email protected]).
R. Sabzevari is with the Department of Electrical and Computer Engineering, University of Qazvin, Iran, and member of young researchers club. (E-mail: [email protected]).
subjects from different viewpoints and it is almost impossible to describe even a few subjects in an image just by small number of keywords. Therefore, recent researches have focused on automated feature extraction of an image to generate indices in order to describe it for the purpose of content based image retrieval (CBIR) [1].
CBIR system extracts important visual features of an image, then generates a vector based on the image features, called feature vector and calculates the similarity of feature vector, extracted from query image, and other images stored in the database. Finally, it presents and ranks a sequence of similar images to the query one, based on a similarity measurement. There are two groups of CBIR system: histogram and region based methods. The histogram-based methods extract global features, such as color, texture and shape while the region-based CBIR systems segment images into some specific regions and retrieves images based on the similarity between them.
This paper proposes a combination of histogram method and region based CBIR systems to define a new image object’s relationships based on the image graph. The proposed algorithm, segments images, computes the center of each segment and connects the center of regions to obtain the image graph. The minimum spanning tree of the image graph is employed as global feature for image retrieval.
The organization of this paper is as follows: Section II, detailed description of the mentioned algorithm. Section III, presenting the experimental results and Section IV, the final section, brings the concluding remarks together.
II. RETRIEVAL ALGORITHM
In order to have a better retrieval, we have used a combination of both histogram-based and region-based image retrieval techniques. By this way at first, some of similar images to the query image will be found through color histogram method (about 10 percent) and then final similar images will be found by our proposed method in a better manner and with a good level of similarity.
A. Histogram-based retrieval algorithm
The color histogram we used in this paper is as [8]. In this method we use three color opponent axes as "Red-Green", "Blue-Yellow" and "Black-White" in which we use them instead of R, G and B respectively.
A Novel Content-Based Image Retrieval
Technique Using Tree Matching
Figure 1 depicts this idea, as well.
Figure 1. Three Color Opponent Axes
According to the mentioned method, we define these three new color domains by combination of main RGB colors as below:
G
R
B
by
G
R
rg
G
B
R
wb
−
−
=
−
=
+
+
=
2
For example in wb domain, the greater values for R, G, B will cause whither colors and lower values will cause darker colors. In addition the related histogram is quantized in the form of 8 *16*16 for wb, rg, by respectively.
The histogram intersection method which is used to compare the histograms is given:
(
)
∑
==
n jj
M
h
j
I
h
M
h
I
h
1]
)[
(
],
)[
(
min
))
(
),
(
(
on
Intersecti
Finally it is normalized by the following formula:
∑
==
n jj
M
h
M
h
I
h
M
h
I
h
match
Color
1]
)[
(
/
))
(
),
(
(
on
intersecti
))
(
),
(
(
_
As we mentioned before, in the first step we just used the M.J Swain Method [8]. Now, in continuation of this paper, for the first time, we offer an extra step to have a more effective result for retrieval
B. Region-based retrieval algorithm
The first step of retrieval system was image segmentation and now in the second step, by considering automatic segmentation method proposed by Allen, et al [4, 5] and after segmenting image into n regions named r1 to rn , we can
calculate features of each region including average color, size and shape parameters.
Consider IM [x, y, color] as a 3-dimensional vector of RGB color domain. We evaluate six special features to have an effective and efficient retrieval in which some features are
the same as in [9].
Feature 1: "Size of segment comparison to size of image", that we define it as:
)
(
size
of
image
Size
S
i=
iWhere Size i is Size of i th segment and it is obtained from:
∑
∈ ∀=
i r y x iSize
) , (1
Feature2: Color feature might be one of the most
important features of an image, so we consider average color value as the second feature.
To obtain amount of each of Red, Green, and Blue colors on the desire segment, we perform the below equations:
∑
∑
∑
∈ ∀ ∈ ∀ ∈ ∀ = = = i i i r y x i i r y x i i r y x i i b y x IM Cb g y x IM Cg r y x IM Cr ) , ( ) , ( ) , ( ) , , ( ) , , ( ) , , (After calculating individual color-values within each segment, then the average value of mixed colors in i th segment will be derived from following equation:
)
3
(
)
(
i i i ii
Cr
Cg
Cb
Size
C
=
+
+
×
Feature3, 4: Now, In order to obtain vertical and
horizontal image features of the segment we need to obtain center of the segment where we can define central pixel of the segment as: i r y i i r x i Size y GY Size x GX i i
∑
∑
∈ ∀ ∈ ∀ = =in which the average value of all addresses could be found in center of image.
So, vertical and horizontal features of the image segments are defined as below:
(
)
(
)
(
)
where GXi and GYi represent the coefficients for center of segment i on horizontal and vertical directions respectively. These features are defined in a specific order in which, the most centralized segment (like a circle), causes the greater values.
So by combination of vertical and horizontal features, we can determine the vertical and horizontal position of image segment within the image.
Feature5: Now, according to vertical and horizontal
features, overall shape parameter of the segment is defined as:
(
)
(
GX x)
(
GY y)
S
y GY x GX
OS
i r y i
r x i
r y x
i i
i
i i
i
− ×
− ×
− × − =
∈ ∀ ∈
∀ ∈
∀
∑
max max
) , (
And finally by determining feature of segment distance from center of whole image, the 6th feature could be obtained as a suitable feature for evaluating the image by below Equation:
Feature6:
i r
y x
i i
i
S
y
GY
x
GX
CS
i∑
∈ ∀
⎟
⎠
⎞
⎜
⎝
⎛
−
+
−
=
( , )2 2
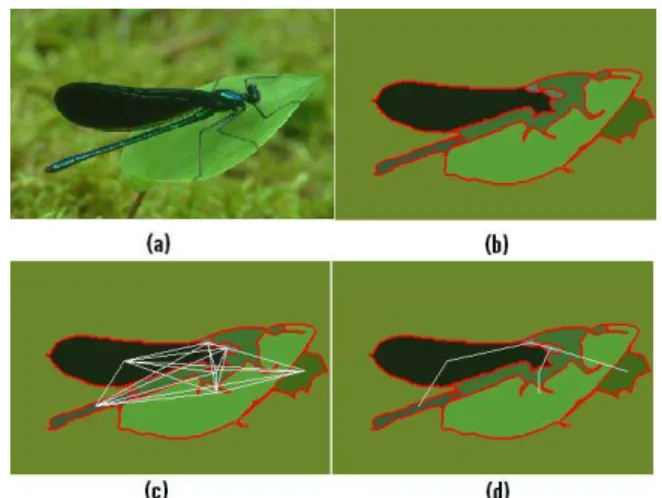
Let's continue further operation. According to performed segmentation method, we can found that each segment might be a meaningful region in the image (Figure 2.b), so henceforth we use term "region" instead of segment.
As image region features may have different ranges (one region with very small value and one region with very huge value), therefore a normalization method should be applied on each of them. We employed min/max algorithm [2] as shown in the following formula to achieve a weighted normalized similarity factor between two features I and I', where ω is an initial weight:
(
)
)
(
)
(
)
(
*
,
I
I
Min
I
I
Max
I
I
Min
I
I
I
I
N
′
−
−
′
−
′
−
−
′
−
=
′
ω
The total similarity between a region in a query image and a region of another image is calculated via a weighted sum of the similarities provided by each of the features. Here, we define the distance between the regions as follows:
)
,
(
)
,
(
)
,
(
)
,
(
)
,
(
)
,
(
)
r
,
D(r
6 5
4 3
2 1
j i
j i j
i
j i j
i
j i j
i
CS
CS
N
w
OS
OS
N
w
VS
VS
N
w
HS
HS
N
w
C
C
N
w
S
S
N
w
+
+
+
+
+
=
where
w
i are our target weights for each of the six mentioned features.In order to compare images, the centers of all regions are found and they are all connected to create the image graph (Figure 2.c), then we calculate the minimum spanning tree of image graph as shown in figure 2.d [3].
The retrieval process is as follows. At first, for comparing two images the user selects a region of interest from the query image then the system obtains most similar region in other images, finally the system computes related tree of both images (selected region is root of tree). For example we show this tree for two images as figure 3.
Figure 2 (a) Original image, (b) Segmented image, (c) Image graph, (d) Minimum spanning tree of image.
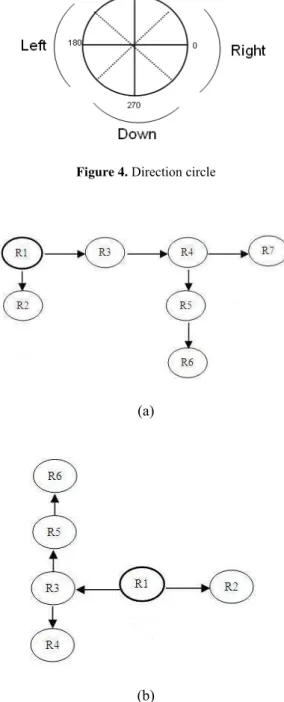
Now we compute related tree for each image. Root of this tree is region of the user interest, and for the other node of tree, we use a direction circle like figure 4.
Figure 3. (a) and (c) Two sample query image, (b) and (d) Related trees for query images
Figure 4. Direction circle
(a)
(b)
Figure 5. (a) Query image tree, (b) Target image tree
Actually, we use a simple tree matching approach. Start from root and then select just the nodes that have equal structure in both trees and then delete other unequal nodes.
For above example there are just two nodes with similar sub trees that match to each other (figure 6).
Figure 6. (a) Query image sub tree, (b) Target image sub tree
Now, if the query image sub tree contains n nodes or regions as {d1,d2,...,dn}excluding its root and the target image sub tree contains n nodes or regions as
}
,...,
,
{
e
1e
2e
n excluding its root, and Image1(rk) is the user selected region, and Image2(rk) is the root region of target tree, then we define the distance between two images as follow:n) 2 ( )) (e Image ), (d D(Image
)) (r Image ), (r D(Image 2
) Image , Dis(Image
n
1 i
i 2 i
1
k 2 k
1 2 1
+ ⎟ ⎟ ⎟
⎠ ⎞
⎜ ⎜ ⎜
⎝ ⎛
+ ×
=
∑
=
′
III. EXPERIMENTAL RESULTS
Our experimental results are based on an image database containing 10000 various color images by the size of 128*85 and 96*128. This image database is employed in [6], [7] and can be downloaded from Stanford university website:
http://www-db.stanford.edu/~wangz/image.vary.jpg.tar
In our system, the weights can be selected based on the user interest. However we assumed the number of similar images to the query image as 10 and the rest parameters as below and according to several experiments:
(
)
) , ( * 2 ) , ( * 1
) , ( * 1 ) , ( * 1
) , ( * 3 ) , ( * 1
) ( 2 ),
( 1
j i j
i
j i j
i
j i j
i j i
CS CS N OS
OS N
VS VS N HS
HS N
C C N S
S N
r IMAGE r
IMAGE D
+ +
+ +
+ =
To evaluate the accuracy of the algorithm, we randomly selected 100 query images and found 10 most similar images for those queries. Figure 3 shows two examples of the retrieval results.
Our proposed algorithm was implemented on a Core 2 Due 2.0 GHz PC with 1GB memory and we found much better results as shown on table 1 comparisons to Color Histogram Method.
Figure 7 and Table 1 presents the results of proposed scheme with the results of [8] by precision rate and recall rate metrics.
Table 1. Comparing proposed algorithm with Color Histogram method
Color Histogram
Proposed method
Recall Rate 0.393 0.639
(a)
(b)
(c)
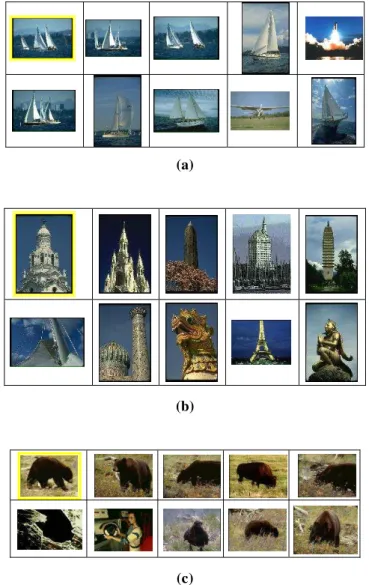
Figure 7. Three set of retrieved images in our experiments (Images with yellow borders, at the upper left corner, are the query images)
IV. CONCLUSION
This paper introduced a new region based image retrieval technique focusing on object relationships to reduce “semantic gap” between human visual perception and retrieval approach. The minimum spanning tree of image graph and the features of image segment are all employed based on a user-desired weight for image matching. The experimental results based on image database containing 10000 images showed that the proposed approach achieves significantly better performance than similar approaches. As you can see in figure 7, the mentioned method is accurate and reliable enough for natural texture images such as sky, lands, sea, trees and anything like these, but there is just a drawback on complicated texture images which may rarely cause some fails that we left it for future researches.
REFERENCES
[1] V. Castelli, and L.D. Bergman, “Image databases search and retrieval of digital imagery,” New York: John Wiley & Sons, 2002.
[2] J. Han and M. Kambr, “DATA MINING Concepts and Techniques”, Morgan Kaufmann Publisher, 2000.
[3] T. H. Cormen, et al, “Introductions to algorithms”, MIT Press, 2001.
[4] Allen Y. Yang, John Wright, Yi Ma, and Shankar Sastry. Unsupervised segmentation of natural images via lossy data compression. CVIU 2007 [5] Yi Ma, Harm Derksen, Wei Hong, and John Wright. Segmentation of multivariate mixed data via lossy coding and compression. (Preprint) PAMI. 2007.
[6] J. Li, et al., “IRM: integrated region matching for image retrieval”, in Proceedings of the Eighth ACM Multimedia Conference. 2000, 147–156.
[7] J. Z. Wang, et al., “Simplicity: Semantics-sensitive Integrated matching for picture libraries”, IEEE Transaction of Pattern Analysis and
Machine Intelligence, Vol. 23, No .9, 2001, 947-963.
[8] M.J. Swain and D.H. Ballard, “Color indexing”, International Journal of Computer Vision, pp. 11-32, 1991.