BGD
12, 17507–17541, 2015
No observed effect of
ocean acidification on nitrogen biogeochemistry
A. J. Paul et al.
Title Page
Abstract Introduction
Conclusions References
Tables Figures
◭ ◮
◭ ◮
Back Close
Full Screen / Esc
Printer-friendly Version
Interactive Discussion
Discussion
P
a
per
|
Discussion
P
a
per
|
Discussion
P
a
per
|
Discussion
P
a
per
|
Biogeosciences Discuss., 12, 17507–17541, 2015 www.biogeosciences-discuss.net/12/17507/2015/ doi:10.5194/bgd-12-17507-2015
© Author(s) 2015. CC Attribution 3.0 License.
This discussion paper is/has been under review for the journal Biogeosciences (BG). Please refer to the corresponding final paper in BG if available.
No observed e
ff
ect of ocean acidification
on nitrogen biogeochemistry in a summer
Baltic Sea plankton community
A. J. Paul1, E. P. Achterberg1,2, L. T. Bach1, T. Boxhammer1, J. Czerny1,
M. Haunost1, K.-G. Schulz1,3, A. Stuhr1, and U. Riebesell1
1
GEOMAR Helmholtz Centre for Ocean Research Kiel, Düsternbrooker Weg 20, 24105 Kiel, Germany
2
National Oceanography Centre Southampton, European Way, University of Southampton, Southampton SO14 3ZH, UK
3
Southern Cross University, Military Road, East Lismore, NSW 2480, Australia
Received: 5 October 2015 – Accepted: 12 October 2015 – Published: 30 October 2015
Correspondence to: A. J. Paul ([email protected])
BGD
12, 17507–17541, 2015
No observed effect of
ocean acidification on nitrogen biogeochemistry
A. J. Paul et al.
Title Page
Abstract Introduction
Conclusions References
Tables Figures
◭ ◮
◭ ◮
Back Close
Full Screen / Esc
Printer-friendly Version
Interactive Discussion
Discussion
P
a
per
|
Discussion
P
a
per
|
Discussion
P
a
per
|
Discussion
P
a
per
|
Abstract
Nitrogen fixation by filamentous cyanobacteria supplies significant amounts of new ni-trogen (N) to the Baltic Sea. This balances N loss processes such as denitrification and anammox and forms an important N source supporting primary and secondary production in N-limited post-spring bloom plankton communities. Laboratory studies
5
suggest that filamentous diazotrophic cyanobacteria growth and N2-fixation rates are
sensitive to ocean acidification with potential implications for new N supply to the Baltic Sea. In this study, our aim was to assess the effect of ocean acidification on diazotroph growth and activity as well as the contribution of diazotrophically-fixed N to N supply in a natural plankton assemblage. We enclosed a natural plankton community in a
10
summer season in the Baltic Sea near the entrance to the Gulf of Finland in six large-scale mesocosms (volume∼55 m3) and manipulated fCO2 over a range relevant for
projected ocean acidification by the end of this century (average treatmentfCO2: 365– 1231 µatm). The direct response of diazotroph growth and activity was followed in the mesocosms over a 47 day study period during N-limited growth in the summer plankton
15
community. Diazotrophic filamentous cyanobacteria abundance throughout the study period and N2-fixation rates (determined only until day 21 due to subsequent use of
contaminated commercial15N-N2gas stocks) remained low. Thus estimated new N
in-puts from diazotrophy were too low to relieve N limitation and stimulate a summer phy-toplankton bloom. Instead regeneration of organic N sources likely sustained growth in
20
the plankton community. We could not detect significant CO2-related differences in
in-organic or in-organic N pools sizes, or particulate matter N : P stoichiometry. Additionally, no significant effect of elevated CO2 on diazotroph activity was observed. Therefore, ocean acidification had no observable impact on N cycling or biogeochemistry in this N-limited, post-spring bloom plankton assemblage in the Baltic Sea.
BGD
12, 17507–17541, 2015
No observed effect of
ocean acidification on nitrogen biogeochemistry
A. J. Paul et al.
Title Page
Abstract Introduction
Conclusions References
Tables Figures
◭ ◮
◭ ◮
Back Close
Full Screen / Esc
Printer-friendly Version
Interactive Discussion
Discussion
P
a
per
|
Discussion
P
a
per
|
Discussion
P
a
per
|
Discussion
P
a
per
|
1 Introduction
Nitrogen (N) is an essential element for cell functioning in the biosphere due to its pres-ence in many important biomolecules such as nucleic acids and proteins. However, in many marine ecosystems N is considered the limiting nutrient for important cellular pro-cesses in phytoplankton (Vitousek and Howarth, 1991), as indicated through
stimula-5
tion carbon fixation and pigment synthesis through addition of inorganic N (e.g. Moore et al., 2008, 2013). This low N availability also prevails in post-spring bloom plank-ton communities in the Baltic Sea, as the nitrate pool is exhausted during the spring-bloom leaving behind an excess of dissolved inorganic phosphorus (Wasmund et al., 2001). Consequently, filamentous diazotrophic (N2-fixing) cyanobacteria, in
particu-10
lar heterocystousNodularia spumigenaandAphanizomenon flos-aquae, capitalise on this excess phosphate and increasing water column temperatures in summer months (Kononen et al., 1996; Pliński and Jóźwiak, 1999; Wasmund, 1997) and commonly form extensive blooms and surface aggregations (e.g. Kahru and Elmgren, 2014). The atmo-spheric nitrogen gas (N2) fixed by these heterocystous cyanobacteria during the
sum-15
mer months forms a key N source for the wider plankton community in the Baltic Sea, since a significant fraction of the fixed N can be released as ammonium (Ohlendieck et al., 2000; Ploug et al., 2010; Stal et al., 2003; Wannicke et al., 2013) and dissolved organic N compounds (Ohlendieck et al., 2000, 2007; Wannicke et al., 2013). Thus in addition to N in diazotroph biomass, newly fixed N is also available for direct
assimila-20
tion by phytoplankton and bacteria and is estimated to support up to 20–45 % of annual primary production in the Baltic Sea (Gustafsson et al., 2013). This new N input partly replenishes N loss processes such as anammox and denitrification in the deep anoxic basins (Vahtera et al., 2007). Furthermore, this fixed N can also be directly transferred to higher trophic levels through grazing by zooplankton (Engström-Öst et al., 2011;
25
Hogfors et al., 2014; Wannicke et al., 2013).
Changes in seawater carbonate chemistry due to increased atmospheric CO2
associ-BGD
12, 17507–17541, 2015
No observed effect of
ocean acidification on nitrogen biogeochemistry
A. J. Paul et al.
Title Page
Abstract Introduction
Conclusions References
Tables Figures
◭ ◮
◭ ◮
Back Close
Full Screen / Esc
Printer-friendly Version
Interactive Discussion
Discussion
P
a
per
|
Discussion
P
a
per
|
Discussion
P
a
per
|
Discussion
P
a
per
|
ated decrease in seawater pH is called ocean acidification. Numerous single-strain cul-ture studies have investigated the physiological responses of a variety of diazotrophic organisms and generally indicated increased N2-fixation and diazotroph growth rates
under elevated CO2 (Barcelos e Ramos et al., 2007; Fu et al., 2008; Hutchins et al., 2007; Kranz et al., 2010; Levitan et al., 2007), with contrasting evidence under iron
5
limitation (Shi et al., 2012) and with freshwater strains ofA. flos-aquae(Yamamoto and Nakahara, 2005). Three studies on the common Baltic Sea species, N. spumigena, produced contrasting results with two studies under phosphate repletion suggesting a negative effect (Czerny et al., 2009; Eichner et al., 2014), and one study, under low inorganic phosphate availability, indicating a positive effect (Wannicke et al., 2012) of
10
increased CO2on growth and N2-fixation rates. This discrepancy may, however, be due to differences in phosphate availability (Eichner et al., 2014). Considering the contribu-tion of diazotrophs to the N budget and primary productivity in the Baltic Sea, it is vital to understand the influence of future changes inpCO2on new N inputs by diazotrophs. In this mesocosm study, our aim was to assess diazotroph growth and rates of N2
-15
fixation under a range of CO2concentrations in a natural plankton community. N
limita-tion of phytoplankton growth was reported in the study area in the Finland Archipelago Sea (Kirkkala et al., 1997; Tamminen and Andersen, 2007). By utilizing the naturally occurring low N conditions in the Baltic Sea we wanted to examine the importance of new N inputs by diazotrophic organisms to the wider plankton community N supply
20
under projected future ocean acidification scenarios.
2 Materials and methods
2.1 Experimental set-up and sampling
The study took place in the period between June and August 2012 in Tvärminne Stor-fjärden which is situated in the Archipelago Sea on the southwestern tip of Finland.
25
BGD
12, 17507–17541, 2015
No observed effect of
ocean acidification on nitrogen biogeochemistry
A. J. Paul et al.
Title Page
Abstract Introduction
Conclusions References
Tables Figures
◭ ◮
◭ ◮
Back Close
Full Screen / Esc
Printer-friendly Version
Interactive Discussion
Discussion
P
a
per
|
Discussion
P
a
per
|
Discussion
P
a
per
|
Discussion
P
a
per
|
deployed on 12 June 2012 (day of experiment−10=t-10, i.e. 10 days before CO2
ma-nipulation) and moored at 59◦51.5′N, 23◦15.5′E. The cylindrical mesocosm bags of 2 m in diameter extended from 1.5 m above to 19 m below the water surface and were closed at the bottom by a 2 m long sediment trap funnel ont-5. A 3 mm net was used to exclude larger organisms or particles before mesocosm closure.
5
A gradient of CO2treatments across the mesocosms was established over a four day
period by additions of filtered (50 µm), CO2-saturated seawater evenly distributed in the water column, as described by Riebesell et al. (2013). CO2additions were carried out
in the afternoons oft0–t4not to interfere with the daily sampling. A CO2addition was
also made in the upper 7 m on t15 to counter strong outgassing in the upper water
10
column. InitialfCO2ranged from∼240 µatm in the two ambient control mesocosms to up to 1650 µatm (Fig. 1a). Unenriched filtered (50 µm) seawater was added to the two control mesocosms (M1, M5). The seawater used for the additions to the mesocosms was collected from the Tvärminne Storfjärden from a depth of 10 m by a pipe connected to the laboratory at the research station.
15
Depth-integrating water samplers (IWS, HYDRO-BIOS, Kiel) were used to collect wa-ter from 0–17 m depth in each mesocosm for analysis of particulate matwa-ter, dissolved inorganic and organic matter, phytoplankton pigments, phytoplankton abundances, car-bonate chemistry variables. Samples for carcar-bonate chemistry variables were taken di-rectly from the IWS on board the sampling boat whereas all other samples were pooled
20
in 10 L plastic carboys and stored on board in the dark until sub-sampling on shore (Paul et al., 2015). Particulate matter collected in the sediment trap was pumped to the surface and collected in sampling bottles (Boxhammer et al., 2015).
Particulate matter (C, N, P) was collected onto GF/F filters (nominal pore size of 0.7 µm, 25 mm diameter, Whatman) by gentle vacuum filtration (pressure<200 mbar).
25
Filters and glass petri dishes were combusted at 450◦C for 6 h before use. Collected
BGD
12, 17507–17541, 2015
No observed effect of
ocean acidification on nitrogen biogeochemistry
A. J. Paul et al.
Title Page
Abstract Introduction
Conclusions References
Tables Figures
◭ ◮
◭ ◮
Back Close
Full Screen / Esc
Printer-friendly Version
Interactive Discussion
Discussion
P
a
per
|
Discussion
P
a
per
|
Discussion
P
a
per
|
Discussion
P
a
per
|
content and isotopic composition were analysed according to Sharp et al. (1974) using an elemental analyser (EuroEA) coupled by either a Conflo II to a Finnigan DeltaPlus isotope ratio mass spectrometer or by a Conflo III to a Thermo Finnigan DeltaPlus XP isotope ratio mass spectrometer. Stable N isotope composition of particulate N is re-ported in permil (‰) relative to the atmospheric N2 standard (AIR). Total particulate
5
phosphorus (TPP) concentrations were determined spectrophotometrically following sample digestion as described in Hansen and Koroleff (1999). Samples for biogenic silica (BSi) analyses were collected on cellulose acetate filters (pore size of 0.65 µm, 25 mm diameter, Whatman) by filtration as described above for particulate matter. Concentrations were determined spectrophotometrically following sample digestion
10
according to Hansen and Koroleff (1999). Samples for determination of nanomolar concentrations of dissolved inorganic nutrients were filtered (GF/F, nominal pore size of 0.7 µm, Fisher Scientific). Nitrate and nitrite (hereafter nitrate) and dissolved inor-ganic phosphate concentrations were then analysed colorimetrically using a 2 m liquid waveguide capillary cell (Patey et al., 2008; Zhang and Chi, 2002) and a miniaturised
15
detector (Ocean Optics Ltd). Concentrations of ammonium (NH+4) were determined flu-orimetrically (Trilogy, Turner) according to Kérouel and Aminot (1997). Total dissolved nitrogen (TDN) was analysed using a high-temperature catalytic combustion technique with a Shimadzu TOC-TN V analyser as described by Badr et al. (2003). Samples were filtered (GF/F, nominal pore size of 0.7 µm, Fisher Scientific) to remove
particu-20
late material and collected in clean glass vials, acidified with HCl to pH 1.9 and flame sealed. Filters and vials were combusted for 6 h at 450◦C before use. Dissolved organic nitrogen (DON) concentrations were calculated by subtracting the inorganic N con-centrations from TDN. Phytoplankton pigments were extracted in acetone (90 %) and after homogenisation and centrifugation, the supernatant was filtered (0.2 µm PTFE
25
BGD
12, 17507–17541, 2015
No observed effect of
ocean acidification on nitrogen biogeochemistry
A. J. Paul et al.
Title Page
Abstract Introduction
Conclusions References
Tables Figures
◭ ◮
◭ ◮
Back Close
Full Screen / Esc
Printer-friendly Version
Interactive Discussion
Discussion
P
a
per
|
Discussion
P
a
per
|
Discussion
P
a
per
|
Discussion
P
a
per
|
Phosphate excess (P∗, Deutsch et al., 2007) was calculated from the dissolved inor-ganic phosphate, nitrate and ammonium concentrations according to:
P∗=hPO3−
4 i
−
NO−3
+[NH+4]
16 (1)
Dissolved silicate (DSi) drawdown was calculated as the difference in DSi concentration on a given sampling day (tx) andt1:
5
DSi drawdown=[DSi]t1−[DSi]tx (2)
A comprehensive description of mesocosm deployment, set-up and sampling proce-dures including sample collection, handling and analyses for particulate matter, dis-solved inorganic and organic matter, phytoplankton pigments, and sediment trap par-ticulate matter is covered in Paul et al. (2015), also in this Special Issue. An overview
10
table of sampled variables for the entire experiment, including sampling frequency, is also presented in this accompanying manuscript.
2.2 N2-fixation rate incubations
Incubations for determination of N2-fixation rates were carried out according to Mohr
et al. (2010). Seawater used for 15N-N2 enrichments was filtered (polycarbonate
15
Isopore™ filter, pore size of 0.22 µm, 47 mm diameter) before being pumped through a degassing membrane (Membrana Mini Module G542) attached to a water-jet pump to remove ambient N2. The degassing system was cleaned with 5 % HCl before and
after use, followed by cycling with deionised water (MilliQ, Millipore) to remove any traces of acid. Seawater from the Tvärminne Storfjärden was collected from a depth of
20
10 m and cycled once through the degassing system before collection in an air-tight, acid-cleaned bag with septum (SKC Tedlar®Bag with single polypropylene fitting) with-out exposure to the atmosphere. 1 mL of15N-N2gas (98 at %
15
BGD
12, 17507–17541, 2015
No observed effect of
ocean acidification on nitrogen biogeochemistry
A. J. Paul et al.
Title Page
Abstract Introduction
Conclusions References
Tables Figures
◭ ◮
◭ ◮
Back Close
Full Screen / Esc
Printer-friendly Version
Interactive Discussion
Discussion
P
a
per
|
Discussion
P
a
per
|
Discussion
P
a
per
|
Discussion
P
a
per
|
bag for every 100 mL of sample. The resulting bubble was dissolved and the15N-N2
-enriched seawater was stored at in situ temperature of the mesocosms until addition to incubation bottles. Seawater for the blank incubations was prepared in a separate bag using the same process however ambient air was added instead of isotopically labelled
15
N-N2 gas.
5
Water samples for N2-fixation rate incubations were directly transferred in a gentle manner from the integrating water sampler into 2.3 L polycarbonate bottles on board the sampling boat using silicon tubing. The bottles were stored in a closed cool box to control temperature and to block sunlight until return to the on shore laboratory. Each bottle was weighed and homogenised by gentle rotation before 70–90 mL of water was
10
removed to make space for the15N-enriched seawater. Enriched or “blank” seawater was transferred from the Tedlar®bags to the respective bottles through Tygon™tubing, immersed in the sample bottle, using a peristaltic pump to minimise tracer loss through exposure to atmosphere. Incubation bottles were filled with no headspace. After addi-tion, the caps were immediately screwed on to seal the bottles air tight. During these
15
procedures, the bottles were reweighed at each step in order to determine the exact amount of isotope label inside each bottle. The final15N-enrichment of dissolved N2
gas in each bottle was between 1.0–3.5 at %. The bottles were then mixed by gentle rotation and placed in a climate chamber at in situ temperature and under controlled light conditions (∼73±1 µmol photons m−2s−1, mean±SD). Irradiance was measured
20
using a LI-COR LI-192 quantum sensor. Measured irradiance were within the range of average depth-integrated (0–17 m) irradiance in the mesocosms taken from daily CTD profiles at between 13:30 and 14:30 LT (20 to 300 µmol photons m−2
s−1
). The light-dark cycle followed the natural sunrise-sunset variation which on the summer solstice (21 June 2012,t-1) was 19:5 h (L : D). Climate chamber temperature was programmed
25
BGD
12, 17507–17541, 2015
No observed effect of
ocean acidification on nitrogen biogeochemistry
A. J. Paul et al.
Title Page
Abstract Introduction
Conclusions References
Tables Figures
◭ ◮
◭ ◮
Back Close
Full Screen / Esc
Printer-friendly Version
Interactive Discussion
Discussion
P
a
per
|
Discussion
P
a
per
|
Discussion
P
a
per
|
Discussion
P
a
per
|
every three hours during the light cycle. Time of rotation was recorded allowing the calculation of average irradiance between each individual bottle.
Incubations were terminated after 24 h by filtration through a combusted (6 h at 450◦C) and acid rinsed (1 % HCl) GF/F filter (0.7 µm pore size, 25 mm diameter, What-man) under reduced vacuum (<200 mbar). Filters were placed in glass petri dishes
5
(combusted 6 h, 450◦C), frozen immediately and stored at −20◦C until analysis on a mass spectrometer as described for particulate C and N analyses above and also in Paul et al. (2015). Rates were calculated according to Montoya et al. (1996). Estimated internal analytical uncertainty in calculated N2–fixation rates was less than±10 % when
rates were above the detection limit. The detection limit was determined as a difference
10
inδ15N between initial and final values of larger than 1.0 ‰. This corresponded to a cal-culated rate of more than 0.15 nmol N L−1d−1.
2.3 Enrichment of mesocosms with15N-N
2gas
Four of six mesocosms spanning the range offCO2treatments were enriched with the
isotopically labelled 15N-N2 gas to investigate the fate of newly fixed N in this
plank-15
ton community under future ocean acidification conditions. A similar approach to Mohr et al. (2010), as described for the N2-fixation incubations (see Sect. 2.2), was
em-ployed on a larger scale. A total of approximately 1500 L of unfiltered seawater was collected from the Baltic at ca. 10 m depth and pumped into the laboratory building at Tvärminne Zoological Station. Mesocosm enrichment occurred in two pulses on t22
20
andt26. We added this in two steps because of the limited number of bags available for preparing the 15N-N2 enriched seawater. For the first step, seawater was filtered
and collected as for the N2-fixation incubations in bags (thermoplastic polyurethane,
∼30 L capacity) with a tap and a crimp sealed septum (N20 grey butyl rubber plugs, Macherey and Nagel) on opposite ends of the bag. The large physical effort required
25
de-BGD
12, 17507–17541, 2015
No observed effect of
ocean acidification on nitrogen biogeochemistry
A. J. Paul et al.
Title Page
Abstract Introduction
Conclusions References
Tables Figures
◭ ◮
◭ ◮
Back Close
Full Screen / Esc
Printer-friendly Version
Interactive Discussion
Discussion
P
a
per
|
Discussion
P
a
per
|
Discussion
P
a
per
|
Discussion
P
a
per
|
scribed through the degassing membrane. Instead of collecting the water directly after this step, the water then passed through a second membrane that was flooded with
15
N-N2gas and was connected to an overflow system which allowed monitoring of gas
dissolution (Fig. 2). The high surface area in the membrane enhanced the labelled gas dissolution. This enriched water was then pumped directly into the empty collection
5
bags using a peristaltic pump without contact with the atmosphere. One complete car-tridge of gas (500 mL, nitrogen –15N-N2, 98 at %15N, Sigma Aldrich, Lot no.: SZ1670V, SZ1423V, CX0937) was added per bag through the septum. A total of 150 L of enriched seawater prepared was added to four mesocosms (M3, M5, M6, M8), and 100 L unen-riched filtered seawater was added to the other two mesocosms (M1, M7) as isotope
10
label controls ont22andt26.
2.4 Phytoplankton counts
Counts of phytoplankton cells>20 µm were made from 50 mL samples fixed with acidic Lugol’s iodine solution (1 % final concentration). Samples were concentrated using gravitational settling and counted under an inverted microscope (ZEISS Axiovert 100)
15
after Utermöhl (1958) and following the guidelines for determination of phytoplankton species composition, abundance and biomass for the COMBINE programme provided by HELCOM (Annex C-6). The cells were counted either on half of the chamber at 100 fold or on 3 to 4 strips at 200 fold magnification. Filamentous cyanobacteria were counted in 50 µm length units. Plankton were identified where possible to the species
20
BGD
12, 17507–17541, 2015
No observed effect of
ocean acidification on nitrogen biogeochemistry
A. J. Paul et al.
Title Page
Abstract Introduction
Conclusions References
Tables Figures
◭ ◮
◭ ◮
Back Close
Full Screen / Esc
Printer-friendly Version
Interactive Discussion
Discussion
P
a
per
|
Discussion
P
a
per
|
Discussion
P
a
per
|
Discussion
P
a
per
|
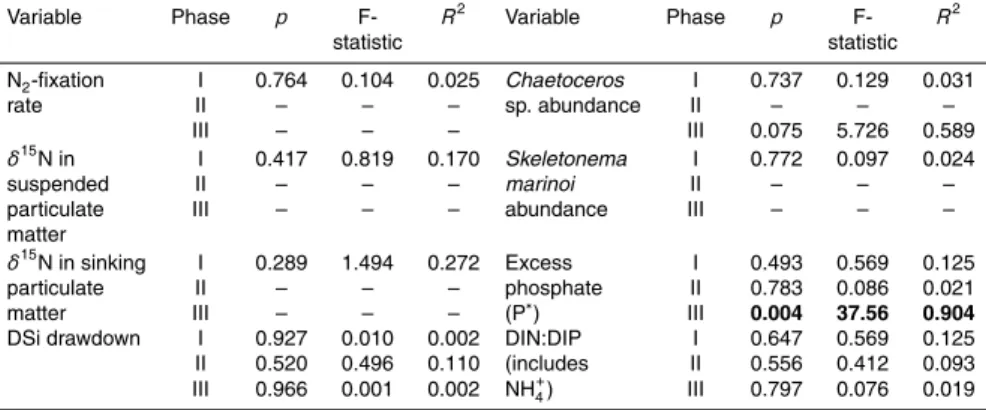
2.5 Statistical analyses
A linear regression analysis was applied to determine the relationship between mean
fCO2 and the mean response of each variable for the three experimental phases
(Phase I, II and III), as described in Paul et al. (2015). Linear regression analyses were undertaken using R (R Core Team, 2015).
5
3 Results
Three experimental phases after initial CO2 manipulation on t0 were defined in Paul et al. (2015) using temperature and chlorophylla(Chla) fluctuations: Phase I (t1–t16), Phase II (t17–t30) and Phase III (t31–t43). These phases are also used to assist with data interpretation in this manuscript.
10
3.1 Inorganic nutrient availability and nutrient limitation
There were low concentrations of inorganic N present throughout the study period with inorganic nitrate concentrations in the range of 3–107 nmol L−1 (Fig. 1c). Ammonium was the dominant source of inorganic N with concentrations ranging between 20 and 289 nmol L−1. Hence NH+4 was also included in the calculations of P∗ (excess
phos-15
phate) and inorganic nutrient elemental stoichiometry according to the Redfield ratio (Fig. 3, Eq. 1).
There was an excess of inorganic phosphate to inorganic N in all mesocosms (P∗>0 nmol L−1, Fig. 3a) and the surrounding waters throughout the study period, with phosphate concentrations ranging between 72 and 214 nmol L−1 in the mesocosms
20
and up to 410 nmol L−1 outside the mesocosms in the surrounding Archipelago Sea. Inorganic phosphate concentrations decreased during Phase I, followed by an increase during Phase II with more stable concentrations in Phase III. Nitrate concentrations in-creased throughout the experiment with a possible small drawdown after t39 in all treatments, whereas NH+4 concentrations were variable. Samples for NH+4 analyses
BGD
12, 17507–17541, 2015
No observed effect of
ocean acidification on nitrogen biogeochemistry
A. J. Paul et al.
Title Page
Abstract Introduction
Conclusions References
Tables Figures
◭ ◮
◭ ◮
Back Close
Full Screen / Esc
Printer-friendly Version
Interactive Discussion
Discussion
P
a
per
|
Discussion
P
a
per
|
Discussion
P
a
per
|
Discussion
P
a
per
|
were lost ont27andt29. There did not appear to be any remarkable relationship link-ing accumulated precipitation (between sampllink-ing days), and the increase in nitrate (Fig. 1c and e), indicating that wet atmospheric deposition of nitrate into the meso-cosms was effectively prevented by the mesocosm roofs and did not affect the nitrate pool. Precipitation data for the Hanko weather station (ID no.: GHCND:FIE00142025,
5
latitude: 59.8439, longitude: 23.2517) were obtained from the National Oceanographic Data Center (NOAA).
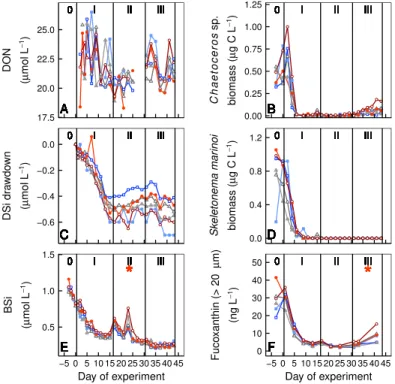
3.2 Diatom abundance, silicate dynamics and dissolved N utilisation
Diatoms were mostly abundant at the beginning of the experiment with the species
Chaetoceros sp. and Skeletonema marinoi present in the large size class (>20 µm,
10
Fig. 4). Fucoxanthin marker pigment concentrations in this size class and suspended BSi concentrations (>0.65 µm) declined markedly during the first few days in Phase I and the dynamics fitted well to the microscopy counts of both Chaetocerossp. and
Skeletonema marinoi. Dissolved silicate (DSi) concentrations continued to decrease up
untilt13. No statistically significant difference between CO2 treatments was detected
15
for diatom abundance (microscopy counts), DSi drawdown or BSi concentrations (Ta-ble 1, Fig. 4c and e), apart from BSi in Phase II where a positive effect was detected (p=0.034, see Paul et al. (2015) for statistical analyses).
Dissolved organic nitrogen (DON) concentrations ranged between 20 and 25 µmol L−1(Fig. 4a). DON concentrations appeared to decrease during Phase I,
how-20
ever considerable variability in the data meant this DON drawdown could not be accu-rately quantified.
3.3 Diazotroph abundance and N2-fixation rates,δ15N in particulate N
The abundance of filamentous diazotrophic cyanobacteria remained low throughout the experiment with no significant bloom development (<6 µg C L−1, Fig. 5a). The most
25
dominant species,A. flos-aquae, had a maximum biomass of 4.9 µg C L−1
meso-BGD
12, 17507–17541, 2015
No observed effect of
ocean acidification on nitrogen biogeochemistry
A. J. Paul et al.
Title Page
Abstract Introduction
Conclusions References
Tables Figures
◭ ◮
◭ ◮
Back Close
Full Screen / Esc
Printer-friendly Version
Interactive Discussion
Discussion
P
a
per
|
Discussion
P
a
per
|
Discussion
P
a
per
|
Discussion
P
a
per
|
cosms (M1,t27), whereas the next most abundant species,Anabaenasp., had a maxi-mum biomass in the water column of 0.18 µg C L−1(M1,t17). Aphanizophyll, a pigment present inA. flos-aquaeandAnabaenasp. (Schluter et al., 2004), was detected in both suspended material in the water column, and in the sinking material collected in the sediment trap. Concentrations of this pigment increased at the end of Phase I
concur-5
rent with an increase in N2-fixation rates (Fig. 5). Although numbers in the mesocosms
remained generally low,A. flos-aquaeabundances based on microscopy counts and phytoplankton pigment analyses, were highest in Phases II/III and lowest in Phase I (Fig. 5).A. flos-aquae biomass outside the mesocosms was up to 30 µg C L−1 on t15
and is supported by high Aphanizophyll pigment concentrations of 109 ng (mg TPC)−1
10
also ont15(data not shown).
Rates of N2-fixation until t21 ranged from below the detection limit at the
begin-ning of the experiment, up to 4.4 nmol N L−1d−1 inside the mesocosms and up to 37.9 nmol L−1day−1 in the waters outside. We observed a substantial increase in the
N2-fixation rates from 2.6 to 4.4 nmol L− 1
day−1up to 50 to 60 nmol L−1day−1 between
15
t21andt23without any remarkable change in diazotroph abundance of the same mag-nitude (Fig. 5). This is also evident inA. flos-aquae biomass-related N2-fixation rates (Fig. 6). This increase coincided with the use of a new 15N-N2 gas bottle with a lot number which was reported two years later as contaminated with 15N-labelled NH+4 and NO−3 by Dabundo et al. (2014) (Sigma Aldrich, Lot no. SZ1670V). The measured
20
rates fromt23on are therefore not exclusively N2-fixation and are not reliable thus they were excluded from analyses. In addition to the bottle assays, the15N-N2isotope tracer
was also added directly to all mesocosms except for M1 (control) and M7. Therefore these two mesocosms were not affected by this contamination issue. Hence, the nat-ural abundanceδ15N data from the suspended material in the water column and the
25
sinking material from the sediment trap is reported for the entire experiment (t-3until
BGD
12, 17507–17541, 2015
No observed effect of
ocean acidification on nitrogen biogeochemistry
A. J. Paul et al.
Title Page
Abstract Introduction
Conclusions References
Tables Figures
◭ ◮
◭ ◮
Back Close
Full Screen / Esc
Printer-friendly Version
Interactive Discussion
Discussion
P
a
per
|
Discussion
P
a
per
|
Discussion
P
a
per
|
Discussion
P
a
per
|
isotopically enriched in15N but was in very low concentration and so was insignificant for the nutrient budget.
The natural abundance δ15N in suspended particulate N in the mesocosms de-creased during the period of higher Chlain Phase I from 6.0±0.5 ‰ ont1to 2.6±0.5 ‰ ont15(mean±S.D.). This indicated potential input of atmospheric N with a low δ15N
5
into particulate matter via N2-fixation during this period. A sharp decrease in δ15N in the sinking particulate material occurred on t17, the same day that considerable amounts of Aphanizophyll and Fucoxanthin were found in the sediment trap mate-rial (Fig. 5d and f, Fucoxanthin not shown). This was one day after the mesocosm walls were cleaned indicating that there were likely diazotrophic species and diatoms
10
attached to the mesocosm walls. Identification from microscope photos revealed the presence of filamentous cyanobacteria with heterocysts in the collected sediment trap material. Aside from this, there were no remarkable fluctuations inδ15N in either the suspended or sinking particulate matter pools, including aftert21in M1 and M7 (Fig. 5e and f).
15
Assessment of in situ N2-fixation rates based on 15
N -uptake from the combined dissolved N pool of NO−3, NH+4 and N2 was abandoned due to high uncertainty in
ini-tial 15N enrichment and concentrations of the combined dissolved N pool, and fast saturation of label uptake after ca. four days (two successive sampling days). To as-sess the contribution of diazotrophy to N supply in the mesocosms, we calculated
20
a theoretical cumulative diazotrophic N input using measured N2-fixation rates from bioassays up untilt21(M1=20 nmol N L−1), and then assumed a constant N
2-fixation
rate of 4 nmol N L−1d−1into particulate N between t23and t43(total=80 nmol N L−1). The assessment for between t23and t43 is based on the premise of continued ele-vatedA. flos-aquaebiomass and assuming 50 % exudation of fixed N as DON or NH+4
25
BGD
12, 17507–17541, 2015
No observed effect of
ocean acidification on nitrogen biogeochemistry
A. J. Paul et al.
Title Page
Abstract Introduction
Conclusions References
Tables Figures
◭ ◮
◭ ◮
Back Close
Full Screen / Esc
Printer-friendly Version
Interactive Discussion
Discussion
P
a
per
|
Discussion
P
a
per
|
Discussion
P
a
per
|
Discussion
P
a
per
|
estimations. We calculated corresponding N requirement of the plankton community of 27.2 nmol N L−1d−1from the average phosphorus uptake rate across all treatments of 1.7 nmol PO34−L−1d−1 fromt1–t30 as reported by Nausch et al. (2015), by assum-ing Redfield nutrient uptake stoichiometry (16N : 1P). This is almost seven times larger than estimated daily diazotrophic N inputs of∼4 nmol N L−1d−1, corresponding to 14 %
5
of calculated community N requirement.
Low filamentous diazotrophic cyanobacteria abundances exacerbated the inherent sampling error in both microscopy and pigment analyses due to patchy distribution and the tendency of filaments to aggregate. Hence, unfortunately no reliable statistical analyses on the effect of higher fCO2 on diazotroph abundance or marker pigment
10
concentration could be undertaken, for any phase of the experiment. Any potential CO2 effect on diazotroph abundance was also not obvious on visual data inspection, and no effect could be detected on N2-fixation rates orδ
15
N natural abundance in suspended particulate matter from the water column or sediment trap particulate matter up until
t21(Table 1), when rates were reliable and there was data from a sufficient number of
15
CO2treatments.
4 Discussion
4.1 Effects of elevated CO2on diazotrophic N inputs
Bioavailable N was present in low concentrations and was probably the limiting macronutrient in the plankton community. Hence, higher phytoplankton biomass and
20
lower phosphate concentrations at higher CO2observed in this same mesocosm study (Paul et al., 2015), may have suggested relief of N limited growth by potentially in-creased N2-fixation. However we have no strong evidence to support this
hypothe-sis based on N pool standing stocks and estimated diazotrophic N inputs. The only statistically significant, but very minor, correlation was a positive relationship between
25
CO2 and PON concentrations (Fig. 3b, 0.08 µmol L− 1
BGD
12, 17507–17541, 2015
No observed effect of
ocean acidification on nitrogen biogeochemistry
A. J. Paul et al.
Title Page
Abstract Introduction
Conclusions References
Tables Figures
◭ ◮
◭ ◮
Back Close
Full Screen / Esc
Printer-friendly Version
Interactive Discussion
Discussion
P
a
per
|
Discussion
P
a
per
|
Discussion
P
a
per
|
Discussion
P
a
per
|
=1.75×10⁻⁴µmol L−1µatm−1, data from Paul et al., 2015). No significant difference in N2-fixation rates (untilt21) orA. flos-aquae abundance at elevated CO2 compared to
the ambient treatments was detected (Table 1, Fig. 5). Phosphate turnover rates, a po-tential indicator of P demand for N2-fixation, were also unaffected by CO2in Phases I
or II (Nausch et al., 2015). These variables (N2-fixation and phosphate uptake rates)
5
provide a more sensitive measure of turnover rates of N and P than assessing changes in N pool standing stocks in this tightly-coupled regenerative plankton community. Un-fortunately, we only have reliable N2-fixation rates from incubations untilt21due to
con-tamination of15N-N2gas with bioavailable N compounds (Dabundo et al., 2014) and not after∼t25when significant CO2-related differences in C and P pools were apparent.
10
Hence, in the later stages of the experiment (Phase II and III), it is possible that there was a divergence in N2-fixation rates between treatments that was missed, despite low abundances ofA. flos-aquae, the dominant filamentous diazotrophic cyanobacterium present. Nonetheless we estimate that the contribution of diazotrophy to N supply in the mesocosms over the study duration of 43 days was small (∼200 nmol L−1).
Maxi-15
mum measured N2-fixation rates of 4.4 nmol N L− 1
d−1were low compared to reported for the Baltic Sea in mid-summer which range from 1.7 up to 550 nmol N L−1d−1 (Far-nelid et al., 2013; Ohlendieck et al., 2000, 2007; Wasmund et al., 2001). This is due to the rather lowA. flos-aquaebiomass in the mesocosms compared to literature values (this study: maximum biomass=5 µg C L−1integrated over 0–17 m; Gulf of Finland: 22–
20
26 µg C L−1in the surface 5 m, 6–7 µg C L−1 at 20 m deep in July, Laamanen and Ku-osa, 2005). Thus even if all newly-fixed N by diazotrophs was transferred to diazotroph and plankton biomass (i.e PON pool), this small accumulation would most likely remain below the detection limits in the suspended PON pool (∼10 %=0.3 µmol L−1). On top of this, any CO2–related differences in N2-fixation would be near impossible to resolve
25
in this small contribution by diazotrophs.
BGD
12, 17507–17541, 2015
No observed effect of
ocean acidification on nitrogen biogeochemistry
A. J. Paul et al.
Title Page
Abstract Introduction
Conclusions References
Tables Figures
◭ ◮
◭ ◮
Back Close
Full Screen / Esc
Printer-friendly Version
Interactive Discussion
Discussion
P
a
per
|
Discussion
P
a
per
|
Discussion
P
a
per
|
Discussion
P
a
per
|
Wasmund et al. (1997); this study 8–16◦C, Paul et al., 2015). Nevertheless our results
from this CO2 manipulation study are in agreement with studies from both the
ma-rine (Böttjer et al., 2014; Law et al., 2012) and freshwater (Shapiro, 1997; Yamamoto, 2009) realms which detected no significant effect of decreased pH/increased CO2 on diazotroph abundance and/or activity in natural plankton communities. These four
inde-5
pendent studies all contradict physiological investigations in single-strain culture exper-iments where diazotroph growth and activity was modulated by CO2 availability (e.g. Barcelos e Ramos et al., 2007; Czerny et al., 2009; Eichner et al., 2014; Fu et al., 2008; Hutchins et al., 2013; Wannicke et al., 2012). Diazotrophic organisms typically have slower growth rates than other organisms. Hence any potential influence of ocean
10
acidification on their physiology may take longer to become apparent in biogeochemical parameters sampled in larger-scale field studies. However to the best of our knowledge, there are no direct N2-fixation rate measurements from CO2-manipulation studies with
A. flos-aquae in the field which could shed light on any underlying physiological
re-sponse of this diazotroph and confirm laboratory findings in the field. Furthermore,
15
high grazing pressure, hence top-down control, particularly after t17 (Lischka et al., 2015) may have overridden any potential CO2effect of bottom-up control on diazotroph
growth.
In addition to these highly visible filamentous N2-fixers, there is growing evidence to support the role of heterotrophic and non-phototrophic N2-fixation by smaller unicellular
20
organisms in diverse ecosystems (Halm et al., 2012; Loescher et al., 2014; Moisander et al., 2010; Zehr et al., 2008) including in the Baltic Sea and Kattegat (Bentzon-Tilia et al., 2015; Farnelid et al., 2009), which cannot be quantified by common microscopic methods used in this experiment. Hence, while there appeared to be a good correla-tion betweenA. flos-aquaeabundance and N2-fixation rates untilt21in this study, we
25
cannot rule out the contribution of heterotrophic organisms to the measured rates. How-ever, regardless of the diazotroph community present, N2-fixation rates were low and
di-BGD
12, 17507–17541, 2015
No observed effect of
ocean acidification on nitrogen biogeochemistry
A. J. Paul et al.
Title Page
Abstract Introduction
Conclusions References
Tables Figures
◭ ◮
◭ ◮
Back Close
Full Screen / Esc
Printer-friendly Version
Interactive Discussion
Discussion
P
a
per
|
Discussion
P
a
per
|
Discussion
P
a
per
|
Discussion
P
a
per
|
azotroph abundance (Fig. 5) were significantly influenced by CO2 nor that this could explain the observed higher particulate matter concentrations or lower phosphate con-centrations in the higher CO2 treatments (Paul et al., 2015) based on hypothesised
relief of N-limitation.
In this area of the Baltic Sea, plankton communities, containing filamentous
dia-5
zotrophic cyanobacteria, are exposed to large diurnal and seasonal changes in pH (Almén et al., 2014; Brutemark et al., 2011). In addition, filamentous cyanobacteria form characteristic surface aggregations, similar to the tufts and puffs formed by
Tri-chodesmium. Inside these aggregations, microenvironments can create substantially
different conditions compared to the surrounding water with large diurnal fluctuations
10
in pH (7.4 vs. 9.0) and O2 concentrations (∼150–450 µmol O2 L− 1
) and thus also in-organic carbon availability (Ploug, 2008). Hence natural exposure to highly variable carbonate chemistry conditions may have also played a role in dampening any poten-tial influence of ocean acidification in this plankton community.
4.2 Evidence from N pools of the importance of regenerative production and
15
effects of CO2
Productivity in this plankton community appeared to be dominated by regenerative pro-duction (sensu Dugdale and Goering, 1967) under low nitrate availability during Phase I, as has been observed in summer plankton communities in the Baltic Sea (Kupari-nen, 1987; Sahlsten and Sörensson, 1989; Tammi(Kupari-nen, 1995). DON appeared to be
20
a more important N source than N derived from N2-fixation. Any relatively fresh and labile N-rich dissolved organic matter (DOM) present after the decline of the spring bloom was likely remineralised by the bacterial community. Here, simultaneous draw-down of DSi and DON betweent-1 and t15 suggests that in particular diatoms, also persisting from the spring bloom, were beneficiaries of this organic N turnover.
Avail-25
BGD
12, 17507–17541, 2015
No observed effect of
ocean acidification on nitrogen biogeochemistry
A. J. Paul et al.
Title Page
Abstract Introduction
Conclusions References
Tables Figures
◭ ◮
◭ ◮
Back Close
Full Screen / Esc
Printer-friendly Version
Interactive Discussion
Discussion
P
a
per
|
Discussion
P
a
per
|
Discussion
P
a
per
|
Discussion
P
a
per
|
by the heterotrophic community particularly in Phase I and Phase II. Although there is no indication of a high level of NH+4 production above the variability in the data set, we presume this bioavailable NH+4 would have been very quickly assimilated into particu-late N in the N-limited plankton community. This rate of N regeneration probably limited net phytoplankton growth such that significant phytoplankton biomass could not
accu-5
mulate in the water column. Nevertheless, neither the readily available NH+4 nor the nitrate pool were fully exploited by the plankton assemblage with up to 50 nmol L−1 of nitrate and 170 nmol L−1of NH+4 remaining at the end of the study period ont43. In fact, nitrate concentrations continually increased throughout the experiment at an average net rate of 1 nmol N L−1day−1(Fig. 1c) despite proportionally high phosphate
availabil-10
ity. This suggests a small net imbalance in N cycle processes and may be connected to ammonium inhibition of nitrate uptake during spring-bloom decline and post-bloom period in the study area (Tamminen, 1995), leading to this small accumulation of nitrate in the water column.
No significant effect of CO2 was detected on the DON pool, nor DSi drawdown,
15
or PON or BSi cumulative sinking fluxes (see also Paul et al., 2015 in this Special Issue). Likewise, if there was any difference in uptake of N from the N-rich DOM pool (N : P∼80 : 1) between CO2treatments, we could not detect the small signal (nmol L−
1
) outside of the analytical precision (µmol L−1) of the DON measurements. Thus this organic N drawdown via regenerative production in diatoms in this study appeared to
20
be either unaffected or immeasurable by simulated ocean acidification.
5 Summary
Plankton biomass build-up in this study was limited by low inorganic N availability there-fore organic N pools were utilised supporting regenerative production during the more productive period in Phase I, with diatoms benefitting from this N turnover. Estimated
25
N2-fixation rates and abundances of the most dominant filamentous diazotroph,A.
contribu-BGD
12, 17507–17541, 2015
No observed effect of
ocean acidification on nitrogen biogeochemistry
A. J. Paul et al.
Title Page
Abstract Introduction
Conclusions References
Tables Figures
◭ ◮
◭ ◮
Back Close
Full Screen / Esc
Printer-friendly Version
Interactive Discussion
Discussion
P
a
per
|
Discussion
P
a
per
|
Discussion
P
a
per
|
Discussion
P
a
per
|
tion to overall N supply in this plankton community. Hence we did not observe relief of N limitation and stimulation of a summer plankton bloom by non-diazotrophic organ-isms. Indeed, dissolved inorganic nitrate present increased throughout the experiment indicating higher supply than consumption, despite a considerable phosphate excess present.
5
We detected no significant differences in N pool sizes between CO2treatments apart
from the PON pool. However, the detected positive effect of CO2 on PON standing stocks was minor (<3 % difference in PON concentration). Thus N uptake rates were well balanced with supply or any net differences were too small to be detected in N pool sizes across the range of simulated ocean acidification scenarios. In addition, we
10
found no conclusive evidence from our data untilt21 (N2-fixation rates, A. flos-aquae
abundances, naturalδ15N abundances) that CO2had a measurable impact on N inputs
via diazotrophy. The absence of any detectable effect may have been influenced by the low abundances of filamentous diazotrophic cyanobacteria in this study. However, the lack of response was consistent with other studies of diazotrophic organisms in
nat-15
ural plankton communities where resource competition with other plankton functional groups and top-down control may also play important roles in mediating the physiolog-ical response of N2-fixing organisms.
Nonetheless, it appears that increased CO2may have slightly enhanced the ability
of the N-limited plankton community in the Baltic Sea to exploit the low N sources
avail-20
able thereby potentially explaining lower phosphate concentrations, higher particulate matter concentrations and Chla observed under higher CO2 (Paul et al., 2015).
How-ever, we have no direct evidence of increased new N inputs via diazotrophy or changed N biogeochemistry within the first three weeks and no conclusive indirect evidence from N pool sizes up to six weeks after CO2 manipulation. Therefore we conclude that
ele-25
vated CO2had no observable impact on the N cycle in this summer Baltic Sea plankton community.
BGD
12, 17507–17541, 2015
No observed effect of
ocean acidification on nitrogen biogeochemistry
A. J. Paul et al.
Title Page
Abstract Introduction
Conclusions References
Tables Figures
◭ ◮
◭ ◮
Back Close
Full Screen / Esc
Printer-friendly Version
Interactive Discussion
Discussion
P
a
per
|
Discussion
P
a
per
|
Discussion
P
a
per
|
Discussion
P
a
per
|
we would like to thank Andrea Ludwig for co-ordinating the campaign logistics and assistance with CTD operations, the diving team, as well as Kerstin Nachtigall for analyses. Thank you also to Dana Hellemann, Francois-Eric Legiret, Jana Meyer, Michael Meyerhöfer, Jehane Ouriqua and Michael Sswat for assistance in sampling and analyses. We would also like to sincerely thank the Tvärminne Zoological Station for their warm hospitality, support and use of
5
facilities for this experiment. We also gratefully acknowledge the captain and crew of R/VAlkor for their work transporting, deploying and recovering the mesocosms. This collaborative project was funded by the Cluster of Excellence “The Future Ocean” (Project CP1141) and by BMBF projects BIOACID II (FKZ 03F06550), SOPRAN Phase II (FKZ 03F0611), and MESOAQUA (grant agreement number 228224).
10
The article processing charges for this open-access publication were covered by a Research Centre of the Helmholtz Association.
References
Almén, A.-K., Vehmaa, A., Brutemark, A., and Engström-Öst, J.: Coping with climate change?
15
Copepods experience drastic variations in their physicochemical environment on a diurnal basis, J. Exp. Mar. Biol. Ecol., 460, 120–128, doi:10.1016/j.jembe.2014.07.001, 2014. Badr, E.-S. A., Achterberg, E. P., Tappin, A. D., Hill, S. J., and Braungardt, C. B.: Determination
of dissolved organic nitrogen in natural waters using high-temperature catalytic oxidation, TrAC-Trend. Anal. Chem., 22, 819–827, doi:10.1016/S0165-9936(03)01202-0, 2003.
20
Barcelos e Ramos, J., Biswas, H., Schulz, K., LaRoche, J., and Riebesell, U.: Effect of rising at-mospheric carbon dioxide on the marine nitrogen fixerTrichodesmium, Global Biogeochem. Cy., 21, GB2028, doi:10.1029/2006GB002898, 2007.
Barlow, R. G., Cummings, D. G., and Gibb, S. W.: Improved resolution of mono- and divinyl chlorophyllsaandband zeaxanthin and lutein in phytoplankton extracts using reverse phase
25
C-8 HPLC, Mar. Ecol.-Prog. Ser., 161, 303–307, doi:10.3354/meps161303, 1997.
Bentzon-Tilia, M., Traving, S. J., Mantikci, M., Knudsen-Leerbeck, H., Hansen, J. L. S., Markager, S., and Riemann, L.: Significant N2 fixation by heterotrophs, photoheterotrophs and heterocystous cyanobacteria in two temperate estuaries, ISME J., 9, 273–285, doi:10.1038/ismej.2014.119, 2015.
BGD
12, 17507–17541, 2015
No observed effect of
ocean acidification on nitrogen biogeochemistry
A. J. Paul et al.
Title Page
Abstract Introduction
Conclusions References
Tables Figures
◭ ◮
◭ ◮
Back Close
Full Screen / Esc
Printer-friendly Version
Interactive Discussion
Discussion
P
a
per
|
Discussion
P
a
per
|
Discussion
P
a
per
|
Discussion
P
a
per
|
Böttjer, D., Karl, D. M., Letelier, R. M., Viviani, D. A., and Church, M. J.: Experimental assess-ment of diazotroph responses to elevated seawater pCO2 in the North Pacific Subtropical Gyre, Global Biogeochem. Cy., 28, 601–616, doi:10.1002/2013GB004690, 2014.
Boxhammer, T., Bach, L. T., Czerny, J., and Riebesell, U.: Technical note: sampling and pro-cessing of mesocosm sediment trap material for quantitative biogeochemical analysis, for
5
submission for this Special Issue in Biogeosciences, submitted, 2015.
Brutemark, A., Engström-Öst, J., and Vehmaa, A.: Long-term monitoring data reveal pH dy-namics, trends and variability in the western Gulf of Finland, Oceanol. Hydrobiol. St., 40, 91–94, doi:10.2478/s13545-011-0034-3, 2011.
Czerny, J., Barcelos e Ramos, J., and Riebesell, U.: Influence of elevated CO2concentrations
10
on cell division and nitrogen fixation rates in the bloom-forming cyanobacteriumNodularia spumigena, Biogeosciences, 6, 1865–1875, doi:10.5194/bg-6-1865-2009, 2009.
Dabundo, R., Lehmann, M. F., Treibergs, L., Tobias, C. R., Altabet, M. A., Moisander, P. H., and Granger, J.: The contamination of commercial15N2 gas stocks with15N-labeled nitrate and ammonium and consequences for nitrogen fixation measurements, PLoS ONE, 9, e110335,
15
doi:10.1371/journal.pone.0110335, 2014.
Derenbach, J.: Zur Homogenisation des Phytoplanktons für die Chlorophyllbestimmung, Kieler Meeresforschungen, 25, 166–171, 1969.
Deutsch, C., Sarmiento, J. L., Sigman, D. M., Gruber, N., and Dunne, J. P.: Spatial coupling of nitrogen inputs and losses in the ocean, Nature, 445, 163–167, doi:10.1038/nature05392,
20
2007.
Dugdale, R. and Goering, J.: Uptake of new and regenerated forms of nitrogen in primary productivity, Limnol. Oceanogr., 12, 196–206, 1967.
Eichner, M., Rost, B., and Kranz, S. A.: Diversity of ocean acidification effects on marine N2 fixers, J. Exp. Mar. Biol. Ecol., 457, 199–207, doi:10.1016/j.jembe.2014.04.015, 2014.
25
Engström-Öst, J., Hogfors, H., El-Shehawy, R., De Stasio, B., Vehmaa, A., and Gorokhova, E.: Toxin-producing cyanobacterium Nodularia spumigena, potential competitors and graz-ers: testing mechanisms of reciprocal interactions, Aquat. Microb. Ecol., 62, 39–48, doi:10.3354/ame01456, 2011.
Farnelid, H., Oberg, T., and Riemann, L.: Identity and dynamics of putative N2-fixing
picoplank-30
BGD
12, 17507–17541, 2015
No observed effect of
ocean acidification on nitrogen biogeochemistry
A. J. Paul et al.
Title Page
Abstract Introduction
Conclusions References
Tables Figures
◭ ◮
◭ ◮
Back Close
Full Screen / Esc
Printer-friendly Version
Interactive Discussion
Discussion
P
a
per
|
Discussion
P
a
per
|
Discussion
P
a
per
|
Discussion
P
a
per
|
Farnelid, H., Bentzon-Tilia, M., Andersson, A. F., Bertilsson, S., Jost, G., Labrenz, M., Jür-gens, K., and Riemann, L.: Active nitrogen-fixing heterotrophic bacteria at and below the chemocline of the central Baltic Sea, ISME J., 7, 1413–1423, doi:10.1038/ismej.2013.26, 2013.
Fu, F., Mulholland, M., Garcia, N., Beck, A., Bernhardt, P., Warner, M., Sanudo-Wilhelmy, S.,
5
and Hutchins, D.: Interactions between changingpCO2, N2fixation, and Fe limitation in the marine unicellular cyanobacteriumCrocosphaera, Limnol. Oceanogr., 53, 2472–2484, 2008. Gustafsson, Ö., Gelting, J., Andersson, P., Larsson, U., and Roos, P.: An assessment of upper
ocean carbon and nitrogen export fluxes on the boreal continental shelf: a 3-year study in the open Baltic Sea comparing sediment traps,234Th proxy, nutrient, and oxygen budgets,
10
Limnol. Oceanogr.-Meth, 11, 495–510, doi:10.4319/lom.2013.11.495, 2013.
Halm, H., Lam, P., Ferdelman, T. G., Lavik, G., Dittmar, T., LaRoche, J., D’Hondt, S., and Kuypers, M. M. M.: Heterotrophic organisms dominate nitrogen fixation in the South Pacific Gyre, ISME J., 6, 1238–1249, doi:10.1038/ismej.2011.182, 2012.
Hansen, H. P. and Koroleff, F.: Determination of nutrients, in: Methods of Seawater Analysis,
15
edited by: Grasshoff, K., Kremling, K., and Ehrhardt, M., Wiley Verlag Chemie GmbH, Wein-heim, Germany, 159–228, 1999.
HELCOM: Manual for Marine Monitoring in the COMBINE Programme of HELCOM, Helsinki Commission, Helsinki, available at: http://helcom.fi/Documents/Action%20areas/ Monitoring%20and%20assessment/Manuals%20and%20Guidelines/Manual%20for%
20
20Marine%20Monitoring%20in%20the%20COMBINE%20Programme%20of%20HELCOM. pdf, last access: 20 June 2012.
Hogfors, H., Motwani, N. H., Hajdu, S., El-Shehawy, R., Holmborn, T., Vehmaa, A., Engström-Öst, J., Brutemark, A., and Gorokhova, E.: Bloom-forming cyanobacteria sup-port copepod reproduction and development in the Baltic Sea, PLoS One, 9, e112692,
25
doi:10.1371/journal.pone.0112692, 2014.
Hoppenrath, M., Elbrächter, M., and Drebes, G. (Eds.): Marine Phytoplankton, Schweizerbart Science Publishers, Stuttgart, Germany, 2009.
Hutchins, D., Fu, F., Zhang, Y., Warner, M., Feng, Y., Portune, K., Bernhardt, P., and Mulhol-land, M.: CO2 control of TrichodesmiumN2 fixation, photosynthesis, growth rates, and
el-30
BGD
12, 17507–17541, 2015
No observed effect of
ocean acidification on nitrogen biogeochemistry
A. J. Paul et al.
Title Page
Abstract Introduction
Conclusions References
Tables Figures
◭ ◮
◭ ◮
Back Close
Full Screen / Esc
Printer-friendly Version
Interactive Discussion
Discussion
P
a
per
|
Discussion
P
a
per
|
Discussion
P
a
per
|
Discussion
P
a
per
|
Hutchins, D. A., Fu, F.-X., Webb, E. A., Walworth, N., and Tagliabue, A.: Taxon-specific response of marine nitrogen fixers to elevated carbon dioxide concentrations, Nat. Geosci., 6, 790–795, doi:10.1038/ngeo1858, 2013.
Kahru, M. and Elmgren, R.: Multidecadal time series of satellite-detected accumulations of cyanobacteria in the Baltic Sea, Biogeosciences, 11, 3619–3633,
doi:10.5194/bg-11-3619-5
2014, 2014.
Kérouel, R. and Aminot, A.: Fluorometric determination of ammonia in sea and estuarine waters by direct segmented flow analysis, Mar. Chem., 57, 265–275, doi:10.1016/S0304-4203(97)00040-6, 1997.
Kirkkala, T., Helminen, H., and Erkkilä, A.: Variability of nutrient limitation in the Archipelago
10
Sea, SW Finland, Hydrobiologia, 363, 117–126, doi:10.1023/A:1003192831321, 1997. Kononen, K., Kuparinen, J., Mäkelä, K., Laanemets, J., Pavelson, J., and Nõmmann, S.:
Initia-tion of cyanobacterial blooms in a frontal region at the entrance to the Gulf of Finland, Baltic Sea, Limnol. Oceanogr., 41, 98–112, doi:10.4319/lo.1996.41.1.0098, 1996.
Kraberg, A., Baumann, M., and Durselen, C.-D.: Coastal Phytoplankton: Photo Guide for
North-15
ern European Seas, Pfeil, Munich, Germany, 2010.
Kranz, S. A., Levitan, O., Richter, K.-U., Prasil, O., Berman-Frank, I., and Rost, B.: Combined ef-fects of CO2and light on the N2-fixing cyanobacteriumTrichodesmiumIMS101: physiological responses, Plant Physiol., 154, 334–345, doi:10.1104/pp.110.159145, 2010.
Kuparinen, J.: Production and respiration of overall plankton and ultraplankton
communi-20
ties at the entrance to the Gulf of Finland in the Baltic Sea, Mar. Biol., 93, 591–607, doi:10.1007/BF00392797, 1987.
Laamanen, M. and Kuosa, H.: Annual variability of biomass and heterocysts of the N2-fixing cyanobacterium Aphanizomenon flos-aquae in the Baltic Sea with reference toAnabaena spp., andNodularia spumigena, Boreal Environ. Res., 10, 19–30, 2005.
25
Law, C. S., Breitbarth, E., Hoffmann, L. J., McGraw, C. M., Langlois, R. J., LaRoche, J., Marriner, A., and Safi, K. A.: No stimulation of nitrogen fixation by non-filamentous dia-zotrophs under elevated CO2 in the South Pacific, Glob. Change Biol., 18, 3004–3014, doi:10.1111/j.1365-2486.2012.02777.x, 2012.
Levitan, O., Rosenberg, G., Setlik, I., Setlikova, E., Grigel, J., Klepetar, J., Prasil, O., and
30
BGD
12, 17507–17541, 2015
No observed effect of
ocean acidification on nitrogen biogeochemistry
A. J. Paul et al.
Title Page
Abstract Introduction
Conclusions References
Tables Figures
◭ ◮
◭ ◮
Back Close
Full Screen / Esc
Printer-friendly Version
Interactive Discussion
Discussion
P
a
per
|
Discussion
P
a
per
|
Discussion
P
a
per
|
Discussion
P
a
per
|
Lischka, S., Bach, L. T., Schulz, K.-G., and Riebesell, U.: Micro- and mesozooplankton com-munity response to increasing levels of CO2 in the Baltic Sea: insights from a large-scale mesocosm experiment, for submission for this Special Issue in Biogeosciences, in prepara-tion, 2015.
Loescher, C. R., Großkopf, T., Desai, F. D., Gill, D., Schunck, H., Croot, P. L., Schlosser, C.,
5
Neulinger, S. C., Pinnow, N., Lavik, G., Kuypers, M. M. M., LaRoche, J., and Schmitz, R. A.: Facets of diazotrophy in the oxygen minimum zone waters offPeru, ISME J., 8, 2180–2192, doi:10.1038/ismej.2014.71, 2014.
Menden-Deuer, S. and Lessard, E. J.: Carbon to volume relationships for
dinoflag-ellates, diatoms, and other protist plankton, Limnol. Oceanogr., 45, 569–579,
10
doi:10.4319/lo.2000.45.3.0569, 2000.
Mohr, W., Grosskopf, T., Wallace, D., and LaRoche, J.: Methodological underestimation of oceanic nitrogen fixation rates, PLoS One, 5, e12583, doi:10.1371/journal.pone.0012583, 2010.
Moisander, P. H., Beinart, R. A., Hewson, I., White, A. E., Johnson, K. S., Carlson, C. A.,
15
Montoya, J. P., and Zehr, J. P.: Unicellular cyanobacterial distributions broaden the oceanic N2fixation domain, Science, 327, 1512 –1514, doi:10.1126/science.1185468, 2010.
Montoya, J. P., Voss, M., Kahler, P., and Capone, D. G.: A simple, high-precision, high-sensitivity tracer assay for N2fixation, Appl. Environ. Microbiol., 62, 986–993, 1996.
Moore, C. M., Mills, M. M., Langlois, R., Milne, A., Achterberg, E. P., La Roche, J., and
Gei-20
der, R. J.: Relative influence of nitrogen and phosphorous availability on phytoplankton physiology and productivity in the oligotrophic sub-tropical North Atlantic Ocean, Limnol. Oceanogr., 53, 291–305, doi:10.4319/lo.2008.53.1.0291, 2008.
Moore, C. M., Mills, M. M., Arrigo, K. R., Berman-Frank, I., Bopp, L., Boyd, P. W., Gal-braith, E. D., Geider, R. J., Guieu, C., Jaccard, S. L., Jickells, T. D., La Roche, J., Lenton, T. M.,
25
Mahowald, N. M., Marañón, E., Marinov, I., Moore, J. K., Nakatsuka, T., Oschlies, A., Saito, M. A., Thingstad, T. F., Tsuda, A., and Ulloa, O.: Processes and patterns of oceanic nutrient limitation, Nat. Geosci., 6, 701–710, doi:10.1038/ngeo1765, 2013.
Nausch, M., Bach, L. T., Czerny, J., Goldstein, J., Grossart, H.-P., Hellemann, D., Hornick, T., Achterberg, E. P., Schulz, K.-G., and Riebesell, U.: Effects of CO2 perturbation on
phos-30