Artigo
*e-mail: lortiz@cideteq.mx
COMPETITION BETWEEN THE REACTION MEDIUM AND NANOSTRUCTURED ZnO IN THE PHOTOCATALYTIC DEGRADATION OF ANTHRACENE. TOWARD AN OPTIMAL PROCESS FOR POLYCYCLIC AROMATIC HYDROCARBONS REMEDIATION
Blanca L. Martínez-Vargasa, Jesús A. Díaz-Reala, Yolanda Reyes-Vidala, J. L. Rodríguez-Lópezb, Raúl Ortega-Borgesa and
Luis Ortiz-Fradea,*
aElectrochemical Department, Centro de Investigación y Desarrollo Tecnológico en Electroquímica, Parque Tecnológico Querétaro Sanfandila SN, C. P. 76703, Pedro Escobedo, Querétaro, México.
bAdvanced Materials Department, Instituto Potosino de Investigación Científica y Tecnológica, A. C. Camino a la Presa San José 2055, Lomas 4ª Secc. C.P. 78216, San Luís Potosí, México.
Recebido em 20/02/2016; aceito em 26/07/2016; publicado na web em 02/09/2016
Contamination with polycyclic aromatic hydrocarbons (PAHs) is considered an important health issue due to the toxicity of these compounds. Photocatalytic degradation of anthracene, a representative molecule of PAHs, using the high quantum yield semiconductor ZnO, has been reported. The solubility of anthracene in water makes necessary to use mixtures with organic solvents in fundamental degradation studies. It is well known that some organic solvents participate in the photochemical transformation of this molecule. In the PAHs photocatalysis, the competition between a semiconductor and solvents has not reported. Therefore, in this work, we decided to study the photocatalytic degradation of anthracene with two common reaction media and nanostructured ZnO. The semiconductor was obtained by a one pot method which consists in an alkaline hydrolysis of Zn(CH3COO)2⋅2H2O in ethanol.
Nanoparticles size in colloidal dispersion was calculated using UV-Vis spectroscopy and High Resolution Transmission Electron Microcopy (HR-TEM). ZnO powder was isolated and characterized by X-ray diffraction to be used in photocatalytic experiments. Surface area determination and photocurrent spectroscopic experiments were also carried out. Linear sweep voltammetries under darkness and UV-Vis irradiation indicate a charge separation due to photoexcitation. Photocatalytic experiments in ethanol:water pH 12 (1:1) and acetone:water pH 12 (1:1), with and without ZnO was explored. The results demonstrated that ethanol:water and acetone:water promotes the photo-transformation of anthracene to 9,10-anthraquinone. Meanwhile, ZnO transformed anthracene to benzoic acid and to 9,10-anthraquinone in ethanol:water and acetone:water, respectively. A faster photochemical kinetic is observed when acetone was used as solvent in the presence and in the absence of ZnO.
Keywords: ZnO nanoparticles; reaction medium; PAHs; photodegradation; anthracene.
INTRODUCTION
Anthropogenic activities have caused a wide distribution of polycyclic aromatic hydrocarbons (PAHs) in atmosphere, soil, sediment and water. This group of compounds has been associated with mutagenic and carcinogenic activity, which makes them dangerous for human health.1 The US Environmental Protection Agency (EPA) has included 16 of these compounds as priority pollutants.2 For this reason, oxidation degradation processes of PAHs including the model molecule anthracene have been reported. Microbial degradation has been used to achieve this goal. However, low efficiency and long time are the main disadvantages.3 Heterogeneous photocatalysis with nanostructured semiconductors has attracted recently interest, due to the low cost and high efficiency in the treatment of recalcitrant contaminants. The high quantum yield of ZnO and easy methods of preparation in comparison with other typical semiconductors such as TiO2 has been a motivation to use this material.4-6 Currently, there are few studies for the degradation of PAHs with synthetic ZnO and GaN:ZnO.7,8 In these type of studies the use of methanol, dichloromethane, acetonitrile,9 ethyl acetate and acetone10,11 is necessary due to the low solubility PAHs in water. On the other hand, it has been demonstrated that PAHs are photo-transformed in the presence of pure organic solvents or in water mixtures.12-14 This fact makes difficult to identify the role of solvent in the in the photochemical transformation of PAHs
in the presence of semiconductors.Hence, we decided to study the photocatalytic reaction of anthracene, using nanostructured ZnO and two reaction media to understand the competition between the semiconductor ZnO and typical solvents (ethanol and acetone) in the transformation of a representative molecule of PHAs. This study is intended to design simpler methods to improve photocatalytic degradation of polycyclic aromatic hydrocarbons.
EXPERIMENTAL SECTION
Reagents
Zinc acetate dihydrate, Zn(CH3COO)2⋅2H2O (J. T. Baker, 99 %); sodium hydroxide, NaOH (J. T. Baker, 98.2 %); ethyl alcohol absolute, CH3CH2OH (Aldrich 99 %); acetone, CH3COCH3 (Aldrich 99 %); hydrochloric acid, HCl (J. T. Baker; 37.3 %); anthracene, C14H10 (Aldrich 99 %); dichloromethane, CH2Cl2 (J. T. Baker 99 %); were used without further purification; multicomponent solution (RESTEK 99 %); ultrapure water (18 MΩ cm-1) was obtained from a UV Millipore system.
Synthesis of colloidal ZnO nanoparticles
(0.0272 mmol) of Zn(CH3COO)2 ⋅2H2O was dissolved in 25 mL of ethanol at room temperature, followed by the addition of 0.325 mL of 0.2 mol L-1 NaOH in ethanol solution. The reaction mixture was heated for 2 hours at 60 °C.
Zn(CH3COO)2-2H2O + 2NaOH ZnO + 2Na(CH3COO) + H2O (1)
The obtained colloidal dispersion was characterized by UV-Vis spectroscopy, using a Thermo Scientific Evolution Array spectrophotometer. Emission spectra was acquired with a spectrofluorometer Horiba Jobin Yvon/Fluorolog (λexc = 350 nm) from 315 to 800 nm. The morphology and size distribution of the ZnO nanoparticles were studied by high-resolution transmission electron microscopy (HR-TEM) (Tecnai F30-300 kV).
Isolation and characterization of ZnO powder
Freshly prepared colloidal dispersion of ZnO nanoparticles in ethanol was concentrated by slow evaporation with airflow over the solution, using a commercial 12 V fan until a slurry white solution was obtained. The dispersion was centrifuged at 3500 rpm for 20 minutes. A white powder was separated and washed with ethanol and acetone. XRD analyses were performed placing the sample over a glass slide, using a Bruker-AXS D8 advance diffractometer (Cu Kαλ = 1.5406 Å). The collected data was refined by the Rietveld
method using the software FULLPROF SUITE.16,17 Thompson-Cox-Hastings pseudo-Voight function was used to model peak shape and preferred orientation. The background was modeled as a polynomial with 6 refined coefficients. The nitrogen adsorption–desorption isotherms were recorded using an Autosorb iQ2 equipment. The specific surface area was calculated by applying the BET equation to the nitrogen adsorption isotherm and the Barret–Joyner–Halenda (BJH) method to desorption branch of the nitrogen isotherm, respectively.
Electrochemical characterization
Electrochemical characterization was performed using ZnO deposit over photo-electrodes prepared by spin-coating technique with a home-made device, see Scheme 1. A ZnO suspension (15 mg mL-1 in ethanol) added at rate 60 µL min-1 with a rotating speed of 1800 rpm over a conducting glass substrate (SOLEMS, FTO 20 omhs). After spin-coating, a thermal annealing was performed at 200 °C (10 °C min-1, 1 h) under air. Electrical contact to the FTO was done with silver conducting paint (Radio Spares, 186-3593) to a copper wire and isolated with epoxy resin (3M, Scotch-weld DP-190). For all the experiments, a 0.1 mol L-1 NaOH solution (pH 12.9) outgassed with N2 was used as supporting electrolyte. The electrochemical measurements were performed at 25 °C in a three-electrode cell equipped with a quartz window, using a SP-300 Bio-logic potentiostat-galvanostat. A glassy carbon electrode and a reversible hydrogen electrode (RHE) served as counter and reference electrode, respectively.
Linear sweep voltammetry
Linear sweep voltammetry (LSV, v = 5 mV s-1) measurements were performed in a potential range from -0.2 to 1.2 V/RHE in the presence and in the absence of light. Photocurrent transient curves (v = 5 mV s-1) were obtained by light chopping (Lambda SC shutter controller) with on-off periods of 10 s. The effective irradiance power at electrode distance was 34 mW cm-2 using a 175 W Xenon lamp (Spectral Products ASB-XE-175EX polychromatic source).
Photocurrent spectroscopy
Photocurrent spectroscopy measurements were recorded with electrode polarization at 1.0 V/RHE and scanning wavelengths from 305 nm to 550 nm using a 175 W Xenon lamp (Spectral Products ASB-XE-175EX polychromatic source) coupled to a motorized monochromador (Horiba Jobin Ybon 0106-07-07). The quantum yield was also evaluated by photocurrent action spectra measurements. After lamp spectrum normalization, the IPCE (Incident Photon-to-electron Conversion Efficiency) was obtained.
Photocatalytic experiments
Photocatalytic experiments were performed at room temperature using a single 15 W UVC lamp with emission at 254 nm in order to avoid recombination processes. A quartz cell with PTFE stopper and path length of 1 cm was used as batch reactor. The distance between the cell surface and the lamp was 8 cm. The irradiation power (31.4 µW cm-2) was measured with a Radiometer Cole-Parmer UVX. A volume of 3.5 mL of anthracene was used, in a concentration of 20 ppm in ethanol:water pH 12 or acetone:water pH 12 solutions (1:1). Experiments in absence and in the presence of 1.5 mg of ZnO nanoparticles powder were carried out separately. The reaction solution was stirred in darkness for five minutes to establish the adsorption/ desorption equilibrium of anthracene on ZnO surface. Photocatalysis of anthracene (20 ppm) in pure ethanol and pure acetone were also evaluated. The total time in photocatalytic experiments was 60 minutes. UV-vis spectra were measured every 5 minutes changing the quartz cell from the photoreactor to the spectrophotometer. At end of reaction time, the mixture centrifuged to remove the photocatalyst. Then, volatile products were extracted with dichloromethane. The resulting solutions were analyzed by a gas chromatograph (Agilent 68.90 plus) containing a column of HP-5ms (5 %-phenyl)-methylpolysiloxane, coupled to a mass spectrometer (Agilent 59.73). Chromatographic analysis of solutions exposed directly to UV radiation was performed using a Waters (México) H-Class Acquity ultra-performance liquid chromatography system (UPLC), which included a quaternary solvent manager, photodiode array detector (PDA), cooling autosampler and an oven for analytical column. Chromatographic data were collected
Scheme 1. Home-made spin-coating experimental setup. An rpm controllable
and processed by Waters Empower3 chromatography software. Chromatographic separation was achieved on a Waters UPLC BEH C18 column (50 mm x 2.1 mm i.d., 1.7 µm), using a mobile phase composed of acetonitrile:water, 50:50 (v:v) at a flow rate of 0.4 mL min-1, a column temperature of 30 °C and an injection volume of 10 µL. A PDA detector system was employed obtaining chromatograms by recording a multi-wavelength set in the wavelength range 200 – 800 nm. Anthracene, 9,10-anthraquinone, and benzoic acid in different reaction media, with concentration ranging from 1 ppm to 20 ppm, were used as reference solutions for calibration curves. To separate ZnO residues, samples and standards were filtered using a 0.2 µm nylon membrane. RESULTS AND DISCUSSION
Synthesis and characterization of colloidal ZnO nanoparticles
In order to demonstrate the formation of ZnO in colloidal dispersion, UV-vis and emission spectrums were acquired. Figure 1a) shows a typical electronic absorption band edge at 367 nm, characteristic of ZnO nanoparticles in colloidal dispersion. Using this value, and according to the Wannier exciton model, it was possible to calculate a nanoparticle size considering spherical shape and the band gap value; of 5.18 ± 0.3 nm and 3.4 eV, respectively.18-22
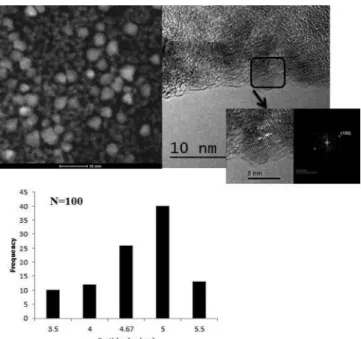
In Figure 1b) a broad green emission peak at 533 nm is observed when the sample is excited at 350 nm. This response could be related to surface defects such as singly ionized oxygen vacancy (VO+), described by Vanheusden K. et al.,23 the oxygen vacancy is an intrinsic donor in ZnO, suggesting that there are reactive sites with low recombination.24-26 Figure 2 shows a selected HR-TEM image of ZnO nanoparticles. Typical dhkl distances for wurtzite (hexagonal) ZnO phase were observed. By counting over 100 particles, a polydisperse size distribution nanoparticles ranging from 3.5 nm to 5.5 nm was calculated.
Characterization of the isolated powder of ZnO nanoparticles
For photocatalytic experiments, semiconductor powder was isolated. Hence, a completed characterization is presented in this section. Figure 3 shows a typical X-ray pattern of the ZnO powder. In the same graph, its corresponding Rietveld refinement plot is shown, indicating that the sample presents a wurtzite-type structure (JCPDS 89-1397). A good concordance between experimental and calculated diffraction patterns was observed. Nanoparticle size of 5.2 ± 0.1 nm was calculated using the Debye-Scherrer equation.
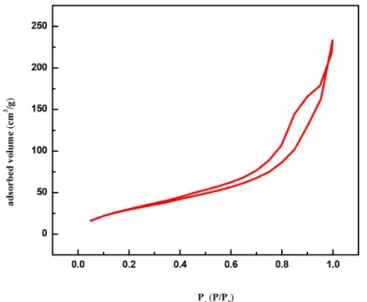
The surface area, calculated by the BET (Brunauer-Emmett-Teller) method shows a higher value for the synthesized colloidal ZnO (SBET= 122.22 m2 g-1) in comparison with commercial ZnO (SBET=12.94 m2 g-1). Figure 4 shows a typical adsorption-desorption isotherm, which according to IUPAC correspond to a mesoporous solid (type IV) with multilayers adsorption. Another characteristic observed from the isotherms is the difference between the adsorption and desorption curves, which suggests the possible development of hysteresis due to irregular capillary condensation, that can be understood as a process where a vapor phase (water) fills the porous of a material with a condensation of this phase and is related to an increase of Van der Waals interaction between molecules within the porous of material.27
Electrochemical characterization and band gap determination
Linear weep voltammetries under illumination and darkness using ZnO-FTO electrodes were carried out to demonstrate photo-induced
Figure 1. a) UV-vis absorption spectrum and b) Emission spectrum of the
colloid of ZnO nanoparticles in ethanol
Figure 2. HR-TEM micrograph selected of ZnO nanoparticles and its size
distribution
Figure 3. X-Ray pattern diffraction of ZnO nanoparticles powder and its
corresponding Rietveld refinement plot. Space group P63mc, a = 3.252 Å, b = 3.252 Å, c = 5.2102, α = 90°, β=90°, γ = 120°, χ2 = 2.0, R
charge separation and for band gap determination. Figure 5, shows a typical I vs E plot, where it can be observed at around 0.07 V/RHE where an electron-hole pair (e-/h+) separation process with no significant differences on Eonset. It is important to remark that, for semiconductor electrodes, the recombination is manifested as negative spikes in current density when illumination is cut-off, depending on the surface states and structural defects that are overcome when a strong electric field is achieved at high over potential in comparison with Eonset. In this case, the photocurrent, where recombination is not presented at E > 0.5 V/RHE. This is also confirmed by the chronoamperometric measurements presented in Figure 6. These experiments were recorded while polarizing at 1.0 V/RHE allowing the electrode to reach a stable current (dark current) and then irradiating it with polychromatic (UV-Vis) light. From such curves it is possible to conclude a very fast onset (On) and decay (Off) response to irradiation, which is analog to Figure 5 in the same potential range.28,29
The quantum yield was also evaluated by photocurrent action spectra measurements. These measurements were recorded while the electrodes were polarized at 1.0 V/RHE and the wavelengths was scanned from 305 to 550 nm. From linear voltammetry it was established that when the electrodes are polarized at high potential
values no recombination was observed and therefore reliable photocurrent spectroscopy could be measured. The IPCE (Incident Photon-to-electron Conversion Efficiency) is shown in Figure 7a). The absorption edge for colloidal ZnO occurs at λonset = 395 nm. Figure 7b) shows the Tauc plots for these electrodes, where the band-gap (Eg) was obtained from the intersection with X-axis (photon energy) of an extrapolated straight line where the absorption edge starts, see equation 2. The Eg value was 3.15 eV, which is smaller than the commercial material 3.22 eV.
(IPCE × hυ)2α(hυ – Eg) (2)
Stability of ZnO for photocatalytic experiments
The selection of pH for photocatalytic test was based on ZnO predominance diagrams (see Figure 8), calculated with Hydra Medusa software. In a similar experimental conditions and according to li-terature. It can be observed that for pH > 8 the predominant species is ZnO.30
Competition between ethanol:water and ZnO in the photocatalytic degradation of anthracene
Photochemical competition between ethanol and ZnO in anthracene transformation under UV radiation at 254 nmwas studied using UV-visible absorbance measurements at 325, 340, 357, and 377 nm, characteristic of π→π* electronic transitions. Figure 9 shows a typical degradation efficiency (Ct/C0) vs. time plot for pure (a) ethanol, (b) ethanol:water pH 12 and (c) ZnO-ethanol:water pH 12. When pure ethanol was used, the degradation of anthracene did not occur. On the other hand in reaction system containing ethanol:water (pH 12) a degradation efficiency of 30% was recorded at 25 minutes. After this time anthracene was not detected, yielding a yellowish solution with two new signals at 450 and 375 nm, associated to the presence of anthraquinone derivatives.31,32 In the presence of ZnO no change in color solution was observed and a degrataion efficiency of 60 % was achived at 55 minutes. Using integrated rate equations for chemical kinetic analysis the systems ethanol:water pH 12 in the presence and in the absence of ZnO presented a first-order reaction, with similar reaction-rate constant values. Table 1 summarizes kinetic parameters obtained by fitting data.33
A comparison between these kinetic parameters suggests a similar reaction mechanism at initial times. However, the fact that
Figure 4. Adsorption-desorption isotherms of ZnO isolated powder SBET=
122.22 m2 g-1
Figure 5. Linear sweep voltammograms recorded for the prepared ZnO
electrodes under darkness, UV-Vis light and transient curves. V = 5 mV s-1 with I = 34 mW cm-2
Figure 6. Chronoamperometric (1.0 V/RHE) response when UV-Vis light was
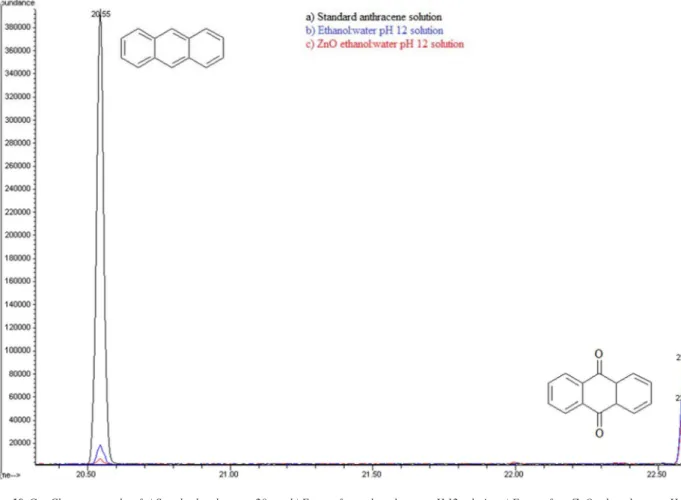
anthracene is detected at longer photocatalysis time (55 minutes) in the presence of semiconductor, suggests a parallel degradation pathway. Extracted solutions with CHCl3 for both cases were analyzed using gas chromatography coupled to mass spectrometry (GC/MS). Figure 10 shows gas chromatograms in CHCl3 for (a) anthracene standard solution (20ppm) and the obtained extracts from (b)
photolysis solution (ethanol:water pH 12) and from (c) photocatalytic solution (ZnO-ethanol:water pH 12). A decrease in ion abundance for signal at retention time value of 20.55 min, associated to anthracene is registered. It can also be observed a new signal at 22.70 min retention time, attributed to 9,10-anthraquinone. Mass spectrum of the aforementioned signals confirm this assertion, see Figure 11.
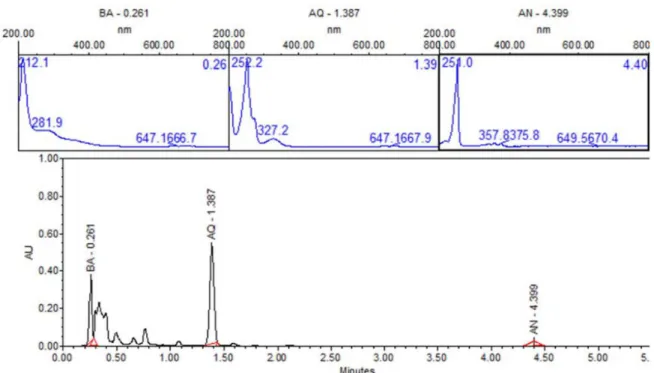
In order to identity products in solutions exposed directly to UV radiation, ultra-performance liquid chromatography (UPLC) with photodiode array detector (PDA) was carried out. Figure 12 shows UPLC chromatogram for the ZnO-ethanol:water pH 12 solutions exposed to UV radiation after 60 minutes. The chromatogram shows signals at retention time values of 0.261, 1.37, and 4.399 min, with their corresponding UV-vis spectra. This figure allows us to state the presence of 9,10-anthraquinone (54%), benzoic acid (35%) and anthracene (1%), due to the same retention times and UV-vis spectrum of standard solutions. This analysis was done for all the other solutions exposed to UV radiation. A summary of percentage (%) of each compound in all solutions are presented in Table 1. In a general trend 9,10-anthraquinone is the main product in ethanol:water pH 12, meanwhile ZnO, promotes the formation of a more oxidized byproduct, benzoic acid.
According to literature, it is possible to propose that for initial times the determinant step is hydroxyl radicals (OH⋅) generated from OH- or H2O. At long times, hydroxyl radicals (OH⋅) from a separation charge process of ZnO, react in low energetic sites of anthracene, producing 9,10-anthraquinone, or a more oxidized compounds such as benzoic acid.34-36 This experimental evidence is in agreement with reactivity sites described by Nu (Dewar) values for the positions of anthracene,37-39 see Figure 13, where the positions 9 and 10 are preferentially attacked.40
Photocatalytic reaction of anthracene in acetone:water in the presence and in the absence of ZnO
Figure 14 shows a typical degradation efficiency (Ct/C0) vs. time graph for (a) pure acetone, (b) acetone:water pH 12 and (c) ZnO-acetone:water pH 12 exposed to a UV radiation (254 nm). In the reaction systems (b) and (c) anthracene absorption signals are not presented after 15 minutes. A change in color solution from colorless to yellow associated to the presence of anthraquinone derivatives, with
Figure 7. a) Photocurrent action spectra (normalized to lamp spectrum) for
ZnO when polarized at 1.0V/RHE. b) Tauc plots for the same electrodes for a direct electronic transition excitation process (a = 2). Wavelength scan rate = 10 nm s-1 with I = 34 mW cm-2 (for polychromatic light)
Figure 8. Predominance diagram, estimated with Hydra and Medusa software
Figure 9. Anthracene degradation efficiency (Ct/C0) vs time graph in a)
absorption signals at 395, 423, 476 nm, are also observed.31,32 In the presence of pure acetone (a) anthracene is still detected near to 50 minutes of photolysis. No changes in color solution were observed. Using chemical kinetic analysis, all systems presented a zero-order reaction. For acetone:water pH 12 and ZnO-acetone:water pH 12 the same reaction rate constant value for anthracene photo-transformation was calculated, which is lower than that obtained for pure acetone, see Table 2.
In order to explore the presence of byproducts, (GC/MS) and (UPLC), with a photodiode array detector (PDA) were also carried out. In the extracts obtained from all conditions, in GC/MS, the only
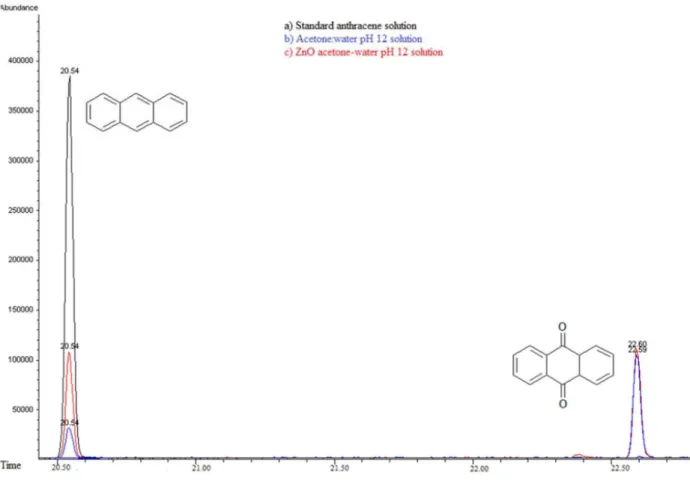
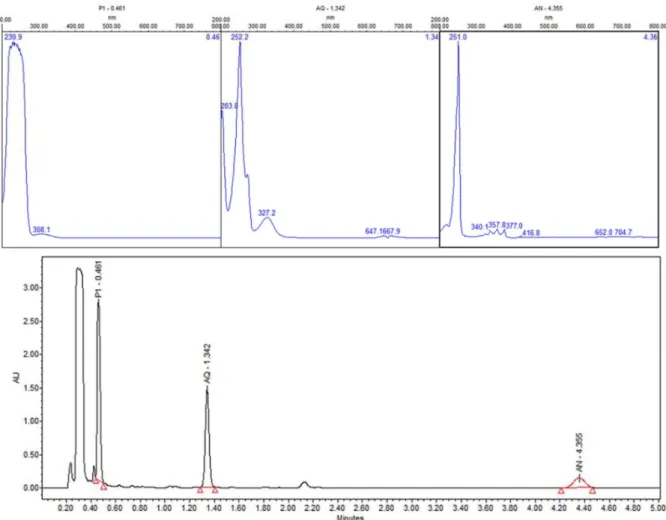
detectable compounds were anthracene and 9,10-anthraquinone, at retention time values at 20.52 and 22.60 minutes respectively, see Figures 15 and 16. Using (UPLC-PDA) the presence of anthracene and 9,10-anthraquinone was confirmed in the reaction media ZnO-acetone:water pH 12, see Figure 17. A summary of percentage (%) of the main compounds in all the photo-transformations are presented in Table 2. It should be highlighted that 9,10-anthraquinone is the main product in acetone:water pH 12 in the presence or in the absence of ZnO. A detail inspection of the chromatograms in Figures 17 (ZnO-acetone:water pH 12, photocatalysis) and Figure 18 (pure acetone, photolysis), show two signals, P1 and P1´ with retention time values of
Figure 10. Gas Chromatography of a) Standard anthracene 20ppm b) Extract from ethanol:water pH 12 solution c) Extract from ZnO-ethanol water pH 12 solution
Table 1. Reaction-rate constants and order of reaction for the three systems studied using ethanol and acetone
Systems Reaction-rate constant (k) Order of reaction Products of Photodegradation-Anthracene (UPLC) t= 60 min
ZnO/light/EtOH:H2O (pH 12)/C14H10 0.01323 min-1 1 1%
54% 35%
Other products 10 %
Light/EtOH:H2O (pH 12)/ C14H10 0.01269 min-1 1
2%
90%
Light/EtOH/ C14H10 No degradation -
-Figure 12. UPLC of sample-photocatalysis of anthracene with ZnO-ethanol:water pH 12. BA-Benzoic acid, AQ-9, 10-anthraquinone and AN-Anthracene
Figure 13. a) Numbering and b) Nu (Dewar) values for substitution in different
position of anthracene compound
Figure 14. Anthracene degradation efficiency (Ct/C0) vs time graph in a)
acetone solution, b) acetone:water pH 12 solution and c) ZnO- acetone:water pH 12 solution, exposed to a 15 W UV lamp at 254 nm, irradiation power (31.4 µW cm-2)
Figure 15. Gas Chromatography of a) Standard anthracene solution 20 ppm-acetone:water pH 12 solution, b) Photocatalysis anthracene and c) Photolysis anthracene
Figure 17. UPLC of sample-photocatalysis of anthracene with ZnO in acetone:water pH 12. P1-other products, AQ-9, 10-Anthraquinone and AN-Anthracene
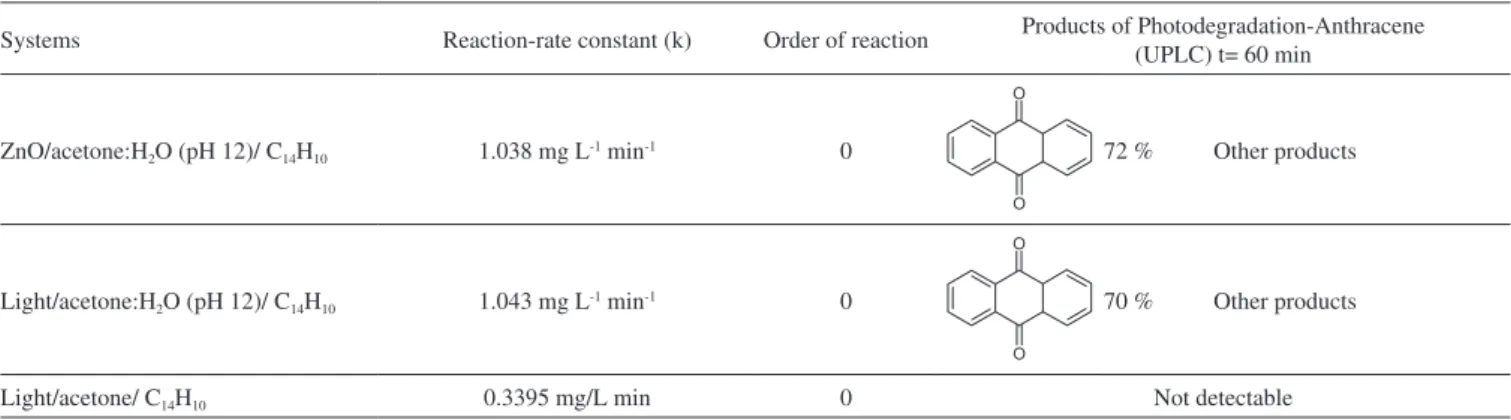
Table 2. Reaction-rate constants and the order of reaction for the three systems studied using ethanol and acetone
Systems Reaction-rate constant (k) Order of reaction Products of Photodegradation-Anthracene (UPLC) t= 60 min
ZnO/acetone:H2O (pH 12)/ C14H10 1.038 mg L-1 min-1 0 72 % Other products
Light/acetone:H2O (pH 12)/ C14H10 1.043 mg L-1 min-1 0 70 % Other products
Light/acetone/ C14H10 0.3395 mg/L min 0 Not detectable
solvents in the photodegradation of anthracene in the presence of a typical semiconductor such as ZnO. The photochemical behavior observed gives evidence to allow us to develop simpler methods for photocatalytic degradation of polycyclic aromatic hydrocarbons obtained from solid-liquid extraction of contaminated matrices, such as soils, with controlled reaction conditions.
CONCLUSION
It was possible to study the photodegradation of anthracene to understand the effect of solvent in the presence and absence of ZnO nanoparticles. Comparing the reaction pathways in acetone and ethanol, marked differences were observed. When ZnO was used in ethanol:water pH 12 as reaction medium, colorless solutions with high oxidized products such as benzoic acid were detected due to photocatalysis and photolysis. In the case of ethanol:water pH 12 with photolysis processes are presented. Moreover, pure ethanol has no important role in the photodegradation of anthracene. On the other hand photocatalytic systems using acetone:water pH 12 solution the main product was the 9, 10-anthraquinone, with no participation of the semiconductor (occurring only photolysis). Finally, when acetone was use as reaction medium the photoche-mical transformation of the anthracene molecule yield probably simple polar byproducts.
ACKNOWLEDGEMENTS
The authors to thank SEP-CONACyT Research Program (Project CB-2009-130500, CB 2011–168032 and Project CONACyT grant 216315) for financial support; B. L. Martínez-Vargas and J. A. Díaz-Real acknowledge CONACyT for the scholarships. Also, authors thank Abigail Moreno, Rufino Nava Mendoza; UAQ (BET analysis), Hector Gabriel Silva Pereyra; LINAN-IPICYT (HR-TEM images). REFERENCES
1. Yiu-Rui, W.; Zhu-Hua, L.; Vrijmuea, L. P.; Bioresour. Technol. 2010, 101, 9666.
2. Callahan, M. A.; Slimak, M. W.; Gabelc, N. W.; May, I. P.; Fowler, C. F.; Freed, J. R.; Jennings, P.; Durfee, R. L.; Whitmore, F. C.; Maestri, B.; Mabey, W. R.; Holt, B. R.; Gould, C.; Water-related Environmental Protection Agency, 1979, EPA-440/4-79-029.
3. Jin-Shao, Y.; Hua, Y.; Jing, Q.; Hui, P.; Hua-Ming, Q.; Na, Z.; Bao-Yon, H.; J. Hazard. Mater. 2011, 185, 174.
4. Kamat, P. V.; Huehn, R.; Nicolaescu, R.; J. Phys. Chem. B 2002, 106, 788.
5. Singh, A. K.; Adv. Powder Technol., 2010, 21, 609.
6. Hassan, S. M.; El Azab, W. I. M.; Ali, H. R.; Adv. Nat. Sci.: Nanosci. Nanotechnol. 2015, 6, 45012.
7. Vela, N.; Martínez-Menchón, M.; Pérez-Lucas, G.; Navarro, S.; J. Photochem. Photobiol., A 2012, 232, 32.
8. Kou, J.; Zhaadheng, L.; Young, G.; Jun, G.; Ming, Y.; Zhigang, Z.; J. Mol. Catal. A: Chem. 2010, 325, 48.
9. Karam F. F.; Falah, H.; Sadiq, J. B.; Ahmed F. H.; Ralf D.; Detelf B.; Int. J. Photoenergy 2014, Article ID 503825, 1.
10. Woo, O. T.; Chung, W. K.; Wong, K. H.; Chow, A. T.; Wong P. K.; J. Hazard. Mater. 2008, 168, 1192.
11. Lehto, K. M.; Vuorimaa, E.; Lemmetyinen, H.; J. Photochem. Photo-biol., A 2000, 136, 53.
12. Peller, J.; Wiest, O.; Prashant, V. K.; J. Phys. Chem. A 2004, 108, 10925.
13. Fujishima, A.; Hashimoto, K.; Watanabe, T.; TiO2 photocatalysis: fun-damentals and applications, BKC Inc.: Tokyo, 1999.
14. Sakata, T.; Kawai, T.; In Energy resources photochemistry and catalysis; Gratzel, M., ed.; Academic Press Inc.: USA, 1983.
15. Stroyuk, A. L.; Shvalagin, V.; Kuchmii, S. Y.; J. Photochem. Photobiol., A 2005, 173, 185.
16. Rietveld, H. M.; J. Appl. Crystallogr. 1969, 2, 65.
17. Rodríguez-Carvajal, J.; Phys. B (Amsterdam, Neth.) 1993, 192, 55. 18. Brus, L. E.; J. Chem. Phys. 1983, 79, 5566.
19. Brus, L. E.; J. Chem. Phys. 1984, 80, 4403. 20. Brus, L.; J. Phys. Chem. 1986, 90, 2555.
21. Nair, S. V.; Sinha, S.; Rustagi, K. C.; Phys. Rev. B 1987, 35, 4098. 22. Einevoll, G. T.; Phys. Rev. B 1992, 45, 3410.
23. Vanheusden, K.; Seager, C. H.; Warren, W. L.; Tallant, D. R.; Voigt, J. A.; Appl. Phys. Lett. 1996, 68, 403.
24. Lin, B.; Fu, Z.; Jia, Y.; Appl. Phys. Lett. 2001, 79, 943.
25. Zhao, Q. X.; Klason, P.; Willander, M.; Zhong, H. M.; Lu, W.; Yang, J. H.; Appl. Phys. Lett. 2005, 87, 211912
26. Subramanian, V.; Wolf, E. E.; Kamat, P. V.; J. Phys. Chem. B 2003,107, 7479.
27. Rouquerol, J.; Avnir, D.; Fairbridge, C. W.; Everett, D. H.; Haynes, J. M.; Pernicone, N.; Ramsay, J. D. F.; Sing, K. S. W.; Unger, K. K.; Pure Appl. Chem. 1994, 66, 1739.
28. Nowak, M.; Kauch, B.; Szperlich, P.; Rev. Sci. Instrum. 2009, 80. 29. Berger, T.; Lana-Villareal, T.; Monllor-Satoca, D.; Gómez, R.; J. Phys.
Chem. C 2007, 111, 9936.
30. Puigdomenech, I.; HYDRA; Hydrochemical Equilibrium-Constant Database Software, Royal Institute of Technology (KTH), Stockholm, Sweden, 2004.
31. Rubio Armendáriz, C.; Álvarez Marante, R.; Hardisson de la Torre, A.; Rev. Toxicol. 2006, 23, 1.
32. Debestani, R.; Ellis, K. J.; Sigma, M. E.; J. Photochem. Photobiol., A
33. Espenson, J. H.; Chemical Kinetics and Reaction Mechanisms, 2nd ed.,
McGraw-Hill: USA, 1995.
34. Gilbert, A.; Baggott, J.; Essentials of molecular photochemistry, Black-well Scientific Publications Inc.: USA, 1991, pp. 355-369.
35. Gekhman, A. E.; Amelichkina, G. E.; Moiseeva, N.; Vargaftik, M.; J. Mol. Catal. A: Chem. 2000, 162, 111.
36. Johnson, R. E.; Quickenden, T. I.; J. Geophys. 1997, 102, 10985.
37. Shen, J.; Zhang, S.; Lian, J.; Kong, L.; Chen, J.; Acta Phys.-Chim. Sin.
2007, 23,1531.
38. Byung-Dae, L.; Masaaki, H.; Akihiko, M.; Water Sci. Technol. 1998, 38, 91.