Article
J. Braz. Chem. Soc., Vol. 24, No. 5, 749-757, 2013. Printed in Brazil - ©2013 Sociedade Brasileira de Química 0103 - 5053 $6.00+0.00
A
*e-mail: [email protected]
Determination of Gold by High-Resolution Continuum Source Atomic Absorption
Spectrometry with Chemical Vapor Generation
Magdalena Krawczyk* and Henryk Matusiewicz
Department of General and Analytical Chemistry, Politechnika Poznańska, 60-965 Poznań, Poland
Avaliou-se o potencial analítico da geração de vapor químico e da espectrometria de absorção atômica com fonte contínua de alta resolução com atomização em tubo de quartzo na determinação de ouro. As espécies voláteis de ouro foram formadas pela reação com tetraidroborato(III) de sódio na presença de ácido clorídrico. Investigou-se a influência de brometo de didodecil dimetilamônio (DDAB) e dietilditiocarbamato de sódio (DDTC) na absorbância. O limite de detecção da concentração para o ouro foi 2,6 ng mL-1. A precisão da medida para 20 ng mL-1 de Au foi 10%
do desvio relativo padrão (RSD). Avaliou-se a exatidão do procedimento através das análises dos materiais certificados de referência NRCC PCT-1a (Copper-Nickel Sulfide Concentrate with Noble Metals), NIST SRM 2710 (Montana Soil) e NIST SRM 1643e (Trace Element in Water). Os conteúdos de Au medidos nestes três materiais de referência foram satisfatórios de acordo com os valores certificados. Esse método também foi aplicado na determinação de ouro em cinza de carvão, sedimento e liga de alumínio.
The analytical potential of chemical vapor generation and high-resolution continuum source atomic absorption spectrometry (CVG HR-CS AAS) with quartz tube atomization in determination of gold was evaluated. The volatile species of gold were formed by reaction with sodium tetrahydroborate(III) in the presence of hydrochloric acid. The influence of didodecyldimethylammonium bromide (DDAB) and sodium diethyldithiocarbamate (DDTC) on the absorbance was investigated. The concentration limit of detection was 2.6 ng mL-1 for Au.
The precision of measurement at 20 ng mL-1 of Au was 10% of the relative standard deviation
(RSD). The accuracy of this method was validated by analyses of NRCC PCT-1a (Copper-Nickel Sulfide Concentrate with Noble Metals), NIST SRM 2710 (Montana Soil) and NIST SRM 1643e (Trace Element in Water) certified reference materials. The measured Au contents in these three reference materials were in satisfactory agreement with the certified values. This method was also applied for gold determination in coal fly ash, sediment and nickel alloy.
Keywords: gold, chemical vapor generation, continuum source, atomic absorption spectrometry
Introduction
Gold is one of the most unreactive elements.For this reason,the use of gold in different areas of life increased. Gold is often used in preventive dentistry, jewellery and in organic synthesis as a catalyst. But, on the other hand, gold is toxic for humans, animals and plants. This element may trigger off acute allergy and its determination in environmental, medical and biological materials has become important.1
Flame atomic absorption spectrometry (F AAS) is still the most frequently used analytical technique. This
technique was used for the determination of gold at trace levels in jewellery samples.2
Chemical vapor generation (CVG) can be used to improve the sensitivity of conventional F AAS as it separates the analyte from the matrix, increases the analyte transport efficiency and aids the investigation of chemical speciation. Because of these advantages, this technique has also been used for the determination of several transition and noble elements.3 Chemical vapor
generation of transition and noble metals was reported for the first time in 1996 by Sturgeon et al.,4 that performed
vapor generation of copper.
Arslan et al.5 determined gold using the on-line
generator consisting of a spectral mixing apparatus and gas-liquid separator design. They generated volatile compounds of gold in the presence of Triton X-100, Antifoam B and diethyldithiocarbamate. Volatile species of gold were also generated using a flow-injection system and determined by atomic absorption spectrometry with an electrically heated quartz tube atomizer QTA.6-8 A mixed reductant containing
0.1% NaBH4 and 0.01% NaBEt4 in the presence of sodium
diethyldithiocarbamate was used by Xu et al.7 for gold
volatile species generation. Du et al.8 generated chemical
vapors of gold by using only NaBH4 in the presence of
sodium diethyldithiocarbamate.
Atomic absorption spectrometry with electrothermal atomization (ET AAS) was also used for the determination of gold by vapor formation.9-12
The use of vapor generation combined with atomic fluorescence spectrometry (AFS) for the determination of trace amounts of gold was reported by Li.13 Zhang et al.14,15
described effects of room temperature ionic liquids on the chemical vapor generation of copper, gold and silver using AFS technique as a detector. They achieved improvement in the sensitivity for gold in the order of 3-24 times.
Many authors explored the application of chemical vapor generation with inductively coupled plasma optical emission spectrometry (CVG-ICP) for the simultaneous determination of transition and noble metals.16-20
Vapor generation coupled with inductively coupled plasma mass spectrometry (ICP-MS) was also applied for the determination of transition and noble elements.21-26
Mass spectrometry studies suggested that volatile analyte species were unstable relative to analyte atoms.23 During the
experiments, a modified parallel path Burgener nebulizer was used as the vapor generator in which the aerosol gas channel was concentric with both the sample and the tetrahydroborate(III) solution channels.22,24,25 Guo et al.26
described volatile species generation following UV irradiation of aqueous solutions to which low molecular weight carboxylic acids (formic, acetic, propionic) had been added.
Matusiewicz et al.27,28 reported the microwave induced
plasma optical emission spectrometry (MIP-OES) for simultaneous multi-element determination of transition and noble metal volatile species.
Villanueva-Alonso and co-workers29 used high-resolution
continuum source atomic absorption spectrometry (HR-CS AAS) as a detector for chemically generated Ag, Cd, Co, Cu Ni and Zn. The vapor generation and atomization conditions in a heated quartz tube were optimized.
To our knowledge, generation of volatile gold species combined with HR-CS AAS as a detector has not yet been reported. Herein, the generation of volatile Au species by
a simple procedure based on the reaction between sodium tetrahydroborate(III) and an acidified aqueous solution of Au is described. The generation efficiency of volatile Au species was also evaluated. Finally, in order to verify the accuracy of the proposed system, analysis of certified reference materials was performed. This technique was satisfactorily applied to a variety of samples, including coal fly ash, sediment and nickel alloy.
Experimental
Spectrometer
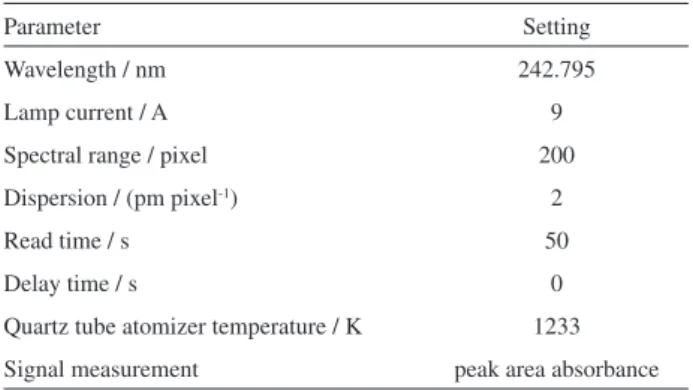
An Analytik Jena ContrAA 700 high-resolution atomic absorption spectrometer equipped with a 300 W xenon short-arc lamp (Analytik Jena, Jena, Germany) as a continuum radiation source was used throughout. This new equipment is comprised of a compact high-resolution double echelle monochromator and a charge coupled device (CCD) array detector with a resolution of about 2 pm per pixel in the far-ultraviolet range. During our research, an air-acetylene flame, a double-slotted quartz tube atomizer heated over the flame and an electrically heated quartz tube were used for atomization of analytes. After the measurement, the data stored in the internal memory of the processing system were transferred to the computer for evaluation. Operating parameters of the CVG HR-CS AAS instrument, after appropriate optimization, are summarized in Table 1.
Chemical vapor generation system
Volatile species of gold were generated in the HS60 vapor generation system for continuous and batch modes with automatic gas path selector from Analytik Jena (Analytik Jena, Jena, Germany). The system includes two peristaltic pump (a three channel and a one channel) controlled by software.
Table 1. Instrumental specification and operating parameters for determination of gold by CVG HR-CS AAS
Parameter Setting
Wavelength / nm 242.795
Lamp current / A 9
Spectral range / pixel 200
Dispersion / (pm pixel-1) 2
Read time / s 50
Delay time / s 0
Quartz tube atomizer temperature / K 1233
Batch mode
NaBH4 was introduced to the cell (80 mL volume)
with a three channel peristaltic pump. Sample volume (5 mL) and reductant flow rate (2 mL min-1) were selected to
provide maximum sensitivity. To reduce aerosol carry-over, a home-made quartz gas-liquid separator identical to that described earlier30 was installed between the reaction
vessel and the quartz tube atomizer.
The outlet of the quartz gas-liquid separator was directed to the electrically heated tube by a piece of Teflon tubing of dimensions 1.5 mm i.d. × 2.0 mm o.d. having a length 50 cm. Loss of analyte during transport to the atomizer was minimized through the use of the minimum possible length of the Teflon transfer line. The evolved chemical vapors were stripped from the solution and swept into the electrically heated tube with an argon purge gas.
Continuous-flow system
CVG was accomplished in a continuous-flow system. This system consists of the automatically controlled peristaltic pumps, an automatic gas path selector and a reaction cell (volume 10 mL). Sample flow rate was selected to provide maximum sensitivity. The average delivery rate for the reductant was 2 mL min-1 and was not
optimized during our experiments. PVC pump tubing was fitted to the outlet of the continuous system. The internal purge gas supply line to the electrically heated tube was routed through the inside part of the chemical vapor cell. The outlet of the glass cell and the electrically heated tube were connected with a Teflon tube of dimensions 1.5 mm i.d. × 2.0 mm o.d. having a length of 50 cm. Loss of analyte during transport to the atomizer was minimized through use of the minimum possible length of Teflon transfer line.
The operating conditions for batch and continuous-flow CVG HR-CS AAS are summarized in Table 2.
Gases and reagents
Compressed air gas of high-purity obtained from Air Products (Warsaw, Poland) was employed as an oxidant gas. Compressed high-purity acetylene from Air Products (Warsaw, Poland) was used as the fuel for the air-acetylene flame. Compressed high-purity argon from Air Products (Warsaw, Poland) was used as a carrier gas.
Standard solutions of Au were prepared from a 1000 mg L-1 Au(I) (Merck, Darmstadt, Germany) atomic
absorption standard. All working standard solutions of Au were prepared daily by diluting appropriate aliquots of the stock solution in high-purity water.
Sodium tetrahydroborate(III) used as reducing solution was prepared daily, or more frequently if required, by dissolving proper amounts of NaBH4 (J. T. Baker, USA) in
high-purity water and stabilizing with 0.1% (m/v) NaOH (Suprapur, Merck, Darmstadt, Germany) solution to decrease their rates of decomposition, and used without filtration.
Sodium diethyldithiocarbamate (DDTC) was prepared by dissolving the powder (Sigma, Steinheim, Germany) in water to yield a 1000 mmol L−1 solution.
Vesicles of didodecyldimethylammonium bromide (DDAB) were prepared by dissolving the surfactant powder (Aldrich, Steinheim, Germany) in water to yield a 1000 mmol L−1 solution.
All mineral acids (HNO3, HCl, HF) and 30% (v/v)
hydrogen peroxide of the highest quality (Suprapur, Merck, Darmstadt, Germany) were used.
High-purity water, deionized water (DEMIWA 5 ROSA, Watek, Czech Republic) and doubly distilled water (quartz
Table 2. Optimized operating conditions for determination of Au by CVG HR-CS AAS obtained by univariate methodsa
Parameter Boundary limit of
parameter, range Batch mode Continuous-flow system
NaBH4 concentrationb / %, m/v 0.5-2.5 2.0 1.5
HCl concentration / (mol L-1) 0.1-1.5 0.5 0.5
DDAB concentration / (mol L-1) 0.00001-0.005 0.001 0.001
Sample flow rate / (mL min-1) 5-10 – 6.7
NaBH4 solution flow rate / (mL min-1) 2 2
Carrier air flow rate / (L h-1) 0-25 6 6
Sample volume / mL 5 2
PVC peristaltic tubes 20 cm × 2.06 mm i.d.
Atomization temperature / K above ca. 1233
apparatus, Bi18, Heraeus, Hanau, Germany), was used throughout the experiments.
Certified reference materials and real samples
Validation of the method described in this work was performed using three certified reference materials. The following materials were chosen: NRCC PCT-1a (Copper-Nickel Sulfide Concentrate with Noble Metals), NIST SRM 2710 (Montana Soil) and NIST SRM 1643e (Trace Element in Water). The certified reference values are available for gold for assessment of the method accuracy. All two solid reference materials were used as bottled, without further grinding and sieving.
The following real samples were used in this study: coal fly ash, sediment and nickel alloy. To ensure homogeneity, it was necessary to grind the real, solid samples. This was achieved for the coal fly ash using an agate pestle and mortar with manual grinding; for the sediment, a vibrational mixer mill model S (Testchem, Pszów, Poland) equipped with a 30 mL grinding chamber and rod (6 cm diameter), all made of tungsten carbide, was used.
Microwave digestion system
A laboratory-built prototype of a high pressure-temperature focused microwave heated digestion system, equipped with a closed TFM-PTFE vessel (30 mL internal volume) based on a design outlined in detail by Matusiewicz,31 was employed
for wet-pressure sample digestion.
Analytical procedure
Microwave-assisted high pressure Teflon bomb digestion
Preparation of all standards and digestions of all samples were conducted under typical laboratory conditions. The microwave-assisted pressurized digestion technique used for biological and environmental samples was previously described.31
Approximately 400-500 mg of powdered inorganic reference materials (Copper-Nickel Sulfide Concentrate with Noble Metals and Montana Soil) and samples (sediment and coal fly ash) were placed in the TFM-PTFE vessel of the microwave digestion system and moistened with 1 mL of 30% H2O2, then 3 mL of concentrated
HNO3 and 2 mL of concentrated HF were added. The
samples were heated for 15 min at 150 W. After dissolution, the clear digested solution was transferred to a 10 mL calibrated flask and diluted to volume with water. Before analysis, the samples were appropriately diluted, depending on the concentration level of the element. In all cases, a
corresponding blank was also prepared according to the above microwave-assisted digestion procedure.
Wet chemical digestion by acid treatment in open vessels
Portions of 4 g of the nickel alloy steel samples were weighed into a 50 mL Erlenmeyer vessel and 45 mL of acid mixture (15 mL HNO3 + 15 mL HF + 15 mL H2O)
were added to each one, digested for 30 min in a water bath at 373 K and shaken energetically. After complete dissolution, the contents of the vessel were cooled, transferred to a 50 mL volumetric flask and made up to final volume with water. A reagent blank was prepared with every batch of samples using the procedure detailed above. All dissolved sample solutions were clear without visible residues.
Chemical vapor generation procedure
The gold vapors were generated in batch mode and were introduced into the electrically heated quartz tube by the carrier gas (argon). Volatile gold species were generated
from 5 mL sample volumes (batch mode). The NaBH4
solution (2.0% m/v) was pumped for 20 s (reductant flow rate, 2 mL min-1) and the vapors were transferred (carrier
gas flow rate, 6 L h-1) to the quartz tube atomizer. The
merging solution feeds the gas-liquid separator. A further 10 s argon purge of the generator completed the transfer process.
The gold vapors were also generated in continuous-flow mode. The gold sample and 1.5% (m/v) solution of NaBH4
were continuously introduced into the quartz vessel at rates of 6.7 and 2 mL min-1, respectively. The merging
solution feeds the gas-liquid separator. The gold vapors were introduced (carrier argon flow rate, 6 L h-1) into the
electrically heated tube for 10 s.
CVG HR-CS AAS analysis
Results and Discussion
The presented study consists of the following steps: chemical vapor generation of gold in batch mode and continuous-flow system, atomization in an electrically heated quartz tube atomizer and application of the developed procedure to practical analysis. The parameters affecting the efficiency of the vapor generation, atomization and analysis technique will be discussed separately.
Continuous-flow system versus batch mode for CVG
The generation efficiency of the volatile Au species depends on the modes and the type of reactors. For this reason, both the batch chemical vapor generation system and the continuous-flow system were used for the present research. The continuous-flow system appeared to offer some advantages, such as ease of automation and use of an almost unlimited sample volume simply by pumping sample solution for a correspondingly long period of time. It ensures an increase of the sensitivity. In addition, continuous-flow vapor generation provides rapid, efficient mixing of the sample and reductant. For this reason the required reaction time is shorter.
Procedural blank
Blanks were determined using the same procedure as for samples (microwave-assisted sample digestion procedure). During these experiments, batch mode and continuous-flow system were used. Even though the chemicals used were of the best quality available, trace amounts of gold in the reagent were determined as the blank signals. Using the batch mode, continuous-flow system and NaBH4 as
reductant, absolute blanks of 1.1 and 1.0 ng for Au were achieved.
Optimization of instrumental and chemical parameters
The optimized CVG conditions are given in Table 2. The most influential variables affecting the method were optimized: the concentration of NaBH4, concentration
of HCl, sample flow rate and the carrier argon flow rate. However, the instrumental conditions for the atomic spectrometer were maintained throughout the study as the standard conditions recommended by Analytik Jena for the model ContrAA 700. The values are summarized in Table 1.
The second group of variables was difficult to modify and they were fixed at values that gave acceptable signals. Consequently, the absorption characteristics of
the major lines for Au (242.795, 267.595 and 212.663 nm) were tested using the CVG HR-CS AAS method. As a consequence, the Au 242.795 nm line giving the largest S/N (signal to noise) was used throughout.
The transfer line between the reaction vessel and the electrically heated quartz tube atomizer was as short as possible and was not optimized but selected based upon previous experience.32 Therefore, for practical reasons, a
transport tube length of 50 cm was used, which ensured stable and reproducible experiments.
Preliminary experiments were performed by F AAS using aqueous solutions of gold. The stability of the flame was controlled by the gas flow rate. It was, therefore, essential to keep the flame stable in the section of the atomizer. The effects of flame conditions on the atomization of gold were studied by varying the fuel flow rate. The influence of the flame stoichiometry on the signal intensity was investigated by fixing the air flow rate (470 L h-1) and
altering the acetylene flow rate. The best sensitivity was obtained by using 45 L h-1 (lean flame) for acetylene. The
burner height was 6 mm. During our experiments, two types of burner (with 50 mm and 100 mm slot) were used. Nebulizer uptake rate was 4 mL min-1.
The double-slotted quartz tube trap (STAT) position was also optimized in our experiments. STAT was installed in the optimized position in such a manner as to permit the system to be vertically and laterally adjusted in the flame. The optimum position of the trap tube corresponded to a distance of 2 mm above the burner. Burner height was 9 mm. The burner slot length was 50 mm.
The limits of detection obtained using batch mode and continuous-flow system were similar but the continuous-flow system offers the advantages described before. For this reason, only the optimization of the continuous-flow CVG is presented in detail.
Continuous-flow CVG was optimized by varying acid and reductant concentrations and the argon carrier flow that influences volatilization and transport. However, substantial optimization of the generation parameters was not undertaken. This information was available from references cited in this work and from our own observations. All of the factors show more or less significant effect.
First, the optimum sample flow rate was estimated in the range of 5-10 mL min-1 (Figure 1a). It was noted that
when the flow rate was low (5 mL min-1), the absorbance
increased with the flow rate. When the flow rate went up to 6.7 mL min-1, the absorbance reached maximum. However,
with further increase of flow rate (above 8.4 mL min-1), the
The generation efficiency in hydrochloric and nitric acids was investigated. It was confirmed that HCl is the most appropriate acid to use. When using HNO3, the Au signals
were found to be about 60% lower than those obtained with HCl (Figure 1b). HCl was found to produce a plateau
of absorbance in the concentration range 2.0-4.0 mol L-1.
Next, the influence of HCl on the absorbance in the presence of DDAB (Figure 1c) and DDTC (Figure 1d) was examined. The absorbance reached a maximum when the concentration of HCl was 0.5 mol L-1 in the presence of
0.001 mol L-1 DDAB (Figure 1c). When using DDTC, the
Au signals were found to be almost three times worse than those obtained with DDAB (Figure 2). The concentration of NaBH4 is recognized as one of the most critical variables
in CVG. Concentrations in the range of 0.5-2.5% of NaBH4
were tested using 0.5 mol L-1 HCl (Figure 1e). NaBH 4
concentrations higher than 3.0% (m/v) would result in a violent reaction (more hydrogen gas was generated) in the gas-liquid separator (generator) and eventually lead to an unstable signal. High NaBH4 concentrations had to
be avoided and an optimum value of 1.5% was chosen for further experiments. The concentration of NaOH used for the stabilization of NaBH4 was also found to have a
significant effect on the analytical signal. The highest CVG efficiency was obtained when the concentration of NaOH was 0.1% (m/v). Therefore, that stabilizer was added in an effort to maintain, in addition, the reagent blank as low as possible.
The argon carrier gas flow through the apparatus is one of the basic parameters influencing the transport of the Au vapors into the electrically heated quartz tube atomizer, but also the mixing effect of chemical vapor-forming reaction solutions, and thus it can markedly affect the determination of Au. The analyte was stripped from the CV generator and inserted to the atomizer at argon flow rates in the range of 0-25 L h-1 (Figure 1f). It was evident
that the use of low carrier gas (argon) flow can successfully reduce high analyte losses caused by sorption on the inner surfaces of the apparatus (transport tubing), so such use leads to a slight improvement in the analytical signals. This may be connected with the more efficient separation of the volatile species from the reaction solution. On the other hand, higher carrier gas flow rates (> 6 L h-1) can
result in a slight decrease of analytical signals (higher flow rates reduce peak areas). An argon flow of 6 L h-1 was used
throughout the experiments.
The influence of the surfactants DDAB and DDTC on the characteristics of room temperature CVG of gold, i.e., enhanced sample introduction efficiency and stability of reaction rates (kinetic effect), was investigated.5,7-9 The
influence of the concentration of DDAB and DDTC in the presence of 0.5 mol L-1 HCl was studied in the range of
0.0001-0.005 mol L-1 (Figure 1g, 1h). It was observed that
when the concentration was low (0.0001-0.001 mol L-1
for DDAB and 0.0001-0.0005 mol L-1 for DDTC), the
absorbance increased. The highest analytical signals were obtained at 0.001 mol L-1 DDAB concentration and at
0.0005 mol L-1 DDTC concentration.
Generation efficiency
The generation efficiency of volatile gold species was estimated by the quantification of the residual concentration of Au, at room temperature, in the post-reaction solution of the CV generator and relating those values to the concentration of Au in the solution used to generate the vapor.33 The estimated CVG efficiency was determined by
graphite furnace atomic absorption spectrometry (GF AAS). During our research, the same detector was used. For this reason, the experimental parameters for the detector were as close as possible. Solutions containing 50 and 20 ng mL-1 Au were used to calculate the generation efficiency,
suggesting 6.2 and 4.7%, respectively. These results are definitely worse than those reported by Li.13 They separately
determined residual Au analyte in an aqua regia rinse of a flow-injection CVG generator, Au left on the membrane filter after filtering, the waste liquid and Au remaining in the waste effluent. They obtained the following results: 9.7 ± 1.1, 15.9 ± 2.7 and 74.3 ± 7.2%, respectively for those fractions (totaling over 99%). After modification of the reaction with DDTC, 3.4 ± 0.4, 58.2 ± 4.2 and 27.4 ± 1.2% (89% in total) was determined. Xu and Sturgeon7 estimated
of the CVG efficiency for detection by GF AAS with an
in situ collection in the atomizer. They reported 0.1 and 0.8% efficiency for DDTC-modified CVG of Au with NaBH4 and NaBH4/NaBEt4 mixed reductant, respectively.
These results are definitely worse than those reported by us.
Analytical figures of merit
A comparison of the limits of detection of the present procedure for conventional F AAS with a double-slotted quartz tube installed on a standard 50 mm air-acetylene
burner, CVG HR-CSAAS with atomization in a quartz
tube, CVG AAS with atomization in a quartz tube and flow-injection CVG AAS is summarized in Table 3. The limit of detection achieved for CVG HR-CS AAS with Figure 2. Influence of DDAB and DDTC on the signals of Au
atomization in a heated quartz tube is almost six times better than that obtained with direct conventional flame AAS and two times better than that achieved for a double-slotted quartz tube. The limits of detection, calculated
using the IUPAC recommendation (based on a 3σ
blank
criterion), were obtained by the use of optimized operating conditions. The results are compared with CVG AAS with atomization in a quartz tube and flow-injection CVG AAS. From Table 3, it can be seen that the limit of detection of the developed CVG HR-CS AAS procedure is the same as or better than the other methods. The achieved limit of detection is 2.6 ng mL-1 for Au (sensitivity enhancement
compared to F AAS is almost 6-fold). This limit of detection is eight times better than the limit of detection achieved by Luna et al.6 (21 ng mL-1), nine times better than the
limit of detection achieved for flow-injection CVG AAS by Du et al.8 (24 ng mL-1), six times better than the limit
of detection achieved by Arslan et al.5 (17 ng mL-1), and
comparable with the result reported by Xu et al.7
(2.8 ng mL-1). Seven replicate measurements of the total
procedural (reagent) blank solution were carried out and the relative standard deviation (RSD) of the background values for the raw unsmoothed data were calculated. Precision was in the range of 10% (evaluated as peak area); this reflects the cumulative imprecision of all of the sample handling, vapor generation, atomization and detection steps. The peak height precision was always slightly, but significantly, worse.
Validation of the method by analysis of certified reference materials
To ensure the accuracy and precision of the methodology three standard reference materials (SRMs) were analyzed:
NRCC PCT-1a (Copper-Nickel Sulfide Concentrate with Noble Metals), NIST SRM 2710 (Montana Soil) and NIST SRM 1643e (Trace Element in Water). Conventional calibration was compared with the standard addition slopes to evaluate the matrix effects on the analytical signals. No significant differences were found between the slopes obtained by both calibration procedures when using CVG HR-CS AAS. Therefore, conventional external aqueous calibration curves were used and the obtained results are summarized in Table 4. The short-term precision is expressed as RSD of seven replicate measurements of each sample. The results obtained by the external calibration technique do agree with the certified values for all reference materials, indicating no significant interferences.
Determination of gold in selected real samples
Several real samples (coal fly ash, sediment and nickel alloy) were analyzed to evaluate the usefulness of the proposed method in determining gold contents, using the previously optimized experimental conditions. Results are summarized in Table 5. In all cases, calibration was achieved using external aqueous standard calibration curves. The precision of replicate determination is typically better than 10% RSD.
Table 3. Comparison of limits of detection (LOD)a for gold using various atomizers (ng mL-1)
Vapor generation system F AAS STAT CVG HR-CS AAS CVG AAS FI-CVG AAS
LOD Xb LOD Xb LOD Xb LOD Xb LOD Xb
Continuous 14.5 1.0 4.8 3.0 2.6 5.6 – − 2.8d
24e 17f
5.2 0.6 0.8
Batch 14.5 1.0 4.8 3.0 2.2 6.6 21.0c 0.7 − −
aLimit of detection defined by the 3 blank criterion (n = 7); benhancement (improvement) factor; creference;6dreference;7ereference;8freference.5
Table 4. Determination of gold (concentration ± standard deviation) in certified reference materials using CVG HR-CS AAS technique (continuous-flow system)
Sample Found / (µg g-1) Certified value / (µg g-1)
NRCC PCT-1a (Copper-Nickel Sulfide Concentrate with Noble Metals) 1.19 ± 0.12a 1.31 ± 0.11
NIST SRM 2710 (Montana Soil) 0.43 ± 0.5a 0.50b
NIST SRM 1643e (Trace Element in Water) 0.13 ± 0.03a,c 0.10b,c
aStandard deviation for 7 parallel determinations; badded amount; cconcentration in ng mL-1.
Table 5. Gold concentration in real samples (continuous-flow system)
Sample Au / (µg g-1)
Coal fly ash < LODa,b
Sediment < LODa,b
Nickel alloy 0.31 ± 0.09a
Conclusions
The development of HR-CS AAS equipment introduced a new quality to the analysis. This spectrometer allows obtaining low limits of detection and satisfactory sensitivity. This is due to the combined use of the high radiation xenon short arc lamp, a high-resolution double echelle monochromator and a charge coupled device array as a detector. The spectral environment of the analytical line is available and gives many information about possible interferences. Formation of volatile species of gold in the presence of didodecyldimethylammonium bromide permits an increase in the analytical signals. The achieved low concentration limit of detection for Au (2.6 ng mL-1)
is eight times better than that obtained for AAS with a quartz tube atomizer (21 ng mL-1),6 six times better than
that obtained for AAS with a quartz tube multiatomizer (17 ng mL-1)5 and comparable with the results reported by
Xu et al.7 (2.8 ng mL-1).
Acknowledgments
This study was financially supported by the Poznan University of Technology (Grants No. 31-244/2012 DS-MK and 31-238/2012 DS-PB).
References
1. Żelazowska, R.; Pasternak, K.; Bromat. Chem. Toksykol.2007,
2, 205.
2. Mauri, A. R.; Huerta, E.; de la Guardia, M.; Fresenius J. Anal. Chem. 1990, 338, 699.
3. Pohl, P.; Prusisz, B.; Anal. Bioanal. Chem.2007, 388, 753. 4. Sturgeon, R. E.; Liu, J.; Boyko, V. J.; Luong, V. T.; Anal. Chem.
1996, 68, 1883.
5. Arslan, Y.; Matoušek, T.; Kratzer, J.; Musil, S.; Benada, O.; Vobecký, M.; Ataman, O. Y.; Dědina, J.; J. Anal. At. Spectrom. 2011, 26, 828.
6. Luna, A. S.; Sturgeon, R. E.; de Campos, R. C.; Anal. Chem. 2000, 72, 3523.
7. Xu, S.; Sturgeon, R. E.; Spectrochim. Acta, Part B2005, 60, 101.
8. Du, X.; Xu, S.; Fresenius J. Anal. Chem. 2001, 370, 1065. 9. Ma, H.; Fan, X.; Zhou, H.; Xu, S.; Spectrochim. Acta, Part B
2003, 58, 33.
10. Medved, J.; Burdoš, M.; Matúš, P.; Kubová, J.; Anal. Bioanal. Chem. 2004, 379, 60.
11. Ertaş, G.; Ataman, O. Y.; Appl. Spectrosc. 2004, 58, 1243. 12. Ertaş, G.; Ataman, O. Y.; Appl. Spectrosc. 2006, 60, 423. 13. Li, Z.; J. Anal. At. Spectrom. 2006, 21, 435.
14. Zhang, Ch.; Li, Y.; Cui, X.Y.; Jiang, Y.; Yan, X.-P.; J. Anal. At. Spectrom. 2008, 23, 1372.
15. Zhang, Ch.; Li, Y.; Wu, P.; Jiang, Y.; Liu, Q.; Yan, X.-P.; Anal. Chim. Acta2009, 650, 59.
16. Pohl, P.; Żyrnicki, W.; J. Anal. At. Spectrom. 2001, 16, 1442. 17. Pohl, P.; Żyrnicki, W.; J. Anal. At. Spectrom. 2003, 18, 798. 18. Sekhar, K. C.; Gupta, K. K.; Bhattacharya, S.; Chakravarthy, S.;
At. Spectrosc. 2004, 25, 165.
19. Peña-Vázquez, E.; Villanueva-Alonso, J.; Bermejo-Barrera, P.;
J. Anal. At. Spectrom. 2007, 22, 642.
20. Peña -Vázquez, E.; Villanueva-Alonso, J.; Bermejo-Barrera, P.;
At. Spectrosc. 2008, 29, 180.
21. Chen, B.; Zhuang, Z.; Wang, X.; Lee, F. S. C.; Anal. Sci. 2001,
17, 275.
22. Feng, Y.-L.; Lam, J. W.; Sturgeon, R. E.; Analyst2001, 126, 1833.
23. Duan, X.; McLaughlin, R. L.; Brindle, I. D.; Conn, A.; J. Anal. At. Spectrom. 2002, 17, 227.
24. Feng, Y.-L.; Sturgeon, R. E.; Lam, J. W.; J. Anal. At. Spectrom. 2003, 18, 1435.
25. Feng, Y.-L.; Sturgeon, R. E.; Lam, J. W.; D’Ulivo, A.; J. Anal. At. Spectrom. 2005, 20, 255.
26. Guo, X.; Sturgeon, R. E.; Mester, Z.; Gardner, G. J.; Anal. Chem. 2004, 76, 2401.
27. Matusiewicz, H.; Ślachciński, M.; J. Anal. At. Spectrom. 2010,
25, 1324.
28. Matusiewicz, H.; Ślachciński, M.; Spectrosc. Lett. 2010, 43, 172.
29. Peña-Vázquez, E.; Villanueva-Alonso, J.; Bermejo-Barrera, P.;
Spectrochim. Acta, Part B. 2009, 64, 659.
30. Veber, M.; Čujes, K.; Gomišček, S.; J. Anal. At. Spectrom. 1994,
9, 285.
31. Matusiewicz, H.; Anal. Chem. 1994, 66, 751.
32. Matusiewicz, H.; Krawczyk, M.; Anal. Sci. 2006, 22, 249. 33. Marrero, J.; Smichowski, P.; Anal. Bioanal. Chem.2002, 374,
196.