Article
J. Braz. Chem. Soc., Vol. 24, No. 5, 721-730, 2013. Printed in Brazil - ©2013 Sociedade Brasileira de Química 0103 - 5053 $6.00+0.00
A
*e-mail: [email protected]
Adsorption and Release of Micronutrients by Humin Extracted from Peat Samples
Danielle Goveia,a Camila de A. Melo,a,b Lilian K. de Oliveira,a,b Leonardo F. Fraceto,b
Julio Cesar Rocha,a Newton Luiz Dias Filhoc and André Henrique Rosa*,b
aInstituto de Química de Araraquara, Universidade Estadual Paulista (UNESP),
14800-900 Araraquara-SP, Brazil
bDepartamento de Engenharia Ambiental, Universidade Estadual Paulista (UNESP),
18087-180 Sorocaba-SP, Brazil
cDepartamento de Física e Química, Universidade Estadual Paulista (UNESP),
15385-000 Ilha Solteira-SP, Brazil
O objetivo deste trabalho foi estudar a adsorção de micronutrientes em humina e verificar a capacidade de liberação desses elementos em água. O primeiro passo foi determinar a capacidade de adsorção da humina para alguns micronutrientes essenciais para as plantas e determinar alguns parâmetros cinéticos. A ordem de adsorção foi Zn < Ni < Co < Mn < Mo < Cu < Fe, sendo que Zn apresentou valores máximos de ca. 2,5 mg g–1 e Fe valores de ca. 0,5 mg g–1, para os sistemas contendo 1 g de humina. O ferro apresentou maiores percentuais de liberação (ca. 100%) e Co apresentou percentuais mais baixos (0,14%). Infere-se a partir dos resultados que o uso de humina enriquecida com micronutrientes pode ser uma alternativa promissora para a fertilização de solos agrícolas, com o benefício adicional de incorporar a matéria orgânica presente na forma de substâncias húmicas no solo e melhorar a produtividade agrícola.
The objective of this work was to investigate the adsorption of micronutrients in humin and to verify the ability to release these elements in water. The first step was to determine the adsorption capacity of humin for several essential plant micronutrients and check the kinetic parameters. The order of adsorption was Zn < Ni < Co < Mn < Mo < Cu < Fe, whereas Zn showed maximum values of ca. 2.5 mg g–1 and Fe values of ca. 0.5 mg g–1 for systems containing 1 g of humin. Iron presented higher percentages of release (ca. 100%) and Co the lowest percentages (0.14%). The findings suggested that the use of humin enriched with micronutrients can be a promising alternative for the fertilization of agricultural soils, with the additional benefit of incorporating organic matter present in the form of humic substances into the soil and improving the agricultural productivity.
Keywords: adsorption, desorption, humin, micronutrients
Introduction
With inevitable population growth, the issues of food scarcity are of increasing concern, so there is a need to identify feasible alternative ways in which soil fertility can be increased, while avoiding waste of resources and contamination of aquatic systems.
The growth and productivity of plants are dependent on the availability of water and nutrients. The development of systems whereby the use of these by plants can be maximized is therefore fundamental. Micronutrients are required for plant growth.1 Copper participates in
various enzymatic processes, and is also important for photosynthesis and the formation of lignin in plant cell walls. Iron, molybdenum and zinc are enzymatic co-factors in plants, and are required in photosynthesis. Zinc also plays an important role in the transcription of DNA, while manganese is involved in the formation of chloroplasts. Nickel and cobalt activate enzymes involved in a variety of metabolic processes. Cobalt is also essential in nitrogen metabolism, and can substitute zinc and iron as cofactors for some enzymes.
components of peat are lignin, cellulose and humic substances.2
Humic substances play a vital role in the soil fertility and plant nutrition, and their use in soils can provide a source of both organic materials and nutrients.3-6 Plants cultivated in soils containing adequate quantities of humin, humic acids and fulvic acids are less liable to stress, are healthier and are more productive, while the nutritional qualities of the foods derived from them are superior.7 The fulvic and humic acids are fractions of humic substances well understood by environmental soil science, including the capacity in adsorb metals, including micronutrients. However, the physicochemical properties of humins are only partially understood, and there are relatively few reports concerning the humin fraction, in contrast to the other fractions of humic substances.
The humic substances can be divided into three main fractions based on their solubility: humic acids (soluble in alkaline media and precipitating at pH < 2), fulvic acids (soluble in acidic and alkaline media) and humin (insoluble at any pH).2 Structurally, the three humic fractions are similar, but differ in molecular weight and content of functional groups. In this context, it was found that fulvic acids have the lowest molecular weight, less carbon and nitrogen and have the highest content
of functional groups containing oxygen (CO2H, OH,
C=O) per unit weight than the other two fractions. The chemical structure and properties of the humin fraction are similar to those of humic acids being composed of stable macromolecules, inorganic colloids intimately linked to the soil.2
Many studies concerning the use of humic substances to improve plant growth have been reported in the literature but very little has been done using the humin fraction.4,5 The humin fraction consists of a complex mixture of molecules whose molecular weights vary from several hundred to more than 300,000 g mol-1. In the soil, it is the fraction that is most humified and most resistant to decomposition.8 This has several functional groups as a number of fatty acid methyl esters, methoxy alkanes and polar aromatic groups, which form multiple binding sites.9 It is extremely porous, with a high surface area, and as a result can efficiently adsorb metal ions present in solution. The physicochemical properties of humin can bring several benefits to soils, including increased water retention capacity, better soil structure and stability and improved fertility in general due to its ability to act as a cation exchange system. Humin is therefore a key component of fertile soils.2
Given the interesting structural characteristics and physicochemical properties of humin and the gap on the adsorption/desorption capacity by humin, the objectives
of the present work were to employ the humin samples extracted from peat in adsorption studies evaluating the kinetic parameters, and thereafter investigate the release in water in order to develop a system which could improve plant growth.
Experimental
Chemicals and reagents
All reagents used were of high-purity grade (unless otherwise stated). Dilute acid and alkaline solutions were prepared by diluting 30% m m-1 hydrochloric acid or sodium hydroxide-monohydrate (Suprapure, Merck AG, Germany) in high purity water (resistivity 18.2 MΩ cm at 25 ºC, Milli-Q system, Millipore, Bedford, MA, USA). The working solutions of the metals (Co, Cu, Fe, Mn, Mo, Zn and Ni) were prepared daily by dilution from 1,000 mg L−1 stock solutions.
Sampling and extraction of the humin fraction
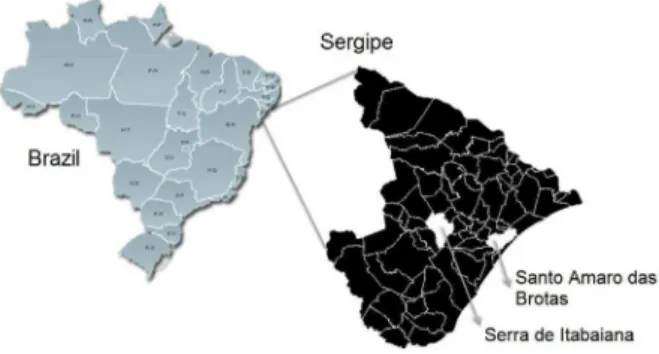
Peat samples were collected in February 2011 from two different peatlands at Santo Amaro das Brotas (36º58’52”W; 10º49’3”S) and Serra de Itabaiana cities (37º20’25”W; 10º45’29”S) in Sergipe State, Brazil, (Figure 1). Integrated samples (n = 5) were collected at a depth of 0-20 cm from the surface. The samples were stored in polyethylene bags prior to being air-dried, ground, homogenized in a porcelain mortar and sieved through a 2 mm mesh sieve.
The humin fraction was obtained after extraction of the humic and fulvic acids, following the procedure described by the International Humic Substances Society, based on alkaline extraction using a soil/extractant ratio of around 1:10 (m/v), under a nitrogen atmosphere.10 300 g of peat and 3 L of NaOH (1.0 mol L-1) were used.
Samples were dried at 55 oC in a recirculating air drying cabinet. The humin fractions obtained from the peats collected at Santo Amaro das Brotas and Serra de Itabaiana cities are here denoted H-TSA and H-TSI, respectively.
Characterization of the humin samples
The organic matter content of the humin samples was gravimetrically measured by the calcination of approximately 5.0 g of the materials for 4 h at 750 oC,
in duplicate.11 The concentrations of Cu, Co, Fe,
Mg, Ni, Zn and Mo were determined by inductively coupled plasma optical emission spectrometry using an Agilent 700 ICP OES instrument. The humin samples were prepared for these analyses by calcination in a muffle furnace for 4 h at 750 oC, followed by decomposition using concentrated HNO3 for 2 h at 150 oC on a hotplate. Samples were characterized by 13C nuclear magnetic resonance (NMR) with cross-polarization and magic angle spinning (Bruker Avance III 400 MHz spectrometer, Fremont, CA, USA), with 5 kHz rotation, a contact time of 2 ms, a relaxation time of 5 s and a scan number of 11000. The C, H and N contents of the samples were measured using a Thermo Finnigan Flash EA 1112 elemental analyzer (Rodano, MI, Italy), and the O contents were determined by difference.
Evaluation of parameters influencing adsorption and the interaction of the micronutrients with the humin fraction
Studies of the adsorption of the micronutrients by humin were performed in batch mode, varying the mass of humin and pH. A volume of 250 mL of a multi-element standard solution containing Cu, Mn, Ni, Fe, Mo, Co and Zn (10 mg L–1) was used, either maintaining pH at 4.5 and varying the mass of humin (0.50, 1.00, 2.00 and 4.00 g), or maintaining the mass of humin at 1.00 g and adjusting pH to either 3.0 or 6.0.
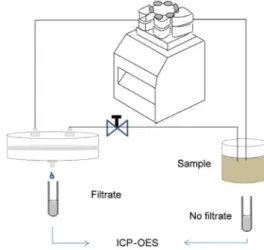
Information on the amounts of the micronutrients that remained uncomplexed with humin was obtained using an ultrafiltration system containing a 1 kDa membrane (Figure 2). The system was operated for around 5 min in order to conditioning the membrane, then the first aliquot (ca. 2 mL), corresponding to time zero, was filtered before addition of humin. This aliquot contained a small quantity of micronutrients corresponding to the free (uncomplexed) fraction, plus the HS-bound fraction that had a molecular size smaller than 1 kDa. The concentrations of the micronutrients that interacted with humin were obtained, as a function of time, from the difference between the initial concentration and the concentration in each aliquot. The
aliquots (ca. 2 mL) were acidified, and the elements were determined as described in the sequence.
The amount of dye adsorbed to humin was calculated from the difference between the initial and final concentrations of the solutions using equation 1:
(1)
In this expression, qeq is the quantity of micronutrient adsorbed at equilibrium in mg of micronutrients per g of dry humin, C0 is the initial concentration of the micronutrient in mg L-1, C is the final concentration of the micronutrient in mg L-1, V is the volume in L of the suspension, and m is the mass of humin used in g.12
The pseudo-first order (equation 2) and pseudo-second order (equation 3) kinetic models were applied, in which the linearization of the plots of 1/qtvs. 1/t and t/qtvs. t provided the values of the first order (k1) and second order (k2) rate constants, respectively, together with the values of qeq (the quantity of micronutrient adsorbed at equilibrium). The pseudo-first order kinetic model describes an adsorption rate that is proportional to the number of available active sites.13 The pseudo-second order model considers chemical interaction between the adsorbent and the solute, involving the sharing of electrons between the atoms of the adsorbed species and the surface of the solid material.14
(2)
In the equations, k1 (min–1) is the pseudo-first order rate constant, k2 (g mg
–1 min–1) is the pseudo-second order rate
constant, t (min) is the time of adsorption, and qeq and qt (mg g–1) are the quantities of micronutrients adsorbed at equilibrium and at time t, respectively.
Evaluation of parameters influencing the release of the micronutrients from the humin fraction
Measurement of the release of the micronutrients was first performed using in natura humin in order to identify any release of elements already bound in the material. A volume of 250 mL of deionized water was used, and the pH value was adjusted to 4.5. An amount of 2.00 g of humin was weighed out, added to the solution, and left for 72 h.
The release from humin saturated with the micronutrients was measured as a function of time in batch mode using the same humin samples described previously. After the adsorption experiments, the supernatant solutions were siphoned off, the samples were dried at 50 oC in a recirculating air drying cabinet, and the humin sample was reweighed. The material was then resuspended in 250 mL of deionized water, and the release was monitored for 7 days. pH was measured at the end of the experiment, in all cases the pH value was about 7.0 due to the buffering property of humin. An aliquot was removed for determination of the total solution concentrations of the micronutrients, including the free fraction and the labile fraction (complexed with soluble organic matter). Determination of the micronutrients that were free in solution was performed by filtration of an aliquot through a 1 kDa membrane (Figure 2). The aliquots (ca. 2 mL) were acidified, and the elements were determined as described in the sequence.
Determination of micronutrients by ICP OES
The concentrations of Co, Cu, Fe, Mn, Mo, Zn and Ni were determined by ICP OES using an Agilent 700 instrument equipped with a seaspray nebulizer. Each standard and sample solution was measured in triplicate. Calibration employed synthetic standard solutions prepared from the stock solution (ICP multi-element standard solution IV, Merck AG, Darmstadt, Hessen, Germany) using the same acid concentration employed for the experimental samples.
Results and Discussion
Characterization of the humin fraction
The percentage of humin extracted from peat was 27% for H-TSA and 31% H-TSI. The characteristics of the
humin samples are provided in Table 1. The organic matter content of H-TSA exceeded 80%, indicating a high degree of chemical and biological activities. The organic matter content of the H-TSI sample was below 50%, characteristic of more recent decomposition.2,10 The micronutrient contents of the humin samples were low probably due to the absence of anthropogenic influence in the region. This characteristic suggests that the samples might be suitable for agriculture.
The values of ash by elemental analysis (Table 1) were 17.61% for H-TSA and 51.65% H-TSI. These values are close to the ones given by calcined ashes (Table 1), but the amount of organic matter could be overestimated due to the hydroxide volatilization. A significant presence of mineral matter in H-TSA and H-TSI, based on the characteristics of alkaline extraction as well as the organic matter and CHNO contents (Tables 1 and 2). These mineral phases (silicates, oxides and clay minerals) are hydrated structures and probably imply in a gradual loss of water, even after 110 oC.
One of the most important characteristics of the humic material is the degree of humification, which is associated with the stability and complexity of the molecules. The process of decomposition of the organic matter occurs by the action of specific enzymes. According to Rosa et al.,10 the difficulty of decomposition increases in the order: sugars < hemicellulose < cellulose < lignin < fats < phenols. The decomposition of the organic matter present in the environment tends to lead to the formation of phenolic Table 1. Physicochemical characteristics and semi-quantitative analysis of carbon in the humin samples by comparison of the area of the spectral region of interest with the total area of the spectrum
Micronutrient / (µg g–1) H-TSA H-TSI
Cu 6.3 9.2
Co < 8.0 < 8.0
Fe 622.9 301.2
Mn 51.2 3.6
Ni 7.6 5.8
Zn 0.6 2.1
Mo < 2.0 < 2.0
Chemical shift / ppm, attributions / % H-TSA H-TSI
0-65, aliphatic 38.0 57.0
65-110, ether, hydroxyl 39.0 20.0
110-140, aromatic 19.0 19.0
140-160, phenol 0.7 0.5
160-190, carboxylic, ester 0.8 0.5
190-220, carbonyl 0.1 0.1
Organic matter / % 82.39 ± 0.64 48.35 ± 2.06
structures derived from lignins since these are more difficult to degrade than sugars and proteins.
The relative amounts of the different types of carbons present in the organic matter samples can be estimated from 13C NMR spectra by integrating the peaks in specific spectral
regions.15 The relative percentages obtained for the different carbon groups present in the H-TSA and H-TSI samples are given in Table 1. The regions 0-65 ppm (corresponding to shifts associated with aliphatic carbons) and 65-110 ppm (corresponding to shifts associated with ether and hydroxyl groups) showed the greatest differences between the two samples. The H-TSI sample showed more pronounced shifts associated with aliphatic carbons, while H-TSA showed greater shifts for ethers and hydroxyls. In the remaining regions, 110-140 ppm (aromatic carbons), 140-160 ppm (phenolic compounds), 160-190 ppm (carboxylic carbons and esters) and 190-220 ppm (carbonyl carbons), the shifts showed no significant differences between the samples. The percentages attributed to the different carbon groups (Table 1) indicated that there was a small difference between the samples in terms of the structure of the organic matter. This could be due to differences in the decomposition process since the transformations are influenced by the type of original substrate, the characteristics of the microorganisms present and other environmental factors such as the intensity of solar radiation, temperature, oxygen availability and pH.
The C/H, C/N and C/O atomic ratios can be used as indicators of aromaticity and degree of decomposition. The elemental compositions and the atomic ratios of the H-TSA and H-TSI samples are given in Table 2, together with the values obtained for samples of peat in natura for comparison. The C/H ratio is related to the degree of aromaticity, in which the smaller the ratio, the smaller the aromaticity. In other words, an increase in the hydrogen content is an indicative of a greater number of aliphatic carbons (−CH
2−) than unsaturated carbons (−CH=CH−). The values of the C/H ratio obtained here were lower than the peat in natura, therefore lower aromaticity. The color
of the material becomes darker with the humification increase (low C/H ratios). It also showed higher aromaticity compared with another sample of humin reported in the literature.16 The C/O atomic ratio reflects the carbohydrate content of humin, with high values indicating less humification due to lower carbohydrate levels. The results showed that the samples contained an elevated quantity of oxygenated groups. The results confirmed that the degree of humification of the humin fraction was much greater than that of other fractions (humic and fulvic acids), as observed by comparing the results to sample in natura. The C/N ratio can be used to provide information on the origin of the organic matter in natural environments, with values smaller than 20 suggesting that the humification process was favored by microbial activity, and values greater than 20 indicating a predominance of plant material in the process.17 The samples showed high levels for H-TSA (79) and to H-TSI (1300).
Adsorption and interaction of the micronutrients and humin
Since humin is highly porous, the principle of binding mechanism is adsorption, although there are also other mechanisms of micronutrient-humin interaction, including the formation of complexes. Here, the term adsorption is used to describe the binding of the micronutrients to humin.
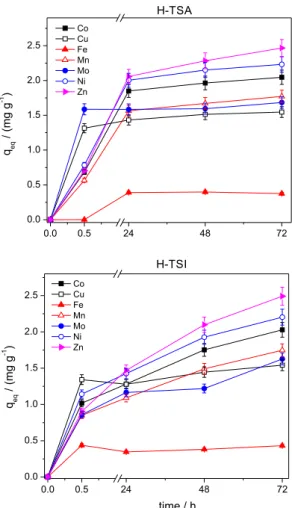
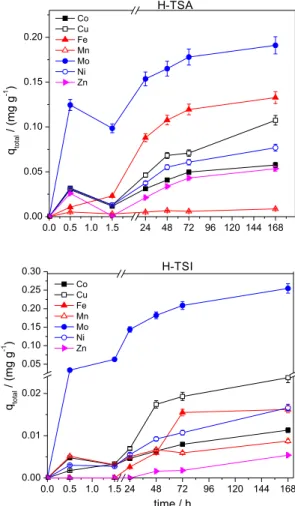
Firstly, the amounts of micronutrients adsorbed by H-TSA were plotted as a function of contact time (Figure 3). Affinity for humin was in the order: Zn > Ni > Co > Mn > Mo > Cu > Fe.
It was then possible to obtain the contact time required to reach equilibrium, described by:
Micronutrientfree + Humin ↔ Micronutrient-Humin Copper reached equilibrium after 30 min, in both cases, while Mo reached equilibrium after 30 min for H-TSA and after 24 h for H-TSI. In most cases, there was evidence of attainment of equilibrium after 24 h, although Table 2. Elemental composition and atomic ratios for the samples
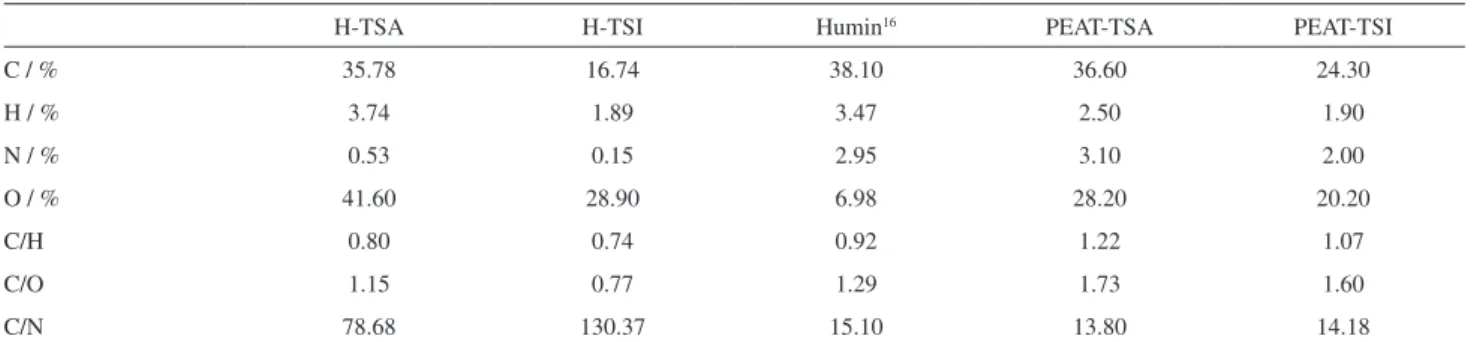
H-TSA H-TSI Humin16 PEAT-TSA PEAT-TSI
C / % 35.78 16.74 38.10 36.60 24.30
H / % 3.74 1.89 3.47 2.50 1.90
N / % 0.53 0.15 2.95 3.10 2.00
O / % 41.60 28.90 6.98 28.20 20.20
C/H 0.80 0.74 0.92 1.22 1.07
C/O 1.15 0.77 1.29 1.73 1.60
for H-TSI, the adsorption of several elements continued to increase subsequently, without establishing a plateau. The differences between H-TSA and H-TSI to attain the equilibrium could be related to the composition. A high organic matter content was verified for H-TSA, on the contrary for H-TSI. The interactions with organic matter occur faster and are stronger. H-TSI has a lower percentage of organic matter, in consequence of higher percentage of inorganic material in their composition. The interactions of micronutrients with the inorganic fraction can prevent or delay the equilibration time.
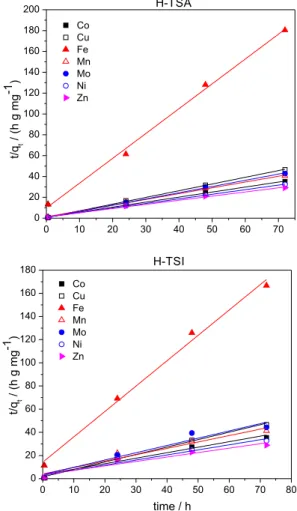
The kinetic treatments were used to understand the equilibrium conditions and the rates of the sorption processes. The values of the rate constants and the correlation coefficients obtained using the pseudo-first order and pseudo-second order models are given in Table 3. The values of the correlation coefficients (R2 > 0.9) showed that the pseudo-second order model provided the best fit for the adsorption of Cu, Co, Fe, Mn, Ni and Zn. The interactions of Co, Mn, Ni and Zn with H-TSA were also compatible with the pseudo-first order model, an indicative of heterogeneity in the nature of the complexes formed. In a previous work, the kinetics of the formation of complexes was also found to be
better described by the pseudo-second order model.18
This similarity in the findings is interesting since the adsorption mechanisms were similar, even though the sample materials were collected from different regions. Figure 3. Adsorption of micronutrients. Contact time: 0-72 h; mass of
humin: 1.0 g of H-TSA or H-TSI; multi-element solution: 10 mg L–1.
Table 3. Values of the rate constants (k1 and k2), correlation coefficients (R2) and adsorptive capacity (q
eq) obtained for the H-TSA and H-TSI humins using the pseudo-first order and pseudo-second order models
H-TSA Pseudo-first order Pseudo-second order
qeq experimental /
(mg g–1) k1 / min–1
qeq calculated /
(mg g–1) R2 k2 / (min–1 gmg–1)
qeq calculated /
(mg g–1) R2
Co 2.046 0.962 1.998 0.998 4.578 2.077 0.998
Cu 1.547 0.070 1.499 0.738 3.962 1.554 0.999
Fe 0.375 2.977 0.417 1.000 0.018 0.420 0.995
Mn 1.772 1.011 1.708 0.998 2.471 1.798 0.997
Mo 1.685 0.011 1.621 0.291 5.278 1.677 0.997
Ni 2.231 0.885 2.172 0.998 5.943 2.267 0.998
Zn 2.466 1.149 2.323 0.995 4.899 2.516 0.993
H-TSI Pseudo-first order Pseudo-second order
qeq experimental /
(mg g–1) k1 / min–1
qeq calculated /
(mg g–1) R2 k2 / (min–1 gmg–1)
qeq calculated /
(mg g–1) R2
Co 2.028 0.308 1.641 0.560 1.323 2.100 0.931
Cu 1.542 0.028 1.415 0.335 1.576 1.555 0.991
Fe 0.432 0.063 0.383 0.013 0.015 0.457 0.990
Mn 1.748 0.327 1.402 0.586 0.813 1.809 0.925
Mo 1.626 0.268 1.318 0.679 0.720 1.593 0.915
Ni 2.203 0.292 1.807 0.559 1.815 2.278 0.940
Figure 4. Experimental data and linearization using the pseudo-second order model applied to adsorption of micronutrients by humins H-TSA and H-TSI.
Figure 5. Adsorption of micronutrients as a function of humin mass. Contact time: 72 h; mass of humin: 0.5, 1.0, 2.0, and 4.0 g of H-TSA or H-TSI; multi-element solution: 10 mg L–1.
Only values of R2 are not correct indicatives of the adjustment of experimental data with the kinetic model, but only when the experimental data are in agreement with calculated data by the models. Note that the data presented in Table 3 indicate that the values of qeq calculated are close to those values of the qeq experimental for both models studied.
A higher value of k2 indicates faster interaction,19 so the rate of adsorption followed the order Fe < Cu < Mn < Co < Ni < Zn, for both samples. A linearized plot of t/qt against t, following the pseudo-second order model, is shown in Figure 4 for H-TSA and H-TSI.
The adsorption of micronutrients in humin is not the result of a single mechanism, is likely to occur simultaneously: ion exchange, adsorption on the surface, chemical adsorption, complexation and adsorption complexation. Iron was the nutrient that showed a lower amount of adsorbed material and also showed a slower reaction compared to constant (k2) of the other micronutrients, indicating that other types of interactions that not only ion exchange may be acting, such as physical adsorption on the surface.
Adsorption of the micronutrients is shown in Figure 5 as a function of the mass of humin (with constant amounts of micronutrients). The increase of the mass of humin increased the concentrations of Ni, Mn, Co and Zn adsorbed by the H-TSA humin, while Cu only showed a significant increase in adsorption when the concentration was increased from 2.0 to 4.0 g. In the case of the H-TSI humin, each element showed distinct behavior. The concentration of adsorbed Cu remained practically constant as the mass of humin was increased. The concentrations of adsorbed Co and Zn remained constant for masses of humin greater than 2.0 g, while those of Ni and Mn increased as the mass of humin increased, suggesting that for these metals, the adsorption capacity increased according to the humin mass. In systems containing 4 g of humin, Fe had lower removal rate (ca. 23%), while Zn was completely removed (100%) from the suspension.
in natura and humin in batch experiments is more difficult due to different conditions. There is little information in the literature concerning adsorption by humin since this is the least studied humic fraction, in contrast to humic and fulvic acids. Meanwhile, humins derived from different sources show distinct structural characteristics, which can explain the differences in micronutrient adsorption.
Evaluation of parameters influencing release of micronutrients from humin
The concentrations of metals determined in the solutions obtained after extraction of humin for 72 h
using deionized water were 2.50 µg L-1 of Mn for
H-TSA and 0.58 µg L–1 of Mn for H-TSI. The values for Co, Cu, Fe, Mo, Ni and Zn were below ICP OES limits of quantification.
The release of the micronutrients from the H-TSA and H-TSI samples that had been impregnated with the metals was investigated using the conditions described for the adsorption experiments. Figure 6 illustrates the release profiles obtained using 1.0 g of humin at pH 5.0. The order of release followed the sequence Mo > Fe > Cu > Ni > Co > Zn > Mn for H-TSA and Mo > Fe > Cu > Ni > Co > Mn > Zn for H-TSI. Trends in the release behavior were similar for other experimental conditions. The release of the micronutrients was slow and progressive, especially in the case of the H-TSA humin. The rates of release diminished between 30 and 90 min, and subsequently continued to increase progressively, suggesting that the metals were able to bind again with humin, until equilibrium was reached. In a few cases, there was evidence of the attainment of a plateau in the release profile.
It was observed that the solutions acquired a slight coloration, which was pH dependent and increased with contact time, indicating that part of humin was as a suspension of fine particles or maybe as a colloidal form. This is an interesting finding since it suggests that the proposed micronutrient release system could also be beneficial for the incorporation of organic matter into the soil in the form of humic substances.
This is an initial study, since there is no information in the literature on the complexation and release of micronutrients by humin, however the final objective of the research is the controlled release of micronutrients in soil, it is believed that the free micronutrients in solution possibly higher availability when applied to the soil, whereas the elements more strongly complexed with humin is released slowly.
Since there was evidence of the presence of humic substances in solution, the samples were filtered after
Figure 6. Release of micronutrients as a function of time. Contact time: 0-8 days; mass of humin: 0.6742 g of H-TSA and 0.896 g of H-TSI.
8 days, using the ultrafiltration system in order to determine the concentrations of labile metals. The labile fraction consists of those species that remain in interaction with the organic matter, but could be rapidly released to the environment following changes in the nature of the medium (for example, a shift of pH). This feature could be exploited in the application of micronutrients to the soil since in some circumstances it might be desired to apply a certain micronutrient at a high immediate availability, while a different micronutrient might be required at lower doses over a longer period. The element present at a higher relative concentration in the free form would be rapidly released, while the element present in the labile fraction would be more slowly released in the soil.
Table 4. Release of micronutrients adsorbed on H-TSA: percentages of micronutrients released into water, and free micronutrients, after 8 days, under different experimental conditions
Amount of micronutrient released / %
Co Cu Fe Mn Mo Ni Zn
qtotal qfree qtotal qfree qtotal qfree qtotal qfree qtotal qfree qtotal qfree qtotal qfree
0.50 g, pH 4.5 0.86 1.83 4.07 13.02 7.71 nd 1.01 nd 15.95 11.95 1.09 nd 0.32 90.49
1.00 g, pH 4.5 2.82 28.73 5.90 64.79 33.26 4.77 1.05 60.91 22.08 65.87 3.45 34.78 1.20 ca. 100
2.00 g, pH 4.5 8.75 8.06 14.91 13.11 ca. 100 5.98 6.96 10.42 15.58 28.47 10.78 9.13 7.71 55.13
4.00 g, pH 4.5 10.18 6.90 16.58 8.90 ca. 100 2.73 8.82 7.44 29.52 19.62 14.21 7.14 10.20 25.79
1.00 g, pH 3.0 3.08 93.19 4.19 ca. 100 26.29 37.62 2.27 ca. 100 22.58 ca. 100 4.33 ca. 100 3.42 ca. 100
1.00 g, pH 6.0 0.57 ca. 100 6.56 99.42 3.40 95.54 0.35 ca. 100 46.97 18.40 1.11 ca. 100 0.23 ca. 100
nd: not determined. Concentrations of elements were lower than ICP OES limits of quantification, so it was not possible to determine the percentage values.
Table 5. Release of micronutrients adsorbed on H-TSI: percentages of micronutrients released into water, and free micronutrients, after 8 days, under different experimental conditions
Amount of micronutrient released / %
Co Cu Fe Mn Mo Ni Zn
qtotal qfree qtotal qfree qtotal qfree qtotal qfree qtotal qfree qtotal qfree qtotal qfree
0.50 g, pH 4.5 0.34 68.68 1.19 50.78 nd nd 0.70 87.01 12.02 14.33 0.46 79.80 nd nd
1.00 g, pH 4.5 0.56 29.54 1.54 51.47 3.75 74.59 0.50 65.96 15.66 67.66 0.74 18.27 0.77 ca.100
2.00 g, pH 4.5 1.22 22.25 2.65 16.06 24.39 8.62 1.08 32.28 19.92 34.72 1.45 16.28 0.85 ca.100
4.00 g, pH 4.5 2.36 20.20 5.22 19.43 74.33 18.01 2.31 21.82 17.08 25.24 2.80 20.56 2.38 ca.100
1.00 g, pH 3.0 0.14 96.22 0.53 45.46 0.72 ca. 100 0.11 ca.100 10.14 48.20 0.30 62.93 0.05 ca.100
1.00 g, pH 6.0 0.30 35.74 2.15 70.63 3.74 ca.100 0.27 86.72 3.70 85.93 0.50 41.22 0.06 ca.100
nd: not determined. Concentrations of elements were lower than ICP OES limits of quantification, so it was not possible to determine the percentage values.
conditions. In Table 3, the values of qeq experimental are presented considering this value as all the micronutrient adsorbed, i.e., it is 100% adsorbed micronutrients. The qtotal value was calculated as the percentage ratio of the released total micronutrient. Similarly, qfree is the ratio between the released total micronutrient and released free micronutrient in water.
Conclusions
The results of the initial adsorption and release experiments indicate that the little-studied humin fraction of peat is a promising material for the controlled release of micronutrients in agricultural applications.
Currently, 60% of the applied fertilizers in agriculture are lost by evaporation or leaching, the application of humin treated with micronutrients reduces waste and environmental impact of fertilizer that they might cause. In addition, humin presents a low cost and the peatbog is found in abundance in the world, only Brazil has reserves estimated at 1.6 billion cm3 of peat distributed in more than 200 bogs throughout its territory.17 Whereas
the extraction yield of humin is about 30% of the application humin treated with micronutrients that can be economically viable.
Because of lower cost compared with exchange resin commercially found and whereas the high values obtained in the removal of humin in aqueous solutions, this also has applicability in the removal of ions from contaminated effluents to replace materials that have been used for this purpose.
Further work will be needed to investigate the influence of different environmental variables and then apply the humin-enriched in pot experiments to determine the influence of micronutrients on plant development.
Acknowledgements
The authors would like to thank Dr. Tiago Venâncio from the Universidade Federal de São Carlos (UFSCar) for the 13C NMR analyses.
References
1. Botero, W. G.; Oliveira, L. C. de; Rocha, J. C.; Rosa, A. H.; Santos, A. dos.; J. Hazard. Mater. 2010, 177, 307.
2. Stevenson, F. J.; Humus Chemistry: Genesis, Composition, Reactions, 2nd ed.; New York: John Wiley & Sons, 1994.
3. Ayuso, M.; Hernández, T.; Garcia, C.; Pascual, J. A.; Bioresour. Technol. 1996, 57, 251.
4. Tufenkci, S.; Turkmen, O.; Sonmez, F.; Erdinc, C.; Sensoy, S.; Fresenius Environ. Bull. 2006, 15, 295.
5. Verlinden, G.; Coussens, T.; de Vliegher, A.; Baert, G.; Haesaert, G.; Grass Forage Sci. 2010, 65, 133.
6. Verlinden, G.; Pycke, B.; Mertens, J.; Debersaques, F.; Verheyen, K.; J. Plant Nutr. 2009, 32, 1407.
7. http://www.calciumproducts.com/articles/Dr._Pettit_Humate. pdf, accessed in March 2013.
8. Calace, N.; Petronio, B. M.; Persia, S.; Pietroletti, M.; Pacioni, D.; Talanta 2007, 71, 1444.
9. de La Rosa, G.; Peralta-Videa, J. R.; Gardea-Torresdey, J. L.; J. Hazard. Mater. 2003, 97, 207.
10. Rosa, A. H.; Rocha, J. C.; Furlan, M.; Quim. Nova 2000, 23, 472.
11. Batista, A. P. S.; Romão, L. P. C.; Arguello, M.; Garcia, C. A. B.; Alves, J. P. H.; Passos, E. A.; J. Hazard. Mater. 2009, 163, 517. 12. Won, S. W.; Han, M. H.; Yun, Y. S; Water Res. 2008, 42, 4847. 13. Liu, Z.; Chen, X.; Zhou, L.; Wei, P.; Min. Sci. Technol. 2009,
19, 230.
14. Ho, Y. S.; Mckay, G.; Water Res. 2000, 34, 735.
15. Fernández-Escobar, R.; Benlloch, M.; Herrera, E.; García-Novelo, J. M.; Sci. Hortic. 2004, 101, 39.
16. Cunha, G. da C.; Romão, L. P. R.; Santos, M. C.; Araújo, B. R.; Navickiene, S.; Pádua, V. L.; Bioresour. Technol. 2010, 101, 3345.
17. Sanches, S. M.; Campos, S. X. de; Vieira, E. M.; Ecl. Quím.
2007, 32, 49.
18. Kalmykova, Y.; Stromvall, A.; Steenari, B.; J. Hazard. Mater.
2008, 152, 885.
19. Ho, Y. S.; J. Hazard. Mater. 2006, 136, 681.
20. Cerqueira, S. C. A.; Romão, L. P. C.; Fraga, L. E.; Lucas, S. C. O.; Simões, M. L.; Hammer, P.; Lead, J. R.; Mangoni, A. P.; Mangrich, A. S.; Fuel 2012, 91, 141.
21. de la Rosa, G.; Gardea-Torresdey, J.L. Peralta-Videa, J. R. Herrera, I. Contreras C.; Bioresour. Technol. 2003, 90, 11.
Submitted: October 26, 2012
Published online: April 17, 2013