The Extended Hubbard Model Applied to Phase
Diagram and the Pressure Eects in
Bi
2 Sr
2
CaCu
2 O
8+y
Superconductors
E. V. L. deMello
Departamento de Fisica, Universidade Federal Fluminense, Av. Litor^ania s/n, Niteroi, R.J., 24210-340, Brazil Received 4 June, 1999. Revised version received on 2 August, 1999
We use the two dimensional extended Hubbard Hamiltonian with the position of the attractive potential as a variable parameter, within a BCS type approach, to study the interplay between the superconductor transition temperatureT
cand hole content for high temperature superconductors.
This method gives some insight on the range and intensity of the Cooper pair interaction. It suggests why dierent compounds have dierent values for their measured coherence lengths, and describes the experimental results of the superconducting phase diagramTcn. The calculations
may also be used to study the eect of the applied pressure with the assumption that it increases the attractive potential which is accompanied by an increase in the superconductor gap. In this way we obtain a microscopic interpretation for the intrinsic term and a general expansion forT
cin terms
of the pressure which reproduces well the experimental measurements on theBi2Sr2CaCu2O8+y
superconductors.
I Introduction
In order to understand the superconductivity mecha-nism for high-Tc superconductors (HTSC), many
ex-periments have attempted to nd out possibles corre-lations between the superconductivity temperatures Tc
and some physical parameter. Some of these experi-ments deal with the interplay amongTc, hole contents,
and pressure eects, which have revealed interesting features as the maximum attained Tc[1] and have
at-tracted a lot of attention as it is summarized by some review articles[2, 3, 4]. On the other hand, neither one of the several microscopic theoretical models have been able to deal successfully with all these observed basic properties and therefore the nature of the condensate
pair has not yet been established. As a consequence, some phenomenological approaches have been advanced in an eort to account for the large experimental data on HTSC. For instance, theTc dependence on the
num-ber of carriers perCuO
2follows the so-called universal
inverse parabolic curve, i.e.,Tc =Tcmax[1,(n,nop) 2]
where nop is the optimum carrier density n and is
an adjustable parameter which depends on the type of compound.
Recently we have introduced an intermediate approach[5] which is neither pure microscopic nor pure phenomenological. It starts with the microscopic ex-tended Hubbard Hamiltonian (t-U-V) on a square lat-tice of sidea,
c
H=, X
hiji; t(c
y
icj+h:c:) +U X
i
ni #
ni "
,V X
hiji
ninj; (1)
d
where t is the nearest neighbor hopping integral, U
is the on-site repulsion and V a phenomenological at-tractive interaction. Several authors have argued that
posterioriin comparison with the experimental results
for Tc
n. The hopping integral t is obtained by
com-paring with band structure calculations[7]. Using the BCS method and the Fourier transform of the poten-tial we have derived zero and nite temperature gap equations which are integrated up to region where pair formation has a non-negligible probability. In this way we have been able to relate Tc, hole content n and
the strength of the zero temperature gap (0) as de-scribed in detail in Ref.[5]. As concerns the phase di-agram, its optimal doping is very sensitive if we move V from its original nearest neighbor position for the sx
2
+y
2-channel but does not change its optimal
po-sition for dx 2
,y
2-wave. A study of these and others
channels as well as their complex mixtures and inter-play as function of the position of V will be published elsewhere[8]. This method was successfully applied to the experimental measurements of the curves Tc
n for
the La(Sr;Ba)CuO and Y BaCuO compounds[5]. On the other hand if we study the typical parameter which characterizes the strength of the attractive interaction for a square well in 2D with range d and strength[9] V, = med
2V=2 ~
2, we see that for the above two
com-pounds and Hg1201 and Bi2Sr2CaCu2O8+y, it varies
between 10-3000 and such high values indicate that the size of the bound states (or Cooper pairs) is re-lated to the position of the minimum and the range of the attractive potential. This is the main motiva-tion to change the posimotiva-tion of the attractive potential V from the usual nearest neighbor and it is very in-teresting to nd out that the curves for Tc
n yield
a dierent sx 2
+y
2-wave optimal doping value
depend-ing on the size of V while it remains xed for dx 2
,y 2
-wave. Another interesting point from the theoretical point of view is that it provides a natural interpre-tation for the order parameter expansion introduced by the spin-uctuation theory[10]. In this approach it has been proposed a dx
2
,y
2-wave gap of the form
0(~k)(coskxa ,cosk
ya) where 0(~k) is expanded in
powers of (coskxa + coskya). Analising this
expan-sion, one can easily verify that it contains terms like (coskxa
,cosk
ya)(coskxa + coskya) which are
propor-tional to (cos(2kxa)
,cos(2k
ya)) and what can be seen
as a type of d-wave gap symmetry that arises from a potential like V (~k) = V0(cos(2kxa) + cos(2kya)). By
the same token, we can nd terms proportional to (cos(3kxa)
,cos(3k
ya)) which can be originated by
a potential V (~k) = V0(cos(3kxa) + cos(3kya)) and so
on. Based on this result, we adopt below a notation V (~k) = V0(cos(bkxa) + cos(bkya)), with b = 1;2;3;:::.
As one expects, the more distant is the position of V, that is the larger is b, smaller is the value of the density necessary to start the superconductivity process of pair
formation. In this way we have derived Tc
n curves[5]
that agree well with the experimental data when V was placed at 6th (s-wave) and 3r d (d-wave) neighbors for
La(Sr;Ba)CuO and Y BaCuO compounds respectively which by the way is very close the ratios of their mea-sured coherence length [11]. Thus the method pro-vides a very interesting and direct interpretation for the measured values of the coherence length for the HTSC compounds besides the fact that it gives a hint for the superconducting fundamental interaction in HTSC.
We have also extended this approach to study the pressure eects[12] on HTSC. We have noticed that Tc(n) is very sensitive to changes in the zero
tempera-ture gap amplitude (0) which is used as an adjustable parameter. Consequently we have introduced the as-sumption that the pressure induces changes on the at-tractive potential end ultimately on (0)[12]. This as-sumption together with the well documented fact that the applied pressure induces a charge transfer from the reservoir layers to the CuO2 planes, has enabled us to
derive an expansion for Tc(n;P) in power of the
pres-sure. This expansion was applied to the Hg1201, 1212 and 1232 compounds and has reproduced the measured values of Tc for a large set of hole content and
ap-plied pressures up to 45 GPa[12]. We should stress that since the principal interaction mechanism which forms Cooper pairs has yet to be identied, the connection between Tc, hole content, pressure eects and a
micro-scopic Hamiltonian should provide some clues for this interaction and it is a ecient method to obtain infor-mation on the microscopic mechanism for HTSC. Thus our study provides a guide to the strength and range of this fundamental mechanism.
In this paper we shall clarify and illustrate the main physical ideas of the method mentioned above and to show that it is general and can be applied to other HTSC than the Hg-based compounds, as we apply it to the experimental phase diagram and pressure data on Bi2212. The Bi2Sr2CaCu2O8+y family has been
studied by several groups and in particular, we shall discuss rstly the measurements of the dependence of the critical temperature Tc on the hole content n[13]
to set the pertinent parameters to be used afterwards on the study of the variation of Tc under applied
exter-nal pressures[14]. The Bi2Sr2CaCu2O8+yis strongly
anisotropic, its resistivity on the ab plane is 104 larger
II The Method
Following the BCS method[15] we use a many-body wave function which describes the formation of pairs of charge carriers
ji= Y ~ k u ~ k+ v ~ k c y ~ k" c , ~ k# j 0 i; (2) where j 0
iis the empty band state andu 2 ~ k+ v 2 ~
k= 1.
In connection with the Hamiltonian of Eq. (1), and the variational approach[15], we obtain
~ k = , X ~ l V ~ k ~ l u ~ l v ~ l (3) where V ~ k ~
l is the Fourier transform of the
poten-tial of Eq. (1), and following along the lines of Ref.[7] may be written in a "separable" form, V
~
k ~
l = U ,2V(cos(k
x a)cos(l
x
a) + cos(k y
a)cos(l y
a)). A
sim-ilar approach which takes next-nearest neighbor hop-ping into account was developed by Angilella et al[7] with the same purpose to study pressure eects on
Bi 2 Sr 2 CaCu 2 O
8+ycompounds but they only deal with
nearest neighbor attractions. With the use of the ex-pressions foru
~
land v
~
k, we get an equation for the zero
temperature gap, ~ k = , X ~ l V ~ k ~ l ~ l 2 2 ~ l + 2 ~ l 1=2 : (4) Where ~ k=
,2t(cos(k x
a) +cos(k y
a)),,
Thus since the gap has the same functional form of the potential, namely, ~
k = (0)( cos(k
x a) cos(k
y
a))=2, where the plus sign is for the s-wave and
the minus sign is for d-wave channel. The chemical po-tential yields the density n that must be calculated
self-consistently[6] but as it concerns the superconduct-ing phase boundary it suces to approximate it by the
T = 0K value of the maximum energy (concentration
dependent) in the tight-binding band.
In order to study pair formation, we calculate the probability of nding a hole pair, that is, the conden-sation amplitudeF
~ k u ~ k v ~
k. It is a general result[15]
that it has a maximumatk
F and drops very rapidly for jk j>k
F. According to these considerations and taking ~
k= (0;0) in Eq. (4), we obtain for s-wave c A= Z 0 Z 0 dd
(U,2Vf +(
b;b))f +(
b;b)=2
(2t(f +(
;),)) 2
+ ((0)f +(
b;b)=2) 2 1=2 ; (5) d where f (
;) coscos and = k x
a and =k
y
a. =f +(
F ;
F) and
F and
F are the
max-imumT = 0 occupied values (like a Fermi momentum)
that depend on the density of holesn. The parameterb
is used to set the position of the attractive potential V, thus b= 2 for thirdnearest neighb or and so on.
We use F =
F
ar cos(1,n) and=,2t(cos( F)).
The integrations are performed up to and
, which
are determined at values where the condensation am-plitude becomes very small, namely,F
~
k
0:01. This is
usually attained for ~
k
>6(0).
For T 6= 0, the excitations with their respective
probability must be taken into account. The deriva-tion of a self-consistently temperature-dependent gap equation is analogous to that which leads to Eq. (5). At this point, we again follow the BCS approach[15] and assume that (T) vanishes at the critical
temper-atureT
c, which yields the following equation for s-wave
symmetry, c B= Z 0 Z 0 dd
(U,2Vf +(
b;b))f +(
b;b)tanh 2 2K B T c
2t(f +(
;),f +( F ; F)) ; (6)
where we again integrate up to and
Now, if we had integrated Eqs. (5 and 6) over the whole Brillouin Zone and solve them self-consistently,
we would get A = B = ,(2)
2. Instead of this
pro-cedure, we nd, for a given density n, the value of T c
a given (0) andb. This is the basic procedure of our
method. The same approach can be carried out for d-wave symmetry but in this case we take ~
k = (0; =2)
in Eqs.(5 and 6). Thus, with only one given value for the parameterband another one for (0), we can nd
the value of Tc for a given density of carriers n and
therefore obtain the curveTcn.
III Pressure Eects
Now we turn our attention to the study of the HTSC under pressure. One of the eects of the pressure which is generally accepted and well documented in certain materials is an increase of the carrier concentra-tion on theCuO
2 planes transferred from the reservoir
layers[2, 3, 4]. Such pressure induced charge transfer (PICT) has been conrmed by Hall eect and thermo-electric power measurements on several compounds[3]. Therefore this eect combined with an assumption of an intrinsic variation of Tc (linear on the pressure)
independently of the charge transfer was largely ex-plored to account for the quantitative relation be-tween Tc and the pressure P and it gave origin to
many models[16, 17, 18, 19, 20]. However, the var-ious pressure data taken with the mercury family of compounds[21, 1] for underdoped and overdoped com-pounds ofHg Ba
2 CuO
4, (Hg1201) has some features
that could not be interpreted[21, 1] by these pure charge transfer models by a single set of parameters. On the other hand we could explain the Hg-family data using a single set of parameter and this is an achievement of
our method described below.
The study ofTcn which is necessary to nd the
appropriated values of b and (0) (atP = 0)
demon-strated the direct proportionality between (0) andTc
which varies with the hole content n and it is
maxi-mum at the optimal doping. Taking this result into account and the discussion of the above paragraph, we are led to propose that the eects of pressure are two-fold: (i)- The well accepted PICT and an additional assumption; (ii)- A change in the attractive potential V as proposed previously by Angilella et al[7] which also implies on a change in the zero temperature gap (0). The assumption "ii" came from the analysis of the curves Tcn which have revealed thatTc is
pro-portional to (0) but with a large constant of propor-tionality around the optimal doping[12]nopand smaller
near the both underdoped and overdoped extremes of theTcncurve. The quantitative changes on V due to
the applied pressure were estimated in Ref.[7] for the
Bi
2 Sr
2 CaCu
2 O
8+yusing the measured values[14] of the
compressibility tensor under the linear approximation and the self-consistently equations.
Thus the PICT (i) implies thatn(P) =n+ n(P)
and the assumption of a pressure dependent gap (ii) im-plies that (0;P) = (0) + (0;P) and both
equa-tions lead to Tc(n;P) = Tc(n(P);(0;P)). Therefore
to estimate Tc for a given compound with a nominal
value ofnand under a given pressure P, we perform an
expansion of Tc(n;P) in terms of P. With the
assump-tion of the linear variaassump-tion ofnandTcmax(or (0)) on
the pressure, we obtain only terms up to third order, that is,
c
Tc(n;P) = 3
X
Z=0
ZPZ=Z! (7)
with
Z = ( @
@(0) @(0)
@P
+ @ @n
@n
@P
)ZTc(n(P);(0;P)) ;z= 1;2 and 3 (8)
d
and 0 =
Tc(n(0);(0)) is just the P = 0 term and
where the derivatives @(0)
@P and @P@n are determined by
comparing with the experimental data; @(0)
@P can be
estimated by a set of values TcP for a given
den-sitynand @P@n can be determined by Hall coecients or
thermoelectric power measurements. After determined these parameters, one can derive analytical expressions for each coecient as function ofn; using the universal
parabolic tting we can obtain a analytical expression for@Tc=@nand studying the phase diagram for dierent
values of (0), we can calculate @Tc=@P which
calcu-lates the Tc dependency on P (assumption ii). This
procedure gives an intrinsic term which has a clear in-terpretation since it comes from the changes in (0) as well as a new third order term. It is remarkable that with a single set of parameters calculated for HG1201, with just the change inTcmax, we were also able to apply
IV Comparison with the
Exper-iments
In order to apply the entire approach described above, we start with the P = 0 curve Tc n for Bi
2 Sr
2 CaCu
2 O
8+ywhich allows us to determine the
initial parameters b and (0). We have used the
val-ues t = 0:05eV and V= 0:052eV given in Ref.[7].
The coherence length estimate forBi 2
Sr
2 CaCu
2 O
8+yis 13A which is about 10% less than the for
YBaCuO[11]. Since we have used b = 2,3 for
t-ting the phase diagram for these compounds, we use here b = 2:6,2:7 in order to obtain Tc n for Bi
2 Sr
2 CaCu
2 O
8+y. The results are displayed on Fig.1
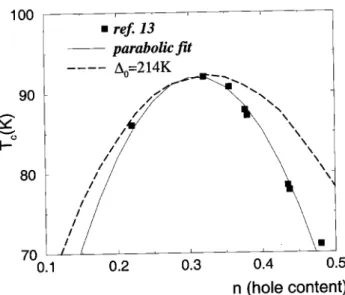
and one can see that it provides a very reasonable t-ting for the experimental points of Allgeier et al[13]. In order to match theTcmax = 92:5 with V= 0:052eV,
we used (0) = 214K which is the same for all values of n. This value is very close (0) = 210K used to
the Hg1210 compounds because both compounds have very closed values for Tcmax = 92,94K and we used
for both a sx 2
+y
2 gap function. We have also
plot-ted a parametric curve which has been applied to t the experimental points, Tc = Tcmax[1,(n,nop)
2]
with Tcmax = 92:5K and = 9:0. However the data
of Huang et al[14] appears to have smaller Tcmax,
dis-placed toward higher hole densities and they are tted with= 25:0. The parabolic is a pure
phenomenologi-cal tting which is used here only because it provides a analytical expression that can be used in the pressure expansion to estimate@Tc=@n.
Now that b and (0) has been determined let us
study theBi 2
Sr
2 CaCu
2 O
8+ycompound under applied
pressure. From the analysis of the phase diagram[13] shown in Fig.1 and by varying the value of (0) around the P = 0 value of (0) = 214K, we can infer that @Tc=@(0) = 0:35 at n0:25 which is near the
opti-mal doping value of hole content used by Angilella et al[7]. From the Hall coecient measurements[14], we getd(l n(n))=dP= +8% and since their results seem to
be shifted to larger values of hole contents, we estimate
dn=dP 3:010
,2 which is two order of magnitude
higher than previously derived dn=dP 1:810 ,3 for
the pressure eects on Hg compounds[12]. From the low pressure data we can get
1 = 6
:0K =GPa which
allows us to derive the value@(0)=@P = 4:86K =GPa
which is necessary to determine all the high order co-ecients. We noticed that this value is very close to
@(0)=@P = 4:30K =GPa derived for the Hg-based
HTSC. Now , with the values of@(0)=@P anddn=dP
determined, we can calculate the high order terms of Eq.8 and in particular, we obtain
2=
,2:48K =GPa 2.
The third order coecient was also calculated but it does not give any appreciable contribution in the range of pressure below 2GPa. Thus with all the coecients
of Eq.8 determined, we are all set to calculate the val-ues ofTc(n;P). The calculated results are in excellent
agreement with the experimental data[14] as it is shown in Fig.2. The large value ofdn=dP yields a very large
negative second order coecient
2 what makes the
curve change its derivative at P 1:2 GPa. For the
Hg compounds the change in sign ofdTc=dP occurs at
much largerP 30:0 GPa and from the above
analy-sis we can see that this dierence in behavior is due to the large dierence on the value of the charge transfer
dn=dP for this two compounds.
V Conclusions
Thus, we conclude this work pointing out that our novel calculations based on a BCS type mean eld and on the extended Hubbard Hamiltonian with the position of V as a variable parameter, is appropriate to de-scribe the interplay between the Tc and hole content
for HTSC. The change in the position of the attrac-tive interaction provides informations on the range of the Cooper pair attractive mechanism. Our method yields also a novel and systematic way to study the eects of the pressure and gives indication that the pressure induces a variation on the attractive poten-tial which in turn, gives an intuitive interpretation on the origin of the intrinsic term. We should also em-phasize that our procedure isbased and has its starting point on a microscopic Hamiltonianand it diers from some pure phenomenological ways to t the data[22] that uses a parabolic tting to the experimental pres-sure data and are in the same category of the inverse parabolic tting for theTcncurves mentioned above
that are useful to obtain information on the dierent sets of data but has not any microscopic implications which is our main concern here. By applying it to theBi
2 Sr
2 CaCu
2 O
8+ysuperconductors and comparing
Figure 1. Calculations for the Bi phase diagram. The con-tinuous line is the phenomenological tting and the dashed line are the calculations described in the article. The squares are experimental points taken from Ref.13.
Figure 2. Calculations for the variations of Tc for the Bi
compound under pressure. The circles are experimental points taken from Ref.14.
Acknowledgments
We acknowledge partial nancial support from the Brazilian agencies Capes and CNPq.
References
[1] L.Gao et al, Phys. Rev. B50, 4260 (1994).
[2] R.J. Wijngaarden and R. Griessen, High Pressures Studiesin Studies of High Temperature Superconduc-tors, vol.2, p.29 edited by A.V. Narlikar (Nova Science, N.Y.,1989).
[3] H. Takahashi and N.Mori, inStudies of High Tempera-ture Superconductors, vol.16, edited by A.V. Narlikar, (Nova Science, N.Y.,1996).
[4] J.S. Schilling and S. Klotz, in Physical Properties of High Temperature Superconductors, edited by D.M. Ginsberg, vol.II, (World Scientic, Singapore 1992). [5] E.V.L. de Mello, Physica C259, 109 (1996) and Check.
J. Phys.46, 945 (1996).
[6] R. Micnas, J. Ranninger and S. Robaszkiewicz, Rev. Mod. Phys.62, 113 (1990).
[7] G.G.N. Angilella, R. Pucci and F. Siring, Phys. Rev. B54, 15471 (1996).
[8] E.V.L. de Mello, Physica C, in press.
[9] Mecanique Quantique, L. Landau and I. Lifshitz, (Ed. Mir, Moscow 1966), page 190.
[10] P. Monthoux, A. V. Balatsky and D. Pines, Phys. Rev. Lett.67, 3448 (1991).
[11] M. Cyrot and D. Pavuna,Introduction to Superconduc-tivity and High-Tc Materials, World Scientic, Singa-pore (1992).
[12] E.V.L. de Mello and C. Acha, Phys. Rev. B 56, 466
(1997). and Physica C282-287, 1819, (1997).
[13] C. Allgeier and J. S. Schilling, Physica C 168, 499
(1990).
[14] T. Huang et al, Phys. Rev. B48, 7712 (1993).
[15] P.G. de Gennes, Superconductivity of Metals and Al-loys, W.A. Benjamin, New York, 1966.
[16] R.J. Wijngaarden, E.N. Van Eenige, J.J. Scholtz and R. Griessen, Physica C185-189, 787 (1991).
[17] C.C. Almasan, Phys. Rev. Lett.69, 680 (1992).
[18] J.J. Neumeier and H.A. Zimmermann, Phys. Rev. B
47, 8385 (1993).
[19] R.P. Gupta and M. Gupta, Phys. Rev. B 51 11760
(1995).
[20] M. Kosuge et al, Phys. Rev. B45, 10713 (1992).
[21] Y. Cao, Q. Xiong, Y.Y. Xue and W. Chu, Phys. Rev. B52, 6854 (1995).