O
RIGINALA
RTICLE Revista Brasileira de FisioterapiaPredicting mobility gains among children with
cerebral palsy after application of botulinum
toxin A
Predizendo ganhos de mobilidade em crianças com paralisia cerebral após
aplicação de toxina botulínica A
Cury VCR¹, Mancini MC², Fonseca ST³, Melo APP¹, Sampaio RF³, Tirado MGA²
Abstract
Background:Botulinum toxin A (BTA) is commonly used to treat children with cerebral palsy (CP). However, the variables measured before
BTA application and associated with motor function and independent mobility, known as predictors of functional outcomes, have not been well defined. Objective: To identify clinical predictors of gains in functional motor skills and independence of mobility among children with CP, three and six months after BTA application.Methods:This was a convenience sample of children with spastic CP (n=35). Measurements of quantitative gains in motor skills and independence of mobility were taken three and six months after BTA application. These outcomes were observed through repeated applications of two functional tests: GMFM (Gross Motor Function Measure) and PEDI (Pediatric Evaluation of Disability Inventory). These tests evaluated gross motor function while sitting or standing and during transitions between these postures, and also during dynamic activities such as walking, running and jumping, along with the children’s independence in mobility tasks. The independent variables included the children’s characteristics such as age, severity, topographic diagnosis, neuromuscular-skeletal parameters (range of motion and spasticity), gait quality and performance in the functional tests before BTA. Results: Four predictive models were developed (R2
between 0.58 and 0.83; p<0.05) through the use of CART analysis: two at three months and two at six months after BTA application. The results indicated that children with better gait quality, smaller repertoire of functional motor skills, less independence of locomotion and age below four years and six months before BTA presented greater gains in motor skills and independence in mobility. Conclusion:The results identified significant clinical parameters that can predict functional outcomes of BTA applications among children with CP.
Key words: botulinum toxin type A; cerebral palsy; mobility limitations; motor skills.
Resumo
Contextualização:Atoxina botulínica A (TBA) é comumente utilizada em crianças com paralisia cerebral (PC), entretanto preditores de desfechos funcionais, ou seja, variáveis mensuradas pré-aplicação da TBA e associadas a ganho na função motora e independência na mobilidade não são bem definidos.Objetivo:Identificar preditores clínicos de ganho em habilidades motoras funcionais e independência em mobilidade em crianças com PC, aos três e seis meses pós-aplicação de TBA.Métodos:Amostra de conveniênciade crianças com PCespástica (n=35). As medidas incluíram: melhora quantitativa nas habilidades motoras e na independência em mobilidade aos três e seis meses após a aplicação da TBA. Esses desfechos foram observados por meio de aplicações repetidas dos testes funcionais GMFM (Gross Motor Function Measure) e PEDI (Pediatric Evaluation of Disability Inventory). Esses testes avaliaram a função motora grossa durante a manutenção e transições entre as posturas sentada e de pé, além de atividades dinâmicas como andar, correr e pular, e a independência da criança em tarefas de mobilidade. As variáveis independentes incluíram características das crianças como idade, severidade e diagnóstico topográfico, parâmetros neuromusculoesquelético (amplitude de movimento, espasticidade), qualidade da marcha e desempenho nos testes funcionais antes da TBA. Resultados: Foram gerados quatro modelos preditivos (R2 entre 0,58 e 0,83; p<0,05), dois aos três e dois aos seis
meses após a aplicação da TBA, a partir da análise CART. Os resultados indicaram que crianças com melhor qualidade da marcha, menor repertório de habilidades da função motora, menor independência na locomoção e idade menor que quatro anos e seis meses pré TBA apresentaram maior ganho de habilidades motoras e de independência em mobilidade. Conclusão:Os resultados identificaram parâmetros clínicos importantes de serem documentados em crianças com PC submetidas à aplicação da TBA para predizer desfechos funcionais.
Palavras-chave:toxina botulínica tipo A; paralisia cerebral; limitações da mobilidade; habilidades motoras.
Received: 25/03/2008 – Revised: 18/07/2008 – Accepted: 10/11/2008
¹ Physical Therapist
² Department of Occupational Therapy, Universidade Federal de Minas Gerais (UFMG), Belo Horizonte (MG), Brazil ³ Department of Physical Therapy, UFMG
Correspondence to: Valeria Cristina Rodrigues Cury, Rua Groenlândia, 395, apto 201, Bairro Sion, CEP 30320-060, Belo Horizonte (MG), Brazil, email: [email protected]
Introduction
Botulinum Toxin A (BTA) is applied as a neuromuscular injection to treat lower limb spasticity in children with cerebral palsy (CP)1-5. he primary efect of BTA is to reduce the
hyper-activity of single muscles or muscle groups through chemical denervation at the peripheral nerve ending1,5.he duration of
the efect is dose-dependent and subject to individual variation, lasting from two to six months6. he positive efects of BTA
in-clude reduction of spasticity and this, in association with physi-cal therapy and the use of orthoses, may lead to improvements in children’s gait quality and joint range of motion7,8. However,
increased mobility and motor skill performance are functional results that are important to such children and their families and that have not been fully explored in the literature1,2,5.
he criteria for prescribing BTA injections are typically based on children’s characteristics including their age and the topographic distribution and severity of CP, along with neuro-muscular-skeletal parameters such as selective ankle motion, dynamic and static muscle lengths, gait quality and spasticity7.
he aim of these criteria is to indicate the subgroup of children with CP that is most likely to show positive results following BTA injection. However, children with similar clinical charac-teristics and motor severity often demonstrate individual vari-ability in functional results following application5. hus, there
is no consensus in the literature concerning which clinical characteristics, in pre-application evaluations, are predictive of positive functional outcomes.
Until recently, only a limited number of studies have focused on identifying clinical factors associated with positive changes in children who undergo BTA application9,10. Such information
helps guide the identiication of patients who are most likely to beneit from BTA application, as well as establishing reason-able expectations regarding the efects of this medication.
he objective of this study was to evaluate the predictive power of characteristics and neuromuscular-skeletal param-eters of children with CP that are documented prior to BTA application, in relation to these children’s responsiveness in functional motor skills and independence of mobility, three and six months after BTA injection. In addition, the study aimed to identify the cutof points for the independent variables associ-ated with the positive functional outcomes.
Methods
Participants and procedure
hirty-ive children (28 males, seven females; mean age: four years and nine months; SD: two years and one month; range:
two to 11 years) participated in this study. he sample size es-timation was based on results from Ubhi et al.2, who described
a 6% improvement in one of the GMFM dimensions, three months after BTA injections. Based on an efect size of d=2.7 and two-tailed analysis with α=0.05, a study with power=0.80 would require a sample of between 31 and 48 children to dem-onstrate an efect.
he inclusion criteria were: medical diagnosis of spastic CP and motor severity classiied according to the Gross Mo-tor Function Classiication System (GMFCS)11 at levels 1 to 4.
hese levels included children who had some type of functional mobility. he participants received medical prescriptions for BTA injections to the calves, with or without injections in other muscle groups such as the posterior tibialis, hip adduc-tors and/or hamstrings. he dosages of BTA ranged from 8 to 10 units/kg, using Botox (Allergan), and from 20 to 25 units/kg, using Dysport (Speywood).
All the children who were enrolled at the orthopedics service of a rehabilitation center from June 2002 to July 2004, and who met the inclusion criteria, were invited to participate. Out of the initial 39 potential participants, the parents of 35 children voluntarily agreed to their child’s participation. All the children wore ankle-foot orthoses and attended physical therapy sessions based on neurodevelopmental treatment (NDT) throughout the study period. he exclusion criteria were orthopedic surgery within the 12 months preceding data collection, visual incapacity that might interfere with perform-ing mobility activities and diiculties in comprehendperform-ing simple instructions.
A. Functional outcomes
he children were measured at baseline (before injection), and three and six months after injection. Two standardized tests documented the children’s functional mobility at these three measurement times: the Gross Motor Function Measure (GMFM)12 (dimensions D and E) and the Pediatric Evaluation
of Disability Inventory (PEDI)13(mobility scales from the
func-tional skills and caregiver assistance parts).
B. Clinical examination protocol
he clinical parameters used for lower limb assessments on the children with CP formed the independent variables of the study, such as gait quality, dynamic length of calf muscles, static length of calf muscles, ankle range of motion, calf muscle spasticity and selective control of ankle dorsilexion movement. he Physicians’ Rating Scale (modiied PRS)14 measured gait
quality and the presence of pes equinus. his scale was used to analyze a typical walk, viewed on split-screen video in slow motion. Several items were geared towards visually quantifying the relationship between the ankle and knee positions during
the stance. he lower limbs were assessed separately and received a maximum score of 18 points. he dynamic length of calf muscles (R1), static lengthof calf muscles (R2) and ankle range of motion (R2-R1 range) were assessed using the modiied Tardieu scale7. his scale measured the point of resistance to fast
stretching. A “catch” resulting from an “overactive stretch relex” could be seen within the rapid range of motion at a particular angle, deined as R1. he slow passive joint range of movement, also measured by goniometry, and recorded in a standardized format gave an indication of the static length of the calf muscles (R2). he children’s calf spasticity was assessed using the modiied Ashworth scale15. he children’s ability to perform active ankle
dorsilexion movement was documented using a selective motor control scale described by Boyd & Graham7 and Graham et al.14.
he test-retest reliability of all the clinical parameters and the GMFM and PEDI tests was determined prior to data collec-tion, in a group of ive children with CP, resulting in intra-class correlation indices (ICC) with magnitudes greater than 0.83 for all measurements.
he parents of children who had been prescribed BTA and had attended the rehabilitation program of a philanthropic institution were contacted and informed about the objectives of the study. hose who agreed to voluntary participation by their children were informed about the technical procedures and asked to sign a consent form.
he Universidade Federal de Minas Gerais (UFMG) Ethics Review Committee approved the present study in May 2002 (ETIC 063/02).
Statistical analyses
A. Preliminary analyses
Diferences in the children’s gain scores following BTA injection (three and six months afterwards) regarding func-tional skills mobility and independence of mobility (PEDI), and regarding motor skills (GMFM), were tested using Wilcoxon tests because normal distribution was not observed. he gain scores were obtained by subtracting the scores before applica-tion from the three and six-month scores, respectively.
Each participant’s scores three and six months after injec-tion were subtracted from the scores obtained prior to BTA application. his resulted in diferent scores on the caregiver assistance mobility scale of the PEDI (PEDI-CA), three months and six months after BTA application, gains in functional mo-tor skills (PEDI-FS) and gains in the standing and walking/run-ning/jumping dimensions of the GMFM test.
he dependent variables describing the children’s gains in functional motor skills three and six months after BTA ap-plication consisted of combined variables resulting from the sum of the diference scores from the PEDI-FS and GMFM
tests. hese variables were irst normalized through transfor-mation into z scores and then further combined, resulting in two composite variables that represented standardized gains in the children’s functional performance, three months (GM-FM-PEDI-FS/3) and six months (GMFM-PEDI-FS/6) after BTA injection. Normalization was necessary because of dif-ferences in the measurement units of the GMFM (percentile) and PEDI (integer) scores.
Cluster analysis deined cutof points and separated the sample into two groups: responsive and unresponsive, accord-ing to the magnitude of the changes observed in the functional variables, three and six months after BTA. he cutof points were: z=-0.9 for the gain in functional motor skills at three and six months, and z=3.0 for the gain in independence of mobil-ity, at three and six months. he responsive group included the children who showed changes of greater magnitude in the dependent variables described above, compared with the un-responsive group.
B. Predictive models
he predictive models were developed using Classiication and Regression Tree (CART) analyses. CART is a nonparamet-ric, multivariate statistical method that develops a decision tree that is a graphic representation of the association between independent variables and a dichotomous dependent variable, thus deining favorable and unfavorable outcomes16,17.
he analysis began by growing a large tree, by means of a series of binary divisions, such that the independent variable in the upper divisions represented greater predictive power than in the variables selected in the lower tree diagram. Divisions are performed successively until there is a minimum number of cases in each division ( ive for the present study), thus re-sulting in a terminal node16,17. Only the predictive variables that
were more informative of favorable and unfavorable outcomes were chosen in each model. he model also identiied cutof points for each selected independent variable that better clas-siied the sample into dichotomous outcomes. he interactions between independent variables could be seen in the structure of the inal model. he CART models were developed using the S-plus 2000 software for Windows, and SPSS v.11.0 was used for the preliminary analyses.
Four predictive models were developed: two models three months after BTA injection and two models six months after BTA injection. hese models were constructed from 11 predic-tive variables including the children’s ages, topographic distri-bution of CP, severity of CP and number of BTA applications; clinical assessment parameters such as selective ankle control, gait quality (PRS), dynamic length of calf muscles (R1), static length of calf muscles (R2), ankle range of motion (R2-R1) and spasticity of the calf (Ashworth); and the baseline score (before
application) for each dependent variable. Since the children’s lower limbs were evaluated separately, the results from the right and left limbs were used for bilateral BTA application. For the children who received the application in one limb, this information alone was included in the models. he signiicance level was set at α=0.05.
Results
Participants and procedure
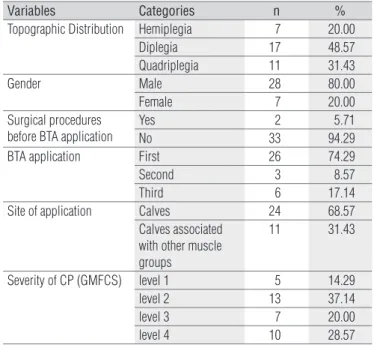
he descriptive information on the sample is presented in Table 1.
Statistical analyses
A. Preliminary analyses
Pearson’s correlation coeicients indicated a strong and sig-niicant association between the raw scores obtained from the GMFM and PEDI-FS tests and the scores from the combined variable (GMFM-PEDI-FS), both three months (rGMFM=0.817,
p=0.0001; rPEDIFS=0.819, p=0.0001) and six months (rGMFM=0.927, p=0.0001; rPEDIFS=0.849, p=0.0001), after BTA application.
Signiicant gains in functional motor skills were observed, both three months (p<0.003, mean efect size d=0.21) and six months (p<0.001, mean d=0.34) after BTA administration.
B. Predictive models
Figures 1-4 show the four predictive models. he responsive and unresponsive terminal nodes were distinguished according to the mean values obtained for the dependent variable, among the children placed at the node, and also considering the cutof score deined for separating participants. In order to facilitate identiication of the most responsive and unresponsive children in each tree, the representative terminal nodes for each dichoto-mous outcome were highlighted from the others, thus suggest-ing paths that are predominantly responsive and unresponsive.
In the irst two models, predictive variables associated with gains in functional motor skills, three and six months after BTA application were selected. In model 1, the children classiied as responsive with greater magnitudes of gain were mainly those younger than 4 years and 6 months and with better gait quality prior to BTA injection (PRS score greater than 3.5). In this model, the less responsive children (smaller gains in the outcome variable) were those older than 4 years and 6 months and with relatively low functional motor skills prior to BTA injection (z smaller than -1.3). Considering that the GMFM-PEDI-FS is a composite variable, including information from two distinct functional tests, the translation of this cutof point
Variables Categories n %
Topographic Distribution Hemiplegia 7 20.00
Diplegia 17 48.57
Quadriplegia 11 31.43
Gender Male 28 80.00
Female 7 20.00
Surgical procedures before BTA application
Yes 2 5.71
No 33 94.29
BTA application First 26 74.29
Second 3 8.57
Third 6 17.14
Site of application Calves 24 68.57
Calves associated with other muscle groups
11 31.43
Severity of CP (GMFCS) level 1 5 14.29
level 2 13 37.14
level 3 7 20.00
level 4 10 28.57
Table 1. Descriptive information on the sample.
(z score) into scores from each test is clinically important. Prior to BTA injections, children who scored up to 11% in the GMFM and had raw scores lower than 17 in the PEDI, were identiied at the unresponsive nodes.
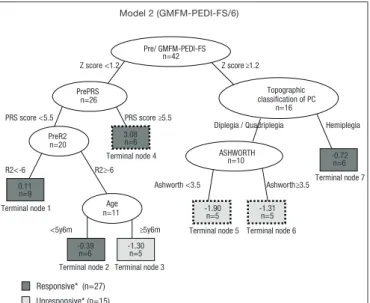
Six months after BTA application (model 2), the most responsive children were those with poorer functional mo-tor skills (z<1.2) and better gait quality, prior to the injection. In this model, the children with smaller gains showed better functional motor skills prior to the injection (z≥1.2) and were of CP type diplegia or quadriplegia. his cutof point (z<1.2) corresponds to children who scored up to 50% in the GMFM and lower than 33 in the PEDI functional mobility scale, prior to BTA. In this model, the unresponsive children were those who had GMFM >60% and PEDI raw scores >22, before the injections.
he third and fourth models illustrate the predictive vari-ables signiicantly associated with gains in independence of mobility, three and six months after BTA administration. hree months after injection (model 3), greater gains were observed in the children who had been less independent prior to appli-cation and who had just received at least their third appliappli-cation of BTA. he children classiied as less responsive in this model were older than four years and six months, had been more independent in mobility prior to the injection and had shown poorer gait quality prior to BTA.
Finally, six months after BTA injection (model 4), the children who showed greater gains in independence of mobility were also relatively less independent prior to BTA and had just received at least their third injection. he less responsive children in this model were mainly the children older than four years and six months who had been more independent in mobility prior to TBA and who had just received at least their second TBA injection.
Figure 2. Predictive model for gain in functional motor skills, six months after BTA application (R2=0.83, p<0.05).
Model 2 (GMFM-PEDI-FS/6)
Responsive* (n=27)
Unresponsive* (n=15)
-1.30 n=5
-1.31 n=5
Terminal node 2 Terminal node 3
-1.90 n=5 Terminal node 1
Terminal node 4
Terminal node 6
Terminal node 7
-0.39 n=6
Z score ≥1.2 Z score <1.2
Pre/ GMFM-PEDI-FS n=42
PRS score <5.5 PRS score ≥5.5
R2≥-6 3.08 n=6 PrePRS n=26 Hemiplegia Diplegia / Quadriplegia
Ashworth ≥3.5 Ashworth <3.5 ≥5y6m <5y6m R2<-6 ASHWORTH
n=10 -0.72 n=6 PreR2 n=20 Age n=11 0.11 n=9
Terminal node 5
Topographic classification of PC
n=16
GMFM-PEDI-FS/6=gain in functional motor skills, six months after BTA ap-plication (combined variable); Topographic distribution of CP: hemiplegia, diplegia, quadriplegia; Pre R2=static muscle length, evaluated pre-application; Pre-Ashworth=children’s calf spasticity, evaluated pre-application; Age=chronological age in years and months; PrePRS=pre-application gait quality (modified version of the PRS observational gait scale); Pre/GMFM-PEDI-FS=pre-application functional motor skills (combined variable).
* The cutoff score for separation of sample into responsive and unresponsive groups in this model was z=-0.9. Terminal nodes illustrating the most responsive and unresponsive children are highlighted with dashed lines.
Model 3 (PEDI-CA/3)
Responsive* (n=25) Unresponsive* (n=24)
Terminal node 4 10.33
n=6 6.40
n=5
Terminal node 2
Terminal node 1 Terminal node 5
Terminal node 7 Terminal node 8 Terminal node 3
3.22 n=9
Terminal node 6 PEDI score ≥12.5 PEDI score <12.5
PRS score ≥5 ≥4y6m <4y6m
PRS score <5 BTA application <2 BTA application ≥2
Pre/PEDI-CA n=49 Number of BTA
applications
n=22 Age <4y6m
n=27
PrePRS n=18
PRS score ≥1 PRS score <1
R2< -6 R2≥-6
R2-R1<12.5 R2-R1≥12.5 PrePRS
n=11
1.71 n=7 -1.33 n=6
PreR2-R1 n=13 PreR2 n=16 1.33 n=6 4.00 n=5 -3.40 n=5
Figure 3. Predictive model for gain in independence of mobility, three months after BTA application (R2=0.72, p<0.05).
PEDI-CA/3 = gain in independence of mobility, three months after BTA application (PEDI caregiver assistance in mobility scale); Pre/PEDI-CA=pre-application inde-pendence of mobility; Age=chronological age in years and months; Pre PRS=pre-application gait quality (modified version of the PRS observational gait scale); Pre R2=static muscle length, evaluated before BTA application; Pre R2-R1=ankle range of motion before BTA application, which is the difference between static (R2) and dynamic (R1) muscle lengths.
* The cutoff score for separation of sample into responsive and unresponsive groups in this model was z=3.0. Terminal nodes illustrating the most responsive and unres-ponsive children are highlighted with dashed lines.
Model 4 (PEDI-CA/6)
Responsive* (n=29) Unresponsive* (n=18)
Terminal node 1
Terminal node 6
Terminal node 7 Terminal node 2
Terminal node 3
Terminal node 5 PEDI score ≥12.5 PEDI score <12.5
≥4y6m <4y6m
BTA application <2 BTA application ≥ 2
BTA application <1.5 BTA application ≥1.5
PEDI score ≥27 PEDI score <27
R2-R1<11.5 R2-R1 ≥11.5
Pre/PEDI-CA n=47
Age n=27
Number of BTA applications n=18 6.60 n=5 -1.85 n=7 2.20
n=5 0.66 n=6 Pre/PEDI-CA
n=11 4.66
n=9 Number of BTA applications
n=20 PreR2-R1 n=14 13.33 n=6 3.00 n=9
Terminal node 4
Figure 4. Predictive model for gain in independence of mobility, six months after BTA application (R2=0.72, p<0.05).
PEDI-CA/6=gain in independence of mobility, six months after BTA application; Pre/PEDI-CA=pre-application independence of mobility; Age=chronological age in years and months; Pre R2-R1=ankle range of motion before BTA application, which is the difference between static (R2) and dynamic (R1) muscle lengths. * The cutoff score for separation of sample into responsive and unresponsive groups in this model was z=3.0. Terminal nodes illustrating the most responsive and unresponsive children are highlighted with dashed lines.
Figure 1. Predictive model for gain in functional motor skills, three months after BTA application (R2=0.58, p<0.05).
Model 1 (GMFM-PEDI-FS/3)
Responsive* Unresponsive* (n=8) -0.12 n=10 2.48 n=7 -0.99 n=8 n=10 0.51 Terminal node 1 Terminal node 2
Terminal node 3 Terminal node 5
≥4y6m <4y6m
PRS score ≥3.5 PRS score <3.5
Z score ≥2.4 Z score <2.4
PrePRS n=17 Age n=47 Pre/GMFM-PEDI-FS n=30
Z score < -1.3 Z score ≥ -1.3 Pre/ GMFM-PEDI-FS
n=18
<5y6m ≥5y6m
-0.65 n=6 Age n=12 -0.18 n=6
Terminal node 4 Terminal node 6
GMFM-PEDI-FS/3=gain in functional motor skills, three months after BTA ap-plication (combined variable); Age=chronological age in years and months; Pre-PRS=pre-application gait quality (modified version of the PRS observational gait scale); Pre/GMFM-PEDI-FS=pre-application functional motor skills (combined variable).
* The cutoff score for separation of sample into responsive and unresponsive groups in this model was z=-0.9. Terminal nodes illustrating the most responsive and unresponsive children are highlighted with dashed lines.
Discussion
he results from this study indicate that variables relat-ing to children’s functionrelat-ing are stronger predictors of gains in functional mobility than are variables giving information on neuromuscular-skeletal structures and functions, such as range of motion or spasticity. hus, variables relating to the functional performance of the child (skills and indepen-dence) and gait quality appeared in a hierarchically superior position in the predictive models. Similar results have also been observed in other studies18,19. Abel et al.18 identiied a
weak association between musculoskeletal parameters (such as spasticity and joint range of motion) and functional perfor-mance, using the standardized GMFM test. According to those authors, children with CP who had greater ankle dorsilexion range of motion presented lower functional performance than did children with greater limitation in this joint motion, thus indicating that the presence of restrictions on joint range of motion did not necessarily result in detriment to their mo-tor function. Chicoine et al.19 also found that among children
with spastic CP who were evaluated before selective dorsal rhizotomy surgery, gait quality was of higher predictive value for post-intervention gait improvements than the ability to perform isolated ankle dorsilexion movements. Evidence in the literature, along with the results from the present study, illustrates the lack of causal relationship between the pres-ence of musculoskeletal abnormalities in the lower limbs and mobility functional performance among children with CP.
Children with less independence of mobility and a smaller repertoire of motor skills before BTA application were identiied as most responsive (models 2, 3 and 4). hese results suggest that children with lower levels of functioning prior to the injec-tion tend to demonstrate greater gains three and six months after administration of the medication. Fattal-Valevski et al.20
also demonstrated that children with lower pre-application GMFM scores were more responsive four months after BTA application20. Similarly, the results from the present study
dem-onstrated that children with more limited motor skills prior to BTA application exhibited greater responsiveness in functional mobility gains, after injection.
Age was consistently selected in all predictive models, with a cutof point of 4 years and 6 months, separating the chil-dren into responsive and unresponsive groups. he chilchil-dren under the age of 4 years and 6 months, in association with other predictive variables, were among the most responsive in relation to both gains in mobility skills and gains in inde-pendence of mobility after BTA application. here is no con-sensus regarding the association between age and response to BTA application. Indeed, age per se cannot be a primary indicator of BTA application prognosis8. Some authors have
suggested that BTA should be applied to very young children with CP before the appearance of the ixed deformities that are often corrected through surgical procedures2,21-23. Our
pre-dictive models established a cutof of 4 years and 6 months as predictive of mobility gain; however, the age cutofs suggested in other studies on BTA application were 1 year and 6 months to 3 years and 6 months greater2,21,24. he discrepancy in the
suggested age between studies may be related to diferences in outcome focus. he outcome most frequently investigated in other studies was improvement in gait quality, i.e. the simi-larity in gait characteristics between children with CP and typical children. Younger children may present a repertoire of motor skills and independence of mobility that is considered satisfactory, despite gait characteristics that are not close to those of normal children. his result illustrates the diference between clinical outcomes centering on functionality and outcomes focusing on normality.
Gait quality, associated with younger age and lower pre-application functionality, characterized the children who were more responsive towards motor skills gains. Three months after application, the children who presented greater gains were those with more than 3.5 points on the PRS and those who were younger than four years and six months. Six months after application, the most responsive children were those who obtained more than 5.5 points on the PRS but had lower pre-application functionality, i.e. they could only perform a smaller number of motor activities on the GMFM and PEDI functional skill scales. These results indicate that the children who had greater gains in motor skills three and six months after BTA application had less equinus in their gait, but could not accomplish many mo-bility functional activities before BTA application. These results indicate that gait quality assessment prior to BTA application may predict positive results in mobility perfor-mance three and six months after the procedure. Mackey et al.23 compared inter and intra-examiner reliability and the
validity of the modified version of the PRS with a three-di-mensional gait analysis system (gold standard). The results indicated adequate validity indices between the modified PRS and three-dimensional gait analysis system, as well as adequate consistency in administering the modified PRS, which supports its use among children with CP who will undergo BTA application.
All participants in the present study attended physical therapy sessions and used orthoses. Both of these interven-tions were controlled with regards to the frequency and type (physical therapy treatment) and time of use (orthoses). It is important to point out that the observed gains are probably a consequence of the association of these interventions, in-cluding not only the efects of the BTA, but also the physical
therapy protocol and systematic use of orthoses. It is possible that this therapeutic combination enabled greater gains in motor function and independence of mobility. Future inves-tigations should analyze the individual functional efects of each intervention.
he clinical relevance of the results relies on both the sta-tistical model and the predictor variables. he CART analysis developed a decision rule directed at the individual and not at a group of participants. he predictive variables represented clinical parameters frequently observed in evaluating children with CP prior to the application of BTA. Finally, the outcomes
represent functional information considered important to the child and family, thus addressing aspects of their daily routine within a relevant context.
Acknowledgements
his study received support in the form of grants and research scholarships from the Conselho Nacional de Desenvolvimento Cientíico e Tecnológico (CNPq) and the Fundação de Amparo à Pesquisa do Estado de Minas Gerais (FAPEMIG), Brazil.
1. Love SC, Valentine JP, Blair EM, Price CJ, Cole JH, Chauvel PJ. The effect of botulinum toxin type A on the functional ability of the child with spastic hemiplegia a randomized controlled trial. Eur J Neurol. 2001;8Suppl5:S50-8.
2. Ubhi T, Bhakta BB, Ives HL, Allgar V, Roussounis SH. Randomized double blind placebo controlled trial of the effect of botulinum toxin on walking in cerebral palsy. Arch Dis Child. 2000;83(6):481-7.
3. Massin M, Allington N. Role of exercise testing in the functional assessment of cerebral palsy after botulinum toxin A injection. J Pediatr Orthop. 1999;19(3):362-5.
4. Childers MK, Stacy M, Cooke DL, Stonnington HH. Comparison of two injections techniques using botulinum toxin in spastic hemiplegia. Am J Phys Med Rehabil. 1996;75(6):462-9.
5. Ade-Hall RA, Moore A. Botulinum toxin type A in the treatment of lower spasticity in cerebral palsy. Chichester: John Wiley & Sons; 2003.
6. Tilton AH. Approach to the rehabilitation on spasticity and neuromuscular disorders in children. Neurol Clin. 2003;21(4):853-81, vii.
7. Boyd RN, Graham HK. Objective Measurement of clinical findings in the use of botulinum toxin type A for the management of children with cerebral palsy. Eur J Neurol. 1999;6(4):23-35.
8. Eames NW, Baker R, Hill N, Graham K, Taylor T, Cosgrove A. The effect of botulinum toxin A on gastrocnemius length: magnitude and duration of response. Dev Med Child Neurol. 1999;41(4):226-32.
9. Rousseaux M, Compère S, Launay M, Kozlowski O. Variability and predictability of functional efficacy of botulinum toxin injection in leg spastic muscles. J Neurol Sci. 2005;232(1-2):51-7.
10. Fehlings D, Rang M, Glazier J, Steele C. Botulinum toxin type A injections in the spastic upper extremity of children with hemiplegia: child characteristics that predict a positive outcome. Eur J Neurol. 2001;8Suppl5:S145-9.
11. Palisano R, Rosebaum P, Walter S, Russeall D, Wood ED, Galuppi B. Development and reliability of a system to classify gross motor function in children with cerebral palsy. Dev Med Child Neurol. 1997;39(4):214-23.
12. Russell DJ, Rosembaum PL, Gowland C, Avery LM, Lane M. Gross Motor Function Measure (GMFM-66 & GMFM-88) User’s Manual. Clinics in Developmental Medicine. London: Mac Keith Press; 2002.
13. Haley SM, Coster WJ, Ludlow LH, Haltiwanger JT, Andrellos PJ. Pediatric Evaluation of disability inventory (PEDI) version 1.0. Development, standardization and administration manual. Boston: Trustees of Boston University, Health and Disability Research Institute; 1992.
14. Graham HK, Aoki KR, Autti-Rämö I, Boyd RN, Delgado MR, Gaebler-Spira DJ, et al. Recommendations for the use of botulinum toxin type A in the management of cerebral palsy. Gait Posture. 2000;11(11):67-79.
15. Bohannon RW, Smith MB. Interrater reliability of a modified Ashworth scale of muscle spasticity. Phys Ther. 1987;67(2):206-7.
16. Falconer JA, Nayghton BJ, Dunlop DD, Roth EJ, Strasser DC, Sinacore JM. Predicting stroke in patient rehabilitation outcome using a classification tree approach. Arch Phys Med Rehabil. 1994;75(6):619-25.
17. Mancini MC, Coster WJ, Trombly CA, Heeren TC. Predicting elementary school participation in children with disabilities. Arch Phys Med Rehabil. 2000;81(3):339-47.
18. Abel MF, Damiano DL, Blanco JS, Conaway M, Miller F, Dabney K, et al. Relationships among musculoskeletal impairment and functional health status in ambulatory cerebral palsy. J Pediatr Orthop. 2003;23(4):535-41.
19. Chicoine MR, Park TS, Volgler GP, Kaufman BA. Predictors of ability to walk after selective dorsal rhizotomy in children with cerebral palsy. Neurosurgery. 1996;38(4):711-4.
20. Fattal-Valevski A, Giladi N, Domanievitz D, Zuk L, Masterman R, Harel S, et al. Parameters for predicting favorable responses to botulinum toxin in children with cerebral palsy. J Child Neurol, 2002;17(4):272-7.
50
21. Mackey M, Walt S, Stott NS. Botulinum toxin type A in ambulant children with cerebral palsy. Physiotherapy. 2003;89:219-32.
22. Graham HK. Botulinum toxin type A management of spasticity in the context of orthopaedic surgery for children with spastic cerebral palsy. Eur J Neurol. 2001;8Suppl5:S30-9.
23. Mackey AH, Lobb GL, Walt SE, Stott NS. Reliability and validity of the observational gait scale in children with spastic diplegia. Dev Med Child Neurol. 2003;45(1):4-11.
24. Flett PJ. Rehabilitation of spasticity and related problems in childhood cerebral palsy. J Paediatr Child Health. 2003;39(1):6-14.