Article
*e-mail: [email protected]
A Novel Disposable Electrochemical Microcell: Construction and Characterization
Humberto E. A. Ferreira,a Daniela Daniel,b Mauro Bertottib and Eduardo M. Richter*,a
aInstituto de Química, Universidade Federal de Uberlândia, Av. João Naves de Ávila, 2121,
38400-902Uberlândia-MG, Brazil
bInstituto de Química, Universidade de São Paulo, Av. Prof. Lineu Prestes, 748, 05508-900 São Paulo-SP, Brazil
Este trabalho apresenta uma técnica alternativa de microfabricação para construção de microcélulas eletroquímicas descartáveis contendo os eletrodos de trabalho, auxiliar e de referência em um único dispositivo. Trata-se de um processo simples no qual a termo-transferência de máscaras de toner sobre superfícies de ouro obtidas a partir de discos compactos graváveis (CD-R) definem o formato dos eletrodos (contornos). Numa etapa seguinte, o formato é manualmente coberto com tinta usando uma caneta de retroprojetor. A superfície de ouro não protegida pela tinta é convenientemente removida (corrosão química) e a tinta, por sua vez, é facilmente removida com etanol gerando superfícies de ouro sem contaminação. A área final e reprodutível dos eletrodos é definida pela termo-transferência de uma segunda máscara de toner. O eletrodo de referência é obtido por meio de uma deposição manual de cola de prata sobre uma banda de ouro. As microcélulas foram eletroquimicamente caracterizadas usando as técnicas de voltametria cíclica, voltametria linear e voltametria de onda quadrada e várias espécies eletroativas como sistemas modelo. A reprodutibilidade de área dos eletrodos para diferentes microcélulas foi estudada e um desvio-padrão relativo melhor do que 1,0% foi obtido. As microcélulas descartáveis foram usadas com sucesso para a análise de amostras em volumes menores que 200 µL demonstrando boa estabilidade e reprodutibilidade (RSD menor que 2,0%). Essas microcélulas também foram avaliadas para a quantificação de paracetamol e dipirona em formulações farmacêuticas.
An alternative technique for the fabrication of disposable electrochemical microcells containing working, reference and auxiliary electrodes on a single device is reported. The procedure is based on thermal-transfer of toner masks onto CD-R (recordable compact discs) gold surfaces to define the layout of the electrodes (contour). In a subsequent step, the layout is manually painted with a permanent marker pen. The unprotected gold surface is conveniently etched (chemical corrosion) and the ink is then easily removed with ethanol, generating gold surfaces without contamination. The final and reproducible area of the electrodes is defined by heat transference of a second toner mask. Silver epoxy is deposited on one of the gold bands which is the satisfactorily used as reference electrode. These microcells were electrochemically characterized by cyclic, linear, and square wave voltammetry, and several electroactive species were used as model systems. The area reproducibility of the electrodes for different microcells was studied and a relative standard deviation better than 1,0% (n = 10) was obtained. Disposable electrochemical microcells were successfully used in analysis of liquid samples with volumes lower than 200 µL and good stability and reproducibility (RSD less than 2.0%) were achieved. These microcells were also evaluated for quantification of paracetamol and dipyrone in pharmaceutical formulations.
Keywords: disposableelectrochemicalmicrocell, microfabrication, microvolumes analysis, CD-trode
Introduction
Several factors are stimulating the miniaturization of analytical instrumentation such as low consumption of energy, space, samples and reagents, as well waste
for the success1 especially because of its versatility, i.e.,
application in environmental, pharmaceutical, forensic, clinical and industrial areas.
The mercury drop electrode (MDE) was the first
disposable electrode used in electrochemical experiments.2
However, the metal is toxic, its surface cannot be easily modified and applications in anodic processes are restricted. These features have contributed for its gradual substitution for solid electrodes. Currently, numerous research groups are attempting to replace mercury by modified solid surfaces based on platinum, gold and various forms of carbon.
Screen-printing technology is widely used for mass
production of disposable electrochemical sensors.3,4 The
most known is the glucose sensor, which still dominates
the blood glucose market.5 Screen-printed electrodes
(SPE) are characterized by low unit cost, high precision, and a wide range of designs (either as arrays or as single electrodes) and can be used as whole electrode systems (reference, working, and counter electrode), maintaining
adequate reproducibility.6-8 The main advantage of SPE
over conventional electrodes is that problems associated with carry-over and surface fouling are avoided as they are
normally used only once and then discarded,9,10 whereas
conventional solid electrodes usually depend on very reproducible manual polishing procedures.
Printing inks used for preparation of screen-printed carbon electrodes (SPCE) contain mineral binder, solvent and conductive carbon material. It is known that some components can strongly influence the electrochemical properties of the electrode substrate, as changes in the electron transfer resistance. Various studies have addressed the problem of low electrochemical reactivity when some commercial inks are used and several pre-treatment procedures are suggested to improve significantly the
electrochemical behavior.11-13 The modification of the
SPCE surface by metal or specific films has been also reported as an attempt to enhance the electron transfer
reaction at the electrode/solution interface.14-18 In fact,
patterned electrodes as SPE with gold or platinum films, denominated Ceramic Patterned Electrodes, can be acquired
commercially at 30 dollars each.19 Homemade disposable
sensors with gold, silver or platinum films can also be constructed by sputtering the metal in the surface of a
convenient substrate.20-24 The quality of the deposited metal
film depends on factors such as the use of clean rooms, previous deposit of another material for better adhesion and appropriate pressure control. However, sputtering coating equipments and clean rooms are usually not available in a common analytical laboratory and a simpler approach would be highly desirable.
Gold films can be inexpensively obtained from commercial recordable compact discs (CD-Rs), as proposed
by Angnes et al.25 The so-called Au-CDtrodes exhibit a
gold uniform film due to the efficient CD-R fabrication process, with highly reproducible thickness, orientation and
roughness.26 The literature has reported their application in
batch and flow cells, at bare or modified surfaces.27-35
In this paper a simple, low cost and quick method to produce an electrochemical microcell is described, where gold is used as working and auxiliary electrodes and silver glue manually deposited on the gold surface is used as reference electrode. Accordingly, new routes for the fabrication of disposable electrochemical microcells and screen printed sensors in the absence of sophisticated laboratory infrastructure are envisaged. The possibility of analyte detection (sample volumes around 100-200 µL) with the proposed microcell using the standard addition method is demonstrated. The characterization of these disposable microcells was carried out by different electrochemical techniques and electroactive species, and the analytical usefulness of the device was demonstrated by determining paracetamol and dipyrone in pharmaceutical formulations.
Experimental
Chemicals and materials
All reagents were of analytical grade or better and were used without further purification procedures. Solutions were prepared with deionized water processed through a water purification system (Milli-Q plus, Millipore). Polycarbonate bases sputtered with a thin gold layer
(ca. 80 nm) were obtained from recordable compact discs
(Mitsui/USA). After stripping of the polymeric protection
layer from the disc with concentrated HNO3 solution and
washing with distilled water, the Au-CDtrode is ready for use, no further pretreatment being necessary. Etching of the gold layer from the CD surface was carried out with a
solution containing 25 g L-1 iodine and 100 g L-1 iodide.
Ethanol or isopropanol solutions were used to remove the ink of the permanent marker pen, which was used to create a permanent writing on the gold surface and to avoid the chemical attack by the iodine/iodide solution. The analyte quantification in pharmaceutical preparations was carried out by dissolving a crushed and powdered tablet for further dilution in 100 mL of deionized water. Aliquots of the stock solution (5 or 10 µL) were conveniently diluted in 200 µL
of 0.10 mol L-1 NaAc/HAc buffer solution in the microcell
Instrumentation
The electrochemical experiments were performed using an Autolab PGSTAT 20 (Eco Chimie, Utrecht, the Netherlands) connected to a Pentium 200-MHz computer.
The toner masks were drawn using the PowerPoint® or
CorelDRAW® software. An HP LaserJet 1160 series printer
was utilized to print the toner masks. A thermal press, model Prima (Ferragini, São Carlos, SP, Brazil) adjusted to
110/120 oC was used as a toner fuser to transfer the masks
from the wax paper to the gold surface.
Fabrication procedure of the disposable electrochemical microcell
The microcells are constituted of three planar electrode
strips, i.e., gold as working and auxiliary electrodes and
silver glue onto gold as pseudo-reference electrode. Toner masks have been used by our group to protect the
gold surface during the etching step,29, 35 and they are
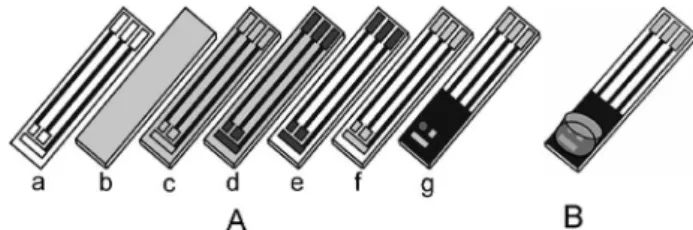
then removed in the final step with the help of a cotton swab soaked with acetonitrile by scrubbing with soft fast movements to avoid attack on the exposed polycarbonate areas or the gold surface. A long exposition time of the CD with acetonitrile can generate contamination problems in the gold surface and deformation of the polycarbonate base. Additionally, this procedure is extremely dependent on the ability of the operator. Hence, a new approach has been proposed and it involves a manual painting of the areas previously delimited with toner masks with a permanent marker. The removal of the ink (after the etching step) is easily accomplished with ethanol or isopropanol and avoids the mentioned problems. Figure 1A presents the steps involved in the construction of the microcell and detailed
information is given as follows: Step 1. The layout of the
microcell on a 1:1 scale is drawn using a graphic software
such as CorelDRAW® 7.0 (Corel, Ottawa, Canada), Paint®
or PowerPoint® (Microsoft). This image (mask) is then
printed on a waxed paper (the same type used as support for adhesive labels paper) using an HP LaserJet 1160;
Step 2. By using a scissors, a piece (1 × 2 cm) of the CD-R is cut after removal of the protective film with concentrated
nitric acid; Step 3. The toner mask is heat-transferred to the
gold layer by sandwiching both materials for 90 seconds in
the thermal press heated at 120 oC. The mask defines the
layout of the gold trails that compose the device and the exact location to be covered with the permanent marker;
Step 4. The electrodes and the electric contact are manually painted with the permanent marker. These regions are precisely defined (outlines) in the mask originally drawn
with the graphic software; Step 5. The exposed gold layer
not covered with toner is removed by using an iodine/
iodide solution; Step 6. The ink of the permanent marker is
removed with ethanol or isopropanol; Step 7. The thermal
transference of a second toner mask defines the area of
each electrode, which were 2.3 mm2 (1.5 × 1.5 mm) for
both working and reference electrodes and 4.5 mm2 (1.5 ×
3.0 mm) for the auxiliary electrode. Gold can usually be used as working and auxiliary electrode and in the case of the reference electrode a small amount of silver epoxy or silver glue was manually deposited onto the gold surface. Electrochemical experiments were carried out in a micro-reservoir glued on the device at an appropriate position, as presented in Figure 1B.
The working electrode was cleaned before use by performing ten repetitive cyclic voltammograms at
100 mV s-1 between 0.00 and 0.60 V in a 0.05 mol L-1 HCl
solution.
Results and Discussion
Evaluation of the microcells: reproducibility and stability of the electrodes
The construction of electrodes with reproducible area, by using toner masks and gold surfaces obtained from CD-Rs,
has already been reported26 and preliminary experiments
were carried out to investigate whether this important feature was maintained with the new approach (use of a permanent marker ink). Accordingly, cyclic voltammetric experiments were performed under stationary conditions using ten different electrodes with the same geometric dimension (defined by the second toner mask) to evaluate the inter-assay reproducibility. Cyclic voltammograms were
performed at 0.05 V s-1 between −0.1 and 0.5 V in a solution
containing 2 × 10⁻³ mol L-1 K
4Fe(CN)6 and 0.5 mol L
-1 NaCl
Figure 1. Schematic illustration of the microcell construction in a three coplanar electrode configuration. (A) (a) Toner mask; (b) A piece of CD (1 x 2 cm); (c) Substrate aspect after heat-transfer of the toner mask; (d) Manual painting with permanent marker of the encircled areas delimiting the electrodes and electric contacts; (e) Substrate aspect after gold etching of the exposed areas and; (f) Removal of the ink with ethanol; (g) A second mask is heat-transferred to define the area of the electrodes and silver epoxy is deposited onto the gold surface located on the side of the working electrode, which will be used as reference electrode. (B)
and the calculated relative standard deviation (RSD) for peak current measurements was lower than 1.0% (n = 10). Experiments were also carried out in order to investigate the reproducibility of the analytical signal after chemical modification of the gold working electrode with a tungsten
oxide film,36 as presented in Figure 2. Layers of this
material are very efficient as O-atom transfer species as
already reported in the electrocatalytic reduction of iodate.36
Cyclic voltammograms performed at 0.05 V s-1 between
+0.50 and −0.80 V in the absence (---) and presence (—)
of 5 × 10⁻³ mol L-1 KIO
3 in 0.05 mol L
-1 H
2SO4 with five
independent electrodes presented RSD values for the cathodic peak of only 1.2% (n = 5), demonstrating that both processes (fabrication of the electrode and electrodeposition of tungsten oxide) are very reproducible.
The proposed fabrication method offers a complete three-electrode cell on a single surface. However, as the potential at a noble metal-electrolyte interface is not stable, gold is not adequate to be used as a pseudo-reference electrode and this was confirmed in cyclic voltammetric experiments conducted in different supporting electrolyte solutions (KCl, and acetate and phosphate buffers) using ferrocyanide as model electroactive species, where a
variation of the half-wave potential (E½) and a continuous
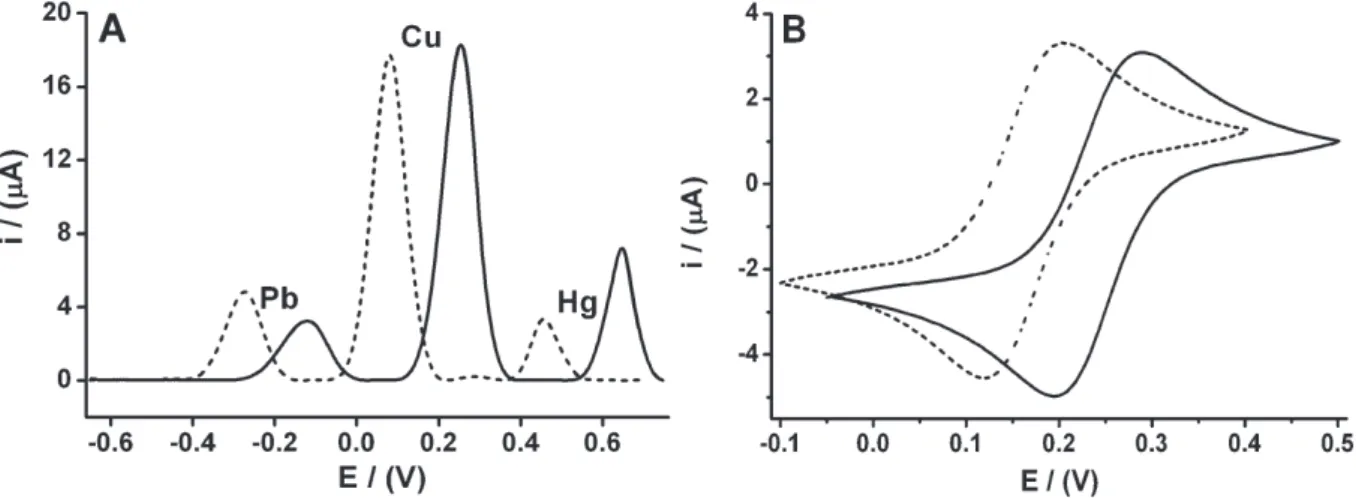
reduction of sensitivity were observed. This problem was circumvented by depositing a small amount of silver epoxy onto the gold band reference electrode (there is no need to cover the gold surface completely). Figure 3 shows a comparison among the electrochemical responses for square wave anodic stripping voltammetric experiments in solutions containing Pb(II), Cu(II) and Hg(II) (400 ppb in
0.10 mol L-1 NaAc/HAc solution) using both a commercial
reference electrode (Ag/AgCl) and the proposed pseudo-reference electrode (gold surface after deposition of silver glue). Results of similar cyclic voltammetric experiments
with K4Fe(CN)6 in 0.50 mol L-1 NaCl solution are also
shown in Figure 3. Peak potential changes upon variation of the reference electrode are summarized in Table 1, where additional data regarding similar experiments (not shown) performed with paracetamol, ascorbic acid and
K4Fe(CN)6 in other supporting electrolyte solutions were
also included. The difference between peak potential values comparing both reference electrodes varied in a small range from 80 to 190 mV. The stability of the potential of the pseudo-reference electrode was also studied by monitoring its potential over four hours in three different supporting
electrolytes: 0.1 mol L-1 phosphate buffer solution
(pH = 7.2), 0.2 mol L-1 Na
2SO4 solution and 0.1 mol L
-1 KCl
Figure 2. Cyclic voltammograms recorded with 5 independent microcells
after electrodeposition of tungsten oxide: (a) in 0.05 mol L-1 H
2SO4
solution and (b) in 0.05 mol L-1 H
2SO4 + 5.0 × 10
-3 mol L-1 KIO 3 solution.
Scan rate: 50 mV s-1; Relative Standard Deviation for the cathodic current
peaks: 1.2% (n = 5).
Figure 3. Comparison between electrochemical responses obtained using a commercial reference electrode (solid line) and a gold band after deposition
of silver epoxy (pseudo-reference electrode) (dotted line). (A) Square wave anodic stripping voltammograms for a solution contained Pb(II), Cu(II) and Hg(II), 400 ppb each in 0.10 mol L-1 NaAc/HAc buffer. (B) Cyclic voltammograms recorded in a 5.0 × 10⁻³ mol L-1 K
4Fe(CN)6 + 0.50 mol L -1 NaCl
solution. Measurements were carried out versus an aged commercial Ag/AgCl reference electrode and the potential difference between both electrodes generally stabilized quickly with values within ± 5 mV for all evaluated period and supporting electrolytes.
Evaluation of the microcells: sample volume
As an attempt to investigate the minimum sample volume necessary for analytical determinations, square wave voltammograms for increasing concentrations (1 to
5 × 10⁻³ mol L-1) of K
4Fe(CN)6 in 0.10 mol L
-1 NaAc/HAc
buffer solution (pH = 4.7) were recorded. Figure 4 shows results of such experiments where a volume of 100 µL was used for recording voltammograms. After each analysis, the microcell was cleaned, and a new standard solution was added. The straight line obtained in this experiment demonstrates that the proposed device is appropriate for analysis of samples with limited availability.
In order to evaluate the feasibility of performing standard addition experiments with the fabricated
microcell, a typical experiment involving paracetamol was carried out. Cyclic voltammograms of a 100 µL sample
containing 0.33 × 10⁻³ mol L-1 paracetamol in 0.10 mol L-1
NaAc/HAc buffer solution were recorded before and after successive additions of 2 µL of paracetamol standard solution, as shown in Figure 5A. The homogenization was achieved using an automatic pipette (100 µL) and subsequent reintroduction of the resulting solution into the reservoir. The total volume of generated waste in this experiment was 116 µL. Despite the small spiked volumes, the analytical curve presented good linearity (r = 0.999). Figure 5B presents similar information for nitrite and the results (r = 0.999) confirm the usefulness of the device to quantify analytes by using the standard addition method.
Analytical applications
The proposed microcell was used for the determination of dipyrone and paracetamol in pharmaceutical preparations. Dipyrone and paracetamol are widely used as analgesic and antipyretic drugs in many pharmaceutical formulations. These compounds are usually administered in the form of coated tablets or as liquid solution for oral ingestion. The use of electroanalytical methods for determination of both drugs presents many advantages because previous extraction is avoided, high sensitivity can be achieved and experiments can be performed with colored samples. The quantification of both analytes was carried out by using the standard addition method.
A sample of dipyrone in the tablet form was prepared as described in the experimental section. A 5 µL sample
aliquot was diluted in 200 µL of 0.1 mol L-1 acetate
buffer solution (pH = 4.7) and the resulting solution was introduced in the microcell. Voltammograms were recorded before and after three additions of dipyrone standard solution. The results shown in Figure 6A allowed a calibration plot with excellent linear regression fit to be found (r = 0.999). A similar experiment was also performed
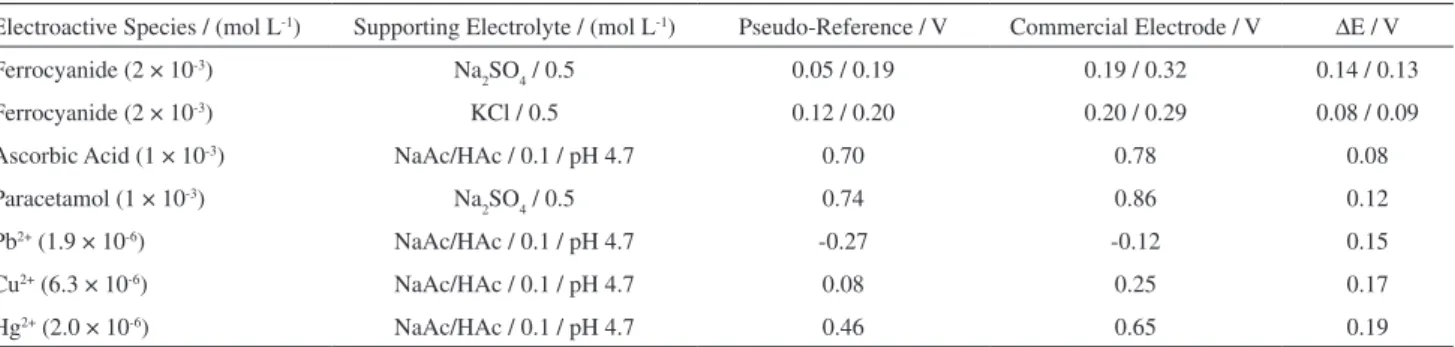
Table 1. Comparison between the peak potential values measured using a conventional reference (Ag/AgCl) and the proposed pseudo-reference electrode
by using square wave anodic stripping voltammetry and cyclic voltammetry for different analytes and electrolytes
Electroactive Species / (mol L-1) Supporting Electrolyte / (mol L-1) Pseudo-Reference / V Commercial Electrode / V ∆E / V
Ferrocyanide (2 × 10⁻³) Na
2SO4 / 0.5 0.05 / 0.19 0.19 / 0.32 0.14 / 0.13
Ferrocyanide (2 × 10⁻³) KCl / 0.5 0.12 / 0.20 0.20 / 0.29 0.08 / 0.09
Ascorbic Acid (1 × 10⁻³) NaAc/HAc / 0.1 / pH 4.7 0.70 0.78 0.08
Paracetamol (1 × 10⁻³) Na
2SO4 / 0.5 0.74 0.86 0.12
Pb2+ (1.9 × 10⁻⁶) NaAc/HAc / 0.1 / pH 4.7 -0.27 -0.12 0.15
Cu2+ (6.3 × 10⁻⁶) NaAc/HAc / 0.1 / pH 4.7 0.08 0.25 0.17
Hg2+ (2.0 × 10⁻⁶) NaAc/HAc / 0.1 / pH 4.7 0.46 0.65 0.19
Figure 4. Square wave voltammograms recorded in 100 µL of increasing
concentrations (1 to 5 × 10⁻³ mol L-1) of K
4Fe(CN)6in 0.10 mol L -1 NaAc/
with paracetamol and the results shown in Figure 6B are also very promising. The data obtained were summarized in Table 2, which also shows results using direct UV absorption
spectrophotometry for paracetamol analysis37 and the
official iodometric titration method for dipyrone analysis.38
The two sets of results are in close agreement and compatible with the nominal value determined by the manufacturer. There was also no significant difference between the values quantified using the proposed microcell and the official methods by the F-test at the 95% confidence level.
Figure 5. Cyclic voltammetric scans: (A) for 100 µL of 0.30 x 10⁻³ mol L-1 ofparacetamol + 0.10 mol L-1 NaAc/HAc buffer solution (pH= 4.7) (a) and
successive additions of 2 µL of a standard solution of paracetamol (b-i: 0.32 to 2.57x10⁻³ mol L-1 concentration range) and (B) for 100 µL of 18.4 x10 -6 mol L-1 nitrite + 0.10 mol L-1 NaAc/HAc buffer solution (pH= 4.7) solution (a) and successive additions of 2 µL of a standard solution of nitrite (b-e: 18.4
to 72.0x10⁻⁶ mol L-1 concentration range). Scan rate = 50 mV s-1. Inset shows the analytical curves.
Figure 6. Linear sweep voltammograms for 200 µL of pharmaceutical samples containing: (A) Blank signal (a), dipyrone sample signal (b) and successive
additions of 5 µL of a standard dypirone solution (c-e); (B) Blank signal (a), paracetamol sample signal (b) and successive additions of 5 µL of a standard paracetamol solution (c-e) (blank signal subtracted in this experiment). Supporting electrolyte: 0.10 mol L-1 NaAc/HAc buffer solution (pH = 4.7); Scan
rate: 50 mV s-1. Inset: Standard addition curves.
Table 2. Determination of dipyrone and paracetamol in pharmaceutical formulations
Medicine Label value / (mg per tablet) Method
This worka (mg per tablet) Referenceb (mg per tablet)
Dipyrone 500 443 ± 5 mg 466 ± 9 mg
Paracetamol 750 733 ± 4 mg 738 ± 11 mg
Conclusions
Toner masks laser printed, a permanent marker and gold CD-Rs are readily available materials and allow the construction of disposable microcells to be performed at any chemical laboratory. The proposed manufacturing process based in the partial substitution of toner masks by permanent marker ink facilitated the electrochemical cleaning of the microcell after its use in electrochemical determinations. In addition, the removal of the ink of the permanent marker with ethanol is a simpler procedure in comparison with previous employed procedures (removal with acetonitrile). Accordingly, the proposed methodology is less dependent on personal ability or performance. An additional innovation in the fabrication process of the disposable microcells from CD-Rs is the insertion of the reference electrode. The silver epoxy used to prepare the pseudo-reference electrode showed to be sufficiently stable under the conditions studied in this work and allowed a microcell with three coplanar electrodes configuration to be constructed.
The presented results clearly demonstrate the appeal of the “painting” processes for voltammetry with small sample volumes (around 100-200 µL). The rapid prototyping of new microcell designs and the development of disposable sensors are issues to be continuously addressed. The good performance obtained in the drug analysis by using the standard addition method indicates that the proposed methodology can be more attractive for the general use of solid electrodes in chemical analysis. This is particularly important when the option is to use the microcell continuously (not in the disposable form).
Acknowledgments
Authors are thankful to FAPEMIG (Fundação de Amparo à Pesquisa do Estado de Minas Gerais) and CNPq (Conselho Nacional de Desenvolvimento Científico e Tecnológico) for the financial support.
References
1. Ehrfeld, W.; Electrochim. Acta2003, 48, 2857.
2. Galus, Z.; Laboratory Techniques in Electroanalytical Chemistry, Kissinger, P. T.; Heineman, W. R., eds.; Marcel Dekker: New York, 1984.
3. Newman, J. D.; White, S. F.; Tothill, I. E.; Turner, A. P. F.;
Anal. Chem.1995, 67, 4594.
4. White, S. F.; Tothill, I. E.; Newman, J. D.; Turner, A. P. F.;
Anal. Chim. Acta1996, 321, 165.
5. Tothill, I. E.; Newman, J. D.; White, S. F.; Turner, A. P. F.;
Enzyme Microb. Technol.1997, 20, 590.
6. Albareda-Sirvent, M.; Merkoci, A.; Alegret, S.; Sens. Actuators, B2000, 69, 153.
7. Hart, J. P.; Crew, A.; Crouch, E.; Honeychurch, K. C.; Pemberton, R. M.; Anal. Lett.2004, 37, 789.
8. Hsu, C. T.; Chung, H. H.; Lyuu, H. J.; Tsai, D. M.; Kumar, A. S.; Zen, J. M.; Anal. Sci.2006, 22, 35.
9. Honeychurch, K. C.; Hart, J. P.; TrAC, Trends Anal. Chem. 2003, 22, 456.
10. Morrin, A.; Killard, A. J.; Smyth, M. R.; Anal. Lett.2003, 36, 2021.
11. Cui, G.; Yoo, J. H.; Lee, J. S.; Yoo, J.; Uhm, J. H.; Cha, G. S.; Nam, H.; Analyst2001, 126, 1399.
12. Osborne, M. D.; Seddon, B. J.; Dryfe, R. A. W.; Lagger, G.; Loyall, U.; Schafer, H.; Girault, H. H.; J. Electroanal. Chem. 1996, 417, 5.
13. Wei, H.; Sun, J. J.; Xie, Y.; Lin, C. G.; Wang, Y. M.; Yin, W. H.; Chen, G. N.; Anal. Chim. Acta2007, 588, 297.
14. Chikae, M.; Idegami, K.; Kerman, K.; Nagatani, N.; Ishikawa, M.; Takamura, Y.; Tamiya, E.; Electrochem. Commun.2006, 8, 1375.
15. Collier, P. J.; Iggo, J. A.; Whyman, R.; J. Mol. Catal. A: Chem. 1999, 146, 149.
16. El-Deab, M. S.; Sotomura, T.; Ohsaka, T.; Electrochem. Commun.2005, 7, 29.
17. Ghamouss, F.; Tessier, P. Y.; Djouadi, A.; Besland, M. P.; Boujtita, M.; Electrochim. Acta2007, 52, 5053.
18. Lee, C. H.; Wang, S. C.; Yuan, C. J.; Wen, M. F.; Chang, K. S.;
Biosens. Bioelectron.2007, 22, 877.
19. http://www.pineinst.com/echem/viewproduct.asp?ID=46681, accessed in January, 2008.
20. Brett, C. M. A.; Kresak, S.; Hianik, T.; Brett, A. M. O.;
Electroanalysis2003, 15, 557.
21. Cheng, J.; Jandik, P.; Avdalovic, N.; J. Chromatogr., A2003,
997, 73.
22. Mizsei, J.; Lantto, V.; J. Nanopart. Res.2001, 3, 271. 23. Sasaki, S.; Kai, E.; Miyachi, H.; Muguruma, H.; Ikebukuro, K.;
Ohkawa, H.; Karube, I.; Anal. Chim. Acta1998, 363, 229. 24. Yang, Z.; Suzuki, H.; Sasaki, S.; Karube, I.; Anal. Lett.1997,
30, 1797.
25. Angnes, L.; Richter, E. M.; Augelli, M. A.; Kume, G. H.; Anal. Chem.2000, 72, 5503.
26. Lowinsohn, D.; Richter, E. M.; Angnes, L.; Bertotti, M.;
Electroanalysis2006, 18, 89.
27. Richter, E. M.; Augelli, M. A.; Kume, G. H.; Mioshi, R. N.; Angnes, L.; Fresenius J. Anal. Chem.2000, 366, 444. 28. Daniel, D.; Gutz, I. G. R.; Anal. Chim. Acta2003, 494, 215. 29. Daniel, D.; Gutz, I. G. R.; Electrochem. Commun.2003, 5, 782. 30. Cho, H. J.; Parameswaran, M.; Yu, H. Z.; Sens. Actuators, B
2007, 123, 749.
32. Westbroek, P.; De Strycker, J.; Dubruel, P.; Temmerman, E.; Schacht, E. H.; Anal. Chem.2002, 74, 915.
33. Yu, H. Z.; Anal. Chem.2001, 73, 4743.
34. Paixao, T. R. L. C.; Matos, R. C.; Bertotti, M.; Electrochim. Acta2003, 48, 691.
35. Richter, E. M., da Silva, J. A. F., Gutz, I. G. R., do Lago, C. L.; Angnes, L. Electrophoresis2004, 25, 2965.
36. da Rocha, J. R. C.; Ferreira, T. L.; Torresi, R. M.; Bertotti, M.;
Talanta2006, 69, 148.
37. British Pharmacopoeia, Her Majesty’s Stationery Office: London, 1993, Vol. I, p. 483.
38. Brazilian Pharmacopeia, 3rd ed., Organização Andrei Editora S.A: São Paulo, Brazil, 1977, p. 408.
Received: February 7, 2008 Web Release Date: September 29, 2008