0103 - 5053 $6.00+0.00
S
h
o
rt
R
e
p
o
rt
S
h
o
rt
R
e
p
o
rt
S
h
o
rt
R
e
p
o
rt
S
h
o
rt
R
e
p
o
rt
S
h
o
rt
R
e
p
o
rt
*e-mail: [email protected]
Identification and Antioxidant Activity of Several Flavonoids of
Inga Edulis
Leaves
Jesus N. S. Souza,
a,bEvaldo M. Silva,
a,bMilton N. da Silva,
cMara S. P. Arruda,
cYvan Larondelle
aand Hervé Rogez
*,ba
Unité de Biochimie de la Nutrition, Université catholique de Louvain & Institut des Sciences de la Vie, Croix du Sud, 2/8, B-1348 Louvain-la-Neuve, Belgium
b
Faculdade de Engenharia de Alimentos and cFaculdade de Química, Universidade Federal do Pará, Av. Perimetral s/n, 66075-750 Belém-PA, Brazil
Um extrato metanol-água das folhas de Inga edulis foi fracionado para identificar os compostos polifenólicos. Os compostos identificados foram o acido gálico, a catequina, a epicatequina, a miricetina-3-ramnopiranosídeo, a 3-glucopiranosídeo e a quercetina-3-ramnopiranosídeo. A capacidade antioxidante do extrato e dos polifenóis puros foi medida pelo teste ORAC e comparada com o teor em fenólicos totais (TP). O extrato bruto seco apresentou valores de ORAC (11.16 mmol TE perg) e TP (496.5 mg GAE per g) muito altos. Os compostos identificados foram responsáveis, respectivamente, por 9.53 % e 12.10 % dos valores ORAC e de TP do extrato de folhas de Inga edulis.
A methanol-water extract of Inga edulis leaves was fractionated to identify the polyphenolic compounds. The identified compounds were gallic acid, catechin, epicatechin, myricetin-3-rhamnopyranoside, quercetin-3-glucopyranoside and quercetin-3-rhamnopyranoside. The antioxidant activity of the extract and of pure polyphenols was measured by the ORAC assay and compared with the Total Phenolic (TP) content. The dry crude extract presented very high values for ORAC (11.16 mmol TE perg) and TP (496.5 mg GAE perg). The identified compounds were responsible for 9.53 % and 12.10 % of the ORAC value and TP content of the Inga edulis
leaf extract, respectively.
Keywords: Inga edulis, antioxidant activity, polyphenols, ORAC assay
Introduction
Inga edulis Mart. (Leguminosae) is a tree widespread in the tropical secondary forest of the Amazonian Region and is known by the population for its sweet fruits. I. edulis leaves have been used in the folk medicine as anti-inflammatory and anti-diarrheic products.1
Polyphenols have received an increasing attention in the last decade, especially for their potential protective effects against degenerative diseases linked to oxidative stress.2-5 They can be divided into various classes on the
basis of their molecular structure.2, 6 HPLC coupled with
a UV-Vis diode array detector (DAD) has been a method of choice for the separation and quantification of polyphenols.7,8 However, the complete analysis of the
absolute structure and configuration of a polyphenol
requires techniques, such as 1H and 13C NMR spectroscopy,
mass spectrometry or X-ray diffraction.2
Several phenolic compounds have already been identified in different species of the genus Inga. Gallic and ellagic acids were isolated from the leaves of I. verna9
and three flavonoids (5,7,3´,4´-tetrahydroxy-3-methoxy-flavone; 6,3´,4´-trihydroxyaurone and 5,7,4´-trihydroxy-6,8-dimethylflavonone) were isolated from the roots of I. edulis.10 Methanol-water extracts from Inga leaves have
shown particularly high values, of both antioxidant capacity and polyphenolic content.1, 9
Several methods can be used to measure the antioxidant capacity of plant polyphenolic extracts. Among these, the Oxygen Radical Antioxidant Capacity (ORAC) assay is considered as a reference method.11 It
measures the antioxidant inhibition of peroxyl radical induced oxidations by H atom transfer and thus reflects the classical radical chain breaking antioxidant activity.11,12
quantify the Total Phenolic (TP) content, can be considered as another antioxidant method since the mechanism involved is an electron transfer aiming at neutralizing an oxidant species.11
The aim of this work was to fractionate the methanol-water extract of I. edulis leaves, in order to identify some of its major polyphenolic compounds and to evaluate their contribution to the antioxidant activity of the extract by using both the ORAC and the Folin-Ciocalteu assays.
Results and Discussion
Solid phase extraction (SPE) cartridge fractionation of the crude extract allowed separating four fractions. Table 1 presents the distribution of the antioxidant activity (ORAC and Folin-Ciocalteu values) among the four obtained fractions. Fractions 2 (eluted with 20% MeOH) and 3 (eluted with 60% MeOH) are clearly enriched in antioxidants, since the crude extract presented a content of 496.5 mg GAE per g of dry extract, while the fractions 2 and 3 showed 753.3 and 721.9 mg GAE per g of dry fraction, respectively. The particularly high values obtained for the crude extract in terms of both ORAC (11.16 ± 1.03 mmol Trolox Equivalent per g dry crude extract - mmol TE per g DCE) and TP assays (496.5 ± 75.3 mg gallic acid equivalents - GAE per g DCE) confirm the literature data for the Inga species.1, 9 The results
obtained with the two methods to evaluate the antioxidant capacity were highly correlated, when expressed per gram of dry fraction (DF). Such correlations between the TP and ORAC assays have already been observed for many other plant extracts.1,11 Interestingly enough, the
antioxidant capacity (TP and ORAC) of fractions 2 and 3 were similar when expressed per gram of DF (Table 1), indicating that the compounds present in these fractions contribute in a similar manner to the total antioxidant capacity of the extract.
Figure 1A presents a typical HPLC chromatogram of the crude methanol-water extract of I. edulis leaves. Detection was monitored at a range from 200 to 600 nm, but the selected chromatogram was recorded at 270 nm
(all phenolics) and 370 nm (flavonols).7, 8 Figure 1A shows
that all flavonols have retention time higher than 19 min, whereas almost all other phenolics elute earlier. Figures 1B and 1C show the HPLC chromatograms corresponding to the fractions 2 and 3 and reveal that fraction 3 contains the flavonolic compounds and the epicatechin, whereas fraction 2 is almost totally free of flavonols.
Table 1. Total phenolic (TP) and ORAC values of the dry crude extract (DCE) and fractions of I. edulis leaves obtained by SPE-C18 fractionation. Values are expressed as Gallic acid equivalent (GAE) or mmol of Trolox equivalent (TE) both per g of DCE and per g of dry fraction (DF)
TP ORAC
Fractions mg GAEper g DCE mg GAE per g DF mmol TE per g DCE mmol TE per g DF
Dry Crude Extract 0496.5 ± 75.3 11.16 ± 1.03
Fraction 1 0088.8 ± 16.2 0249.7 ± 37.9 01.60 ± 0.42 05.46 ± 0.26
Fraction 2 101.0 ± 7.8 0753.3 ± 57.8 03.29 ± 0.24 13.98 ± 0.77
Fraction 3 0322.6 ± 33.3 0721.9 ± 74.4 06.04 ± 0.32 14.63 ± 0.69
Fraction 4 006.4 ± 0.4 111.7 ± 7.2 00.24 ± 0.12 01.93 ± 0.22
Figure 1. Typical HPLC profile for crude extract (A), fraction 2 (B) and fraction 3 (C) of I. edulis leaves at 270 nm and 370 nm. Numbers corre-spond to the following identified compounds: 1, gallic acid (5.4 min); 2, catechin (13.8 min); 3, epicatechin (16.6 min); 4, myricetin-3-O-α -L-rhamnopyranoside (22.2 min); 5, quercetin-3-O-α-L-glucopyranoside (23.2 min).; 6, quercetin-3-O-α-L-rhamnopyranoside (25.2 min).
6 8 10 12 14 16 18 20 22 24 26 28 30 32 34 36 38 40
6 8 10 12 14 16 18 20 22 24 26 28 30 32 34 36 38 40
6 8 10 12 14 16 18 20 22 24 26 28 30 32 34 36 38 40
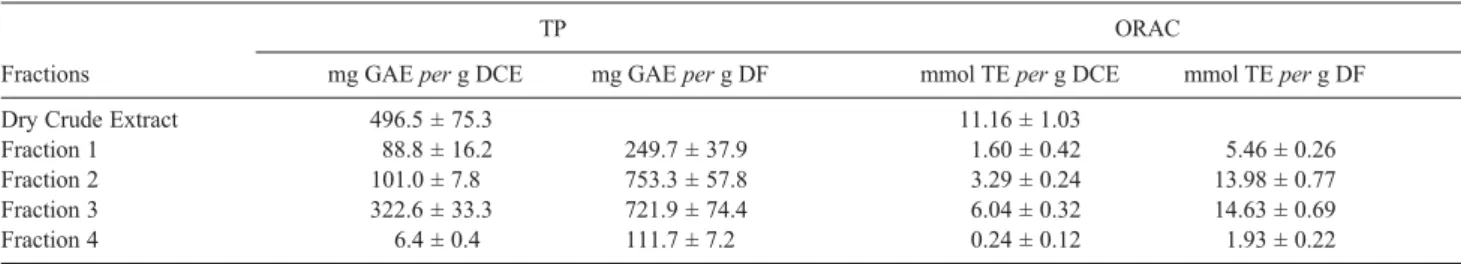
Semi-preparative HPLC of fractions 2 and 3 led to the isolation of the two major flavonoids (retention times (RT) of 16.6 and 22.2 min in the analytical HPLC, Figure 1A). These purified compounds were then submitted to 1H and 13C NMR spectroscopy, and were
identified, respectively, as epicatechin (3) and as myricetin-3-O-α-L-rhamnopyranoside (4), on the basis of a comparison of the spectral data to those previously reported in the literature and were confirmed though the co-elution with commercial standards.13-16
Addi-tional polyphenols were also identified, either by comparison of retention time and UV-Vis spectra with pure standards and co-elution HPLC tests after mixing of standards with the crude extract. These compounds are gallic acid (1) (RT of 5.4 min in Figure 1A), catechin (2) (RT of 13.8 min), quercetin-3-O-α -L-gluco-pyranoside (5) (RT of 23.2 min) and quercetin-3-O-α -L-rhamnopyranoside (6) (RT of 25.2 min). All identified compounds (Figure 2) were quantified in the DCE and their concentrations are given in Table 2 with their respective ORAC and TP values. Among these compounds, epicatechin, myricetin-3-O-α -L-rham-nopyranoside and catechin are the major phenolics and they presented, respectively, 25.43 ± 0.14, 16.51 ± 0.20
and 9.67 ± 0.80 mg per g DCE. ORAC values of myricetin-3-rhamnopyranoside and quercetin-3-glucopyranoside were presented for the first time and the ORAC values of the other compounds are in accordance with literature data.17, 18 The theoretical
contributions of these polyphenols to the total antioxidant capacity (ORAC or TP value) of the DCE were calculated on the basis of their concentration determined by HPLC analysis (Table 2). The sum of their theoretical contribution resulted in 1.06 mmol TE per g DCE for ORAC assay and 60.09 mg GAE per g DCE for TP content, which correspond, respectively, to 9.53 % and 12.10 % of the value measured in the crude extract (Table 1). A standard mixture of these identified polyphenols was prepared in the same proportion as in the DCE. This solution presented 1.53 mmol TE per g DCE for ORAC assay (13.7 %) and 55.10 mg GAE per g DCE for TP content (11.09 %).
In conclusion, the results confirmed the high antioxidant capacity of methanol-water extract from Inga edulis leaves. The additive contribution of the six compounds identified to the total antioxidant capacity represented more than 10 % of the total phenolics and ORAC value. Further studies are thus needed to complete the chemical characterization
Table 2. Concentration of polyphenols identified in the dry crude extract (DCE) of Inga edulis leaves and ORAC and TP values from standard compounds and theoretical contribution to DCE
Compoundsa Concentration TP valuec Theoretical contribution ORAC valued Theoretical contribution
in DCEb to the TP value of DCEc to the ORAC value of DCEd
1 00.82 ± 0.02 1.00 ± 0.00 00.82 1.37 ± 0.14 0.005
2 09.67 ± 0.80 1.15 ± 0.10 10.61 8.33 ± 1.02 0.240
3 25.43 ± 0.14 1.48 ± 0.06 34.83 8.54 ± 1.05 0.647
4 16.51 ± 0.20 0.83 ± 0.06 11.72 5.30 ± 0.91 0.150
5 00.51 ± 0.02 0.88 ± 0.10 00.41 6.34 ± 0.08 0.006
6 01.62 ± 0.08 1.18 ± 0.08 01.70 5.77 ± 0.67 0.017
Total 54.56 (10.99%)e 60.09 (12.10%)e 1.06 (9.53 %)e
aThe compounds are: 1, gallic acid; 2, catechin; 3, epicatechin; 4, myricetin-3-O-α-L-rhamnopyranoside;5, quercetin-3-O-α-L-glucopyranoside;6,
quer-cetin-3-O-α-L-rhamnopyranoside;bThe compounds were measured by HPLC, expressed as mg compound per g DCE; cMeasured by Folin-Ciocalteu
assay expressed as mg GAE (TP value) or mg GAE per g DCE (Theoretical contribution); dORAC values are expressed as µmol L-1of TE perµmol L-1
compound or mmol TE perg DCE (Theoretical contribution); ePercentage in relation of the value obtained from DCE.
Figure 2. Chemical structures of the flavonoids identified in I. edulis leaves: 2, catechin; 3, epicatechin; 4, myricetin-3-O-α-L-rhamnopyranoside; 5, quercetin-3-O-α-L-glucopyranoside; 6, quercetin-3-O-α-L-rhamnopyranoside.
O
OH
OH
O H
OH
R H
R
2R1= H, R2= OH
3R1= OH, R2= H 1 2
O
OH
OH
OR O
H
OH O OR
4R1=α-L-rhamnopyranoside, R2= OH
5R1=α-L-glucopyranoside, R2= H
6R1=α-L-rhamnopyranoside, R2= H 2
of the phenolics present in I. edulis leaves which contributes to the antioxidant activity. The potential role of the phenolic fromI. edulis leaves in the anti-inflammatory properties and other biological activities may be the subject of other investigations.
Experimental
Plant material
Inga edulis Mart was taxonomically identified by a pharmacognosy expert of the Botanical Museum “Emilio Goeldi” (Belem, State of Para, Brazil) comparing with a voucher specimen deposited in this herbarium (MG 0153192). The leaves of the plant to be studied were collected in Belem city. The leaf samples were carried to the laboratory directly after harvest and were cut in small pieces (49.9 ± 0.09 % of dry matter (DM)). They were then lyophilised for 48 h, milled until reaching a granulometry below 1 mm (94.5 ± 0.15 % of DM), and stored at -20 °C under N2atmosphere.
Extraction of the phenolic compounds
Lyophilised leaf samples were diluted in a methanol-water solution (50:50, v:v) in proportion of 1 g per 20 mL. The mixtures were agitated and then left for 1 hour in the dark at room temperature. The suspensions were filtered through a Whatman no 1 paper under vacuum and
concentrated in a rotary evaporator in order to eliminate the organic solvent. The aqueous solutions obtained were then cooled and lyophilised for 48 h (97.0 ± 0.35 % of DM). The dry crude extracts (DCE) were stored at -20 °C under N2 atmosphere until further processing or analysis. 1.5 mg DCE were dissolved in one milliliter acidified water (1 % formic acid) and poured on a SPE C18 column cartridge (Strata 55
µm, 70 A, 100 mg permL, Phenomenex, Torrance, CA). The polyphenolic compounds were eluted using increasing proportions of methanol in acidified water (1 % formic acid). Four fractions were separated. Fractions 1, 2, 3 and 4 were eluted with 0 % (0.26 mg obtained from 1.5 mg DCE), 20 % (0.39 mg), 60 % (0.77 mg) and 100 % (0.01 mg) methanol, respectively. Fractions 2 and 3 were further used for the isolation of specific phenolic compounds. The procedure was done in triplicate, and these results were expressed as a mean of this triplicate. Cartridges of 5g per20 mL had been used for attainment of bigger amount for isolation in semipreparative HPLC. All chemical solvents used were HPLC grade purchased from Merck (Darmstadt, Germany) and the polyphenol standards were from Sigma Chemical Co (St. Louis, MO) and Extrasynthese (Genay, France).
Analytical HPLC
The HPLC system employed was a Shimadzu system series LC-10Avp (Tokyo, Japan) equipped with a Class VP chromathography data station software, autosampler SIL-10AF, column oven CTO-10AS, and diode array detection system SPD-M20A to monitor all wavelengths in the range from 200 to 600 nm, with a scan rate of 1 nm. For the column, Gemini C18 (5 µm, 250 × 4.6 mm i.d.) joined with a Gemini C18 guard column (3.0 × 4.0 mm i.d.) (Phenomenex, Torrance, CA), was used at 30 °C. Gradient elution was performed with 1 % formic acid in ultra-pure water (solvent A) and acetonitrile (solvent B), delivered at a flow rate of 1.0 mL per min as follows: 8-35% B in 35 min, 35-100% B in 5 min and 100% B during 5 min. The gradient elution was followed by a 10 min post-run at initial conditions for equilibration of the column. All solvents were filtered through a 0.45 µm membrane filter prior to analysis. The injection volume for the extract was 20 µL.
Semi-preparative HPLC and identification
Phase reverse semi-preparative HPLC was conducted on a Varian HPLC/UV-Vis system (Las Vegas, NV) fitted with a Gemini C18 column (5 µm, 250 × 10 mm). In order to have enough mass to the RMN experiments (minimum of 10 mg of each compound), a repetitive chromatographic procedure was applied, as follows: thirty mg of fraction 2 or 3 diluted in 500 µL of an acetonitrile:acidified water (1% formic acid) (80:20, v:v) solution were injected and the elution process was performed in an isocratic way with the injection solution at a flow rate of 4.7 mL per min. In case of co-elution, the collected peaks were evaporated to dryness, redissolved in 500 µL of injection mixture containing 15% acetonitrile instead of 20%, and submitted to a second isocratic HPLC run with 15% acetonitrile. The isolated compounds were evaporated to dryness and respective mass were dissolved in 0.6 mL of methanol-d4. The 1H and 13C NMR spectra were obtained
using a Varian Mercury 300 NMR spectrometer (Las Vegas, NV) recorded at 300 and 75 MHz using the own solvent as internal standard.
Epicatechin (3)
1H NMR (300 MHz, methanol-d
4):G 2.49 (dd, J 15.9
and 8.4 Hz, Hβ-4), 2.84 (dd, J 15.9 and 5.4 Hz, Hα-4), 3.96 (m, H-3), 4.55 (d, J 7.5 Hz H-2), 5.91 (d, J 1.8 Hz, H-6), 5.84 (d, J 1.8 Hz, H-8), 6.75 (d, J 8.2 Hz, H-5’), 6.70 (dd, J 8.2 and 1.5 Hz, H-6’), 6.82 (d, J 1.5 Hz, H-2’).
13C NMR (75 MHz, methanol-d
4):G 28.5 4), 68.8
(C-2’), 116.1 (C-5’), 120.0 (C-6’), 132.2 (C-1’), 146.2 (C-3’ and C-4’), 156.9 (C-5), 157.6 (C-7), 157.8 (C-9).
Myricetin-3-O-α-L-rhamnopyranoside (4) 1H NMR (300 MHz, methanol-d
4):G 0.95 (d, J 6.0 Hz,
3’’-6’’), 3.3 – 3.8 (sugar-H), 4.23 (s, 2’’), 5.31 (brs, H-1’’), 6.19 (s, H-6), 6.35 (s H-8), 6.95 (s, H-2’ and H-6’). 13C
NMR (75 MHz, methanol-d4):G 17.6 (C-6’’), 71.8 (C-5’’), 71.9 (C-3’’), 72.0 (C-2’’) 73.3 (C-4’’) 94.6 (C-8), 99.8 (C-6), 103.5 (C-1’’), 105.8 (C-10), 109.5 (C-2’ and C-6’), 121.8 (C-1’), 136.2 (C-3), 137.8 (C-4’), 146.8 (C-3’ and C-5’), 158.4 (C-9), 159.4 (C-2), 163.1 (C-5), 165.8 (C-7), 179.6 (C-4).
Quantification
The amounts of phenolic compounds identified in the extract of the leaves were determined in triplicate using calibration curves generated with authentic standards. All standards were dissolved in methanol before injection in the analytical HPLC system. Their ranges of concentration used to generate the calibration curves were 0.7 to 15.0 mg perL for gallic acid, 2.5 to 75 mg per L for catechin and epicatechin, 2.0 to 200 mg per L for myricetin-3-rhamnopyranoside, quercetin-3-glucopyranoside and quercetin-3-rhamnopyranoside. The phenolic concentrations were expressed as mg of compound per g of DCE.
Determination of total phenolics
The concentration in total phenolics (TP) was determined by the Folin-Ciocalteu colorimetric method.19, 20
Results were expressed as mg of gallic acid equivalent (GAE)per both g of DCE and per g of dry fraction (DF).
ORAC assay
The antioxidant activity was measured using the ORAC assay, employing fluorescein as the fluorescent probe, as adapted by Silva et al.1 from the procedure
proposed by Ou et al.18to be used with a microplate reader.
The antioxidant activity by ORAC was expressed as mmol of Trolox equivalent (TE) per both g of DCE and perg of DF for the extract and fractions, or as µmol L-1 of TE for
the isolated compounds. All the analyses were done in triplicate at three concentration levels.
Supplemenatry Information
Supplementary data are available free of charge at http://jbcs.sbq.org.br, as PDF file.
Acknowledgments
This research was supported by the PIC program of the Coopération universitaire au développement (CUD, Belgium) and the Conselho Nacional de Desenvolvimento Científico e Tecnológico (CNPq, Brazil). J.S. is a research fellow of the Coordenação de Aperfeiçoamento de Pessoal de Nível Superior (CAPES, Brazil).
References
1. Silva, E.M.; Souza, J.N.S.; Rogez, H.; Rees, J.F.; Larondelle, Y.; Food Chem.2007,101, 1012.
2. Havsteen, B.H.; Pharmacol. Ther.2002,96, 67.
3. Martin, S.; Andriantsitohaina, R.; Ann. Cardiol. Angeiol. (Paris) 2002,51, 304.
4. Noguchi, C.; Niki, E.; Free Radical Biol. Med.2000,28, 1538. 5. Nunez-Selles, A.J.; J. Braz. Chem. Soc.2005,16, 699. 6. Rice-Evans, C.A.; Miller, N.J.; Paganga, G.; Free Radical Biol.
Med.1996,20, 933.
7. Tsao, R.; Yang, R.; J. Chromatogr., A2003,1018, 29. 8. Sakakibara, H.; Honda, Y.; Nakagawa, S.; Ashida, H.;
Kanazawa, K.; J. Agric. Food Chem.2003,51, 571. 9. Vivot, E.; Munoz, J.D.; Cruanes, M.D.; Cruanes, M.J.; Tapia,
A.; Hirschmann, G.S.; Martinez, E.; Di Sapio, O.; Gattuso, M.; Zacchino, S.; J. Ethnopharmacol.2001,76, 65.
10. Correa, S.M.V.C.; Conserva, L.M.; Maia, J.G.S.; Fitoterapia 1995,66, 379.
11. Prior, R.L.; Wu, X.L.; Schaich, K.; J. Agric. Food Chem.2005,
53, 4290.
12. Davalos, A.; Gomez-Cordoves, C.; Bartolome, B.; J. Agric. Food Chem.2004,52, 48.
13. Balde, A.M.; Pieters, L.A.; Gergely, A.; Kolodziej, H.; Claeys, M.; Vlietinck, A.J.; Phytochemistry1991,30, 337.
14. Morimoto, S.; Nonaka, G.; Nishioka, I.; Ezaki, N.; Takizawa, N.;Chem. Pharm. Bull.1985,33, 2281.
15. Addaemensah, I.; Achenbach, H.; Phytochemistry1985,24, 1817. 16. Lu, Y.R.; Foo, L.Y.; Food Chem.1997,59, 187.
17. Huang, D.J.; Ou, B.X.; Hampsch-Woodill, M.; Flanagan, J.A.; Prior, R.L.; J. Agric. Food Chem.2002,50, 4437.
18. Ou, B.X.;Hampsch-Woodill, M.; Prior, R.L.; J. Agric. Food Chem.2001,49, 4619.
19. Singleton, V.L.; Rossi, J.A.; Am. J. Enol.Vit.1965,16, 144. 20. Singleton, V.L.; Orthofer, R.; Lamuela-Raventos, R.M.; Method.
Enzymol.1999,299, 152.
0103 - 5053 $6.00+0.00
S
u
p
p
le
m
e
n
ta
ry
I
n
fo
rm
a
ti
o
n
S
u
p
p
le
m
e
n
ta
ry
I
n
fo
rm
a
ti
o
n
S
u
p
p
le
m
e
n
ta
ry
I
n
fo
rm
a
ti
o
n
S
u
p
p
le
m
e
n
ta
ry
I
n
fo
rm
a
ti
o
n
S
u
p
p
le
m
e
n
ta
ry
I
n
fo
rm
a
ti
o
n
*e-mail: [email protected]
Identification and Antioxidant Activity of Several Flavonoids of
Inga Edulis
Leaves
Jesus N. S. Souza,
a,bEvaldo M. Silva,
a,bMilton N. da Silva,
cMara S. P. Arruda,
cYvan Larondelle
aand Hervé Rogez
*,ba
Unité de Biochimie de la Nutrition, Université catholique de Louvain & Institut des Sciences de la Vie, Croix du Sud, 2/8, B-1348 Louvain-la-Neuve, Belgium
b
Faculdade de Engenharia de Alimentos and cFaculdade de Química, Universidade Federal do Pará, Av. Perimetral s/n, 66075-750 Belém-PA, Brazil
Figure S2. 13C NMR spectra of the compound 3 (epicatechin).