Article
Printed in Brazil - ©2015 Sociedade Brasileira de Química0103 - 5053 $6.00+0.00A
*e-mail: [email protected]
Response Surface Methodology Applied in the Study of Emulsion Formulations
in the Presence of Leaves of Rosemary
(
Rosmarinus officinalis
L
.
) as a Source of
Natural Antioxidants
Thiago Claus,* Sylvio V. Palombini, Fabiana Carbonera, Ingrid L. Figueiredo, Makoto Matsushita and Jesuí V. Visentainer
Departamento de Química, Universidade Estadual de Maringá, Av. Colombo, 5790, 87020-900 Maringá-PR, Brazil
The use of synthetic antioxidants in human consuming products is in disuse due to health toxic related issues. The search for substances to substitute synthetic antioxidants boosts studies concerned with the findings of sources of natural antioxidants. Thus, the aim of this work was to evaluate the use of comminuted leaves of rosemary (Rosmarinus officinalis L.) as source of natural antioxidants for the lipid protection of different emulsion compositions using central composite rotary experimental design. The Oxitest analysis (oxidation test reactor) revealed rosemary to be an excellent source of antioxidants for emulsions, even with addition of low quantities, and the gain of induction point tripled. The oxygen radical absorbance capacity (ORACFL) results of
emulsion obtained separately for the hydrophilic and lipophilic phases showed that the presence of polar compounds was in higher concentration, about 500 more than of non-polar ones. The polar compounds are major responsible for the antioxidant action in the system.
Keywords: rosemary, emulsion, lipid protection, natural antioxidant, response surface methodology
Introduction
Many food products, cosmetics and medicines are prepared by the mixture of water and oil, it is called emulsion. The mixture between these two substances with different polarities is possible due to the action of emulsifiers.1-4 The
emulsion can be classified in two main groups: systems composed of droplets of oil suspended in an aqueous continuous phase are called oil-in-water (O/W) emulsions and systems composed of droplets of water dispersed in oil are classified as water-in-oil (W/O) emulsions. Mayonnaise and ice cream are examples of O/W emulsions, while butter and margarine are W/O emulsions.1,4
The presence of oil in the emulsion composition leads to oxidation reaction which directly influences the product shelf life.5 The more polyunsaturated the oil is, the more
susceptible it is to oxidative deterioration. Lipid oxidation is further accelerated by exposure to air, light, transition metals or heat during processing, resulting in diminished nutritional value and quality of foods, and formation of toxic compounds, off-flavors and off-odors.6
Significant improvements on the stability of products susceptible to lipid oxidation can be obtained by the use of antioxidant substances.7 The most important antioxidant
compounds used in food processing are butylated hydroxyanisole (BHA), butylated hydroxytoluene (BHT), propyl gallate (PG), and terc-butylhydroquinone (TBHQ),8
however their effects over health have been questioned.9,10
As alternative to synthetic antioxidant there are antioxidants derived from natural sources, as for example: vitamins, flavonoids, terpenoids, carotenoids and phytoestrogens. Such substances are considered safer once they are derived from nature and food used by men for some time.10 The
use of natural antioxidant for the inhibition of oxidative reactions in food are becoming more frequent, not only because they are safer but also because of their efficiency in such inhibition.11
Rosemary (Rosmarinus officinalis L.) is a rich source of antioxidant compounds and its major activity is mainly due to the presence of rosmarinic acid, which has more hydrophilic characteristics, and carnosic acid, which has more lipophilic ones (Figure 1).12,13
with preventive potential against the lipid oxidation.14,15
However, the use of rosemary for the improvement of food oxidative stability, not as an extract, is still little disseminated. Therefore, the objectives of this work were: to determine the efficacy of the use of rosemary as a barrier for lipid oxidation of different compositions of emulsion using an experimental design, to evaluate the product life gain using an equipment which allowed us to quickly verify the improvements of lipid protection (Oxitest® oxidation
test reactor) and to evaluate, separately, the total quantity of antioxidant compounds present in both hydrophilic and lipophilic emulsions phases using ORAC assay (oxygen radical absorbance capacity) to establish the relations between all the obtained results, using the fluorescein (FL) decay curve (ORACFL).
Experimental
Materials
The rosemary (Rosmarinus officinalis L.) was commercially acquired in the city of Maringá, Paraná state, Brazil. The leaves were separated from the stems, triturated in a knife mill and passed through a 0.177 and 0.500 mm sieve to ensure that particle size did not influence
the emulsification procedures. The samples were packed under vacuum in polypropylene bags and kept in a freezer at −18 °C.
The oil phase was degummed and bleached canola oil (Cocamar-Cooperativa Agroindustrial de Maringá). The aqueous phase was ultrapure water (Milli-Q system, Millipore Corp, Bedford). The emulsifier was Tween® 80
(Sigma-Aldrich, St. Louis).
Preparation of emulsions
The emulsions were prepared based in the work of Züge et al.16 For the production of 12.0 g of emulsion,
the fixed amount of 0.6 g of Tween® 80 was used in all
experiments. For the variable ingredients was used a central composite rotary design, generated by Design Expert 7 software to optimize variables associated with mass of rosemary comminuted leaves, ratio W/O (water/canola oil) and time of extraction (magnetic stirring of the rosemary in canola oil) with 4 replicates in central point, leading to 18 experiments. The ingredients were mechanically stirred (4000 rpm) in test tube using a Vixar Vortex Mixer (Model KMC-1300V), during 3 min at 20 °C. The range and levels of variables used to prepare the emulsions are listed in Table 1.
Tests of oxidation
The emulsion oxidation tests were performed followed the method described by Claus et al.11 using a reactor called
Oxitest® (Velp Scientifica, Usmate), equipped with two
separated oxidation chambers. The sample of interest was placed in a chamber, then this system was sealed, heated to a certain temperature and oxygen was injected into the chamber to achieve a pre-defined oxygen pressure. When the oxygen has been added the chamber was electronically locked and the analysis begins. Any oxidizable compound will react with the oxygen in the chamber thus reducing the gas pressure inside the chamber. The pressure in the chamber is monitored throughout the procedure and the induction point (IP) of the sample was obtained using the two-tangent method. If a compound which delays sample oxidation is added to the system the latency to a measurable
HO
HO
O
O
COOH OH
OH
OH
HO HOOC
Rosmarinic acid
Carnosic acid
Figure 1. Chemical structures of major antioxidant compounds in rosemary.
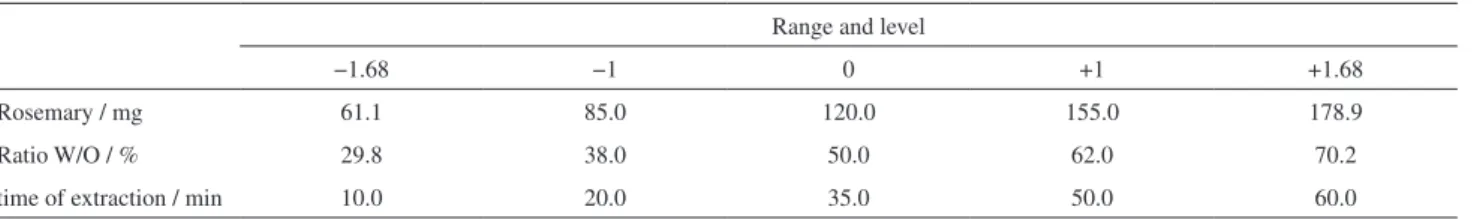
Table 1. Experimental range and levels of variables used to prepare the emulsions
Range and level
−1.68 −1 0 +1 +1.68
Rosemary / mg 61.1 85.0 120.0 155.0 178.9
Ratio W/O / % 29.8 38.0 50.0 62.0 70.2
decrease in oxygen pressure will be increased. The Oxitest®
method thus offers an efficient method of assessing the ability of a given compound to delay or inhibit the oxidation of a given substrate. All tests for this study were performed at a temperature of 90 °C with an initial oxygen pressure of 625 kPa, 99.9999% purity. Approximately 12.0 g of emulsion was used in each test.
ORACFL
The ORACFL assays were performed in a Perkin Elmer
fluorescent microplate reader (Victor® X4 Multilabel
Plate Reader) using a 96-well black microplate in which excitation/emission was measured from the top of the plate. The hydrophilic and lipophilic fractions were separated for the ORACFL analysis. All the samples were centrifuged
at 6000 rpm for 10 min. The superior phase (lipophilic) was used for the L-ORACFL assay and the inferior phase
(hydrophilic) was used for the H-ORACFL assay.
Dilution tests were performed to ensure that analytical signals were within the linear range of the calibration curve constructed with Trolox standard. The results of the H-ORACFL e L-ORACFL were calculated using linear
regression (y = ax + b) between Trolox concentration (µmol L-1) and the net area under the fluorescein (FL)
decay curve according to Prior et al.17 The area under
the curve (AUC) was calculated using the following equation 1, where is the initial fluorescence intensity and is the fluorescence intensity at n time. The net AUC value is obtained by subtracting the area under the fluorescence decay curve (AUC) of the blank from that of a sample or standard.18 All results obtained in the antioxidant capacity
analysis were expressed as µmol TE g-1 of the emulsion.
f n+1( )
f1 f2
AUC = 1
f0 f0 f0
+ + + … +
(1)H-ORACFL
For the hydrophilic extracts, sample solutions were diluted with acetone/water/acetic acid (70:29.5:0.5, v/v/v) to the proper concentration range for the standard curve. Trolox standards were prepared with the same solution acetone/water/acetic acid as well as the blank for H-ORACFL assay.
A 20 µL aliquot of the diluted samples was added to each well to the microplate followed by 200 µL of 95.7 nmol L-1 fluorescein sodium salt solution.17 The
microplate was inserted into the equipment for 5 min to stabilize the temperature at 37 ºC. Then, 75.0 µL of 2,2-azobis(2-amidino-propane) dihydrochloride (AAPH)
solution, diluted in 0.075 mol L-1 phosphate buffer (pH 7.0)
with a concentration of 8.6 mg mL-1 was added to each well.
Readings were initiated immediately at 1 min intervals for 30 min. The wavelengths of excitation and emission were 485 and 515 nm, respectively.
L-ORACFL
For the L-ORACFL assay, 0.050 g of lipophilic
phase was diluted in 1.5 mL of acetone and 4.5 mL of randomly methylated β-cyclodextrin (RMCD), prepared with 7% RMCD solution in acetone/water (50:50, v/v). An appropriate concentration was used to be within the standard curve linear range. The 7% RMCD solution was used as a blank and to dissolve the Trolox standards for the lipophilic assay. The procedure for L-ORACFL assay
was similar to that described for H-ORACFL, but the
concentration of AAPH solution was added to each well was 17.2 mg mL-1.17
Statistical analysis
The experimental results generated by application of central composite design were analyzed by the Design-Expert 7 software (Stat-Ease Inc.). The response was adjusted to the factors through multiple regressions. Model fit quality was evaluated by analysis of variance (ANOVA) and determination coefficients.
Results and Discussion
Preliminary experiments show important details of emulsion behavior during lipid oxidation tests and the curves obtained by Oxitest® are shown in Figure 2. The
emulsion used as blank (curve 1 in Figure 2) was prepared with equal quantities of water and oil (6 g) without rosemary addition, working as a reference and comparison parameter for the other tests. The curve 2 was obtained for an emulsion prepared with higher amounts of water relative to the quantity of oil (9 g water to 3 g of oil) and curve 3 for the emulsion with a higher concentration of oil (9 g oil to 3 g of water). The curve 4 was obtained for the pure canola oil used to prepare the emulsions. For curves 5 and 6 were added 2 g of rosemary, but with different granulometry, 0.500 and 0.177 mm, respectively. The induction point (IP) is achieved by the two-tangent method, as shown in curve 6 in Figure 2.
comparing these results it is noticed that the presence of water accelerates the degradation of the lipid canola oil and the higher the water concentration in the emulsion, the lower the point of induction, this is, the lipids oxidize more easily. The reason may be allied to that reported by Yi et al.19 who state that increasing oil surface area
in contact with oxygen, it makes the lipid degradation accelerate.
The presence of antioxidants from rosemary slowed the oxidation of emulsions. The curve 5 resulted in a 772 min IP while the curve 6 had the highest IP, 1467 min. It was also shown that, the smaller the particles of rosemary inserted, the greater the availability of antioxidants, due to
the increased contact area. The gain in the induction period was significant and, for the conditions of curve 6, the IP was three times the blank emulsion. The results of this initial part of the study show that rosemary is a promising source of antioxidants to be used in emulsion systems.
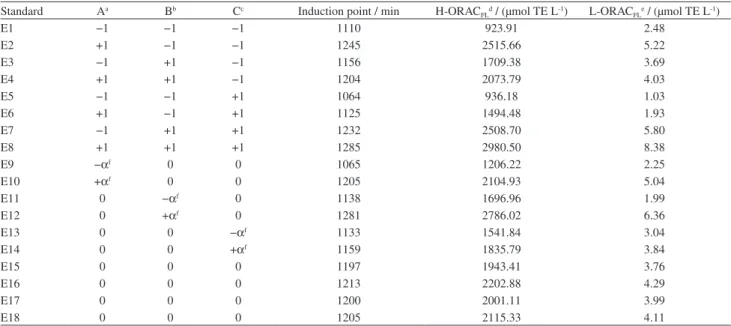
Table 2 shows the results of the IPs, H-ORACFL
and L-ORACFL obtained by planning experiments. The
concentration of antioxidant present in the aqueous phase was an average of 500 times greater than in the lipid phase. The tendency of sources of natural antioxidants, particularly fruits and vegetables, to have a larger amount of hydrophilic in comparison to lipophilic antioxidants was reported in studies by Wu et al.20 The possibility of polar antioxidants
be responsible for protecting the lipids, or non-polar phase, was approached by researchers and the effect was described as “polar antioxidant paradox”.21,22 The tendency of polar
antioxidants extracted by water to be playing the role of protective agents against lipid oxidation was also displayed in this work.
With the results generated by application of the experiments defined by central composite design, were fitted polynomial functions to describe the behavior of the data. Analysis of variance was used to access the quality of mathematical models fitted, thus not only the variables will be considered separately, but also the interactions involved.23 Multiple regression analysis was employed
upon all data and, among the models which were suggested by the software (linear, 2 FI, quadratic and cubic), the quadratic model was selected to IP, H-ORACFL and
L-ORACFL responses as the most suitable, because it has a
Figure 2. Curves obtained for the induction points (Oxitest®) of initial tests with the emulsions: 1: blank emulsion (6 g water to 6 g of oil); 2: oil-in-water emulsion (9 g water to 3 g of oil); 3: water-in-oil emulsion (9 g oil to 3 g of water); 4: canola oil; 5: emulsion with addition of 0.2 g of rosemary (0.500 mm); 6: emulsion with addition of 0.2 g of rosemary (0.177 mm). The induction point (IP) is achieved by the two-tangent method showed in curve 6.
Table 2. Results of IPs, H-ORACFL and L-ORACFL for each experiment planning
Standard Aa Bb Cc Induction point / min H-ORACFLd / (µmol TE L-1) L-ORACFLe / (µmol TE L-1)
E1 −1 −1 −1 1110 923.91 2.48
E2 +1 −1 −1 1245 2515.66 5.22
E3 −1 +1 −1 1156 1709.38 3.69
E4 +1 +1 −1 1204 2073.79 4.03
E5 −1 −1 +1 1064 936.18 1.03
E6 +1 −1 +1 1125 1494.48 1.93
E7 −1 +1 +1 1232 2508.70 5.80
E8 +1 +1 +1 1285 2980.50 8.38
E9 −αf 0 0 1065 1206.22 2.25
E10 +αf 0 0 1205 2104.93 5.04
E11 0 −αf 0 1138 1696.96 1.99
E12 0 +αf 0 1281 2786.02 6.36
E13 0 0 −αf 1133 1541.84 3.04
E14 0 0 +αf 1159 1835.79 3.84
E15 0 0 0 1197 1943.41 3.76
E16 0 0 0 1213 2202.88 4.29
E17 0 0 0 1200 2001.11 3.99
E18 0 0 0 1205 2115.33 4.11
high significance order and it is not aliased.24 The adjusted
models for IP, H-ORACFL and L-ORACFL, as well as their
ANOVA parameters, are listed in Table 3.
In the fitting of the three responses there are some experiments that behave as outliers (experimental data that exert disproportionate influence on the model). If these
experiments are removed of the data matrix, the fitted model can be improved. In this case, the results that not contribute to the adjustment of the models are: standard 3 for the IP, standard 8 for the H-ORACFL and both standard 3
and 8 for the L-ORACFL results. These results were chosen
as outliers based on the Cook’s distance. After the model
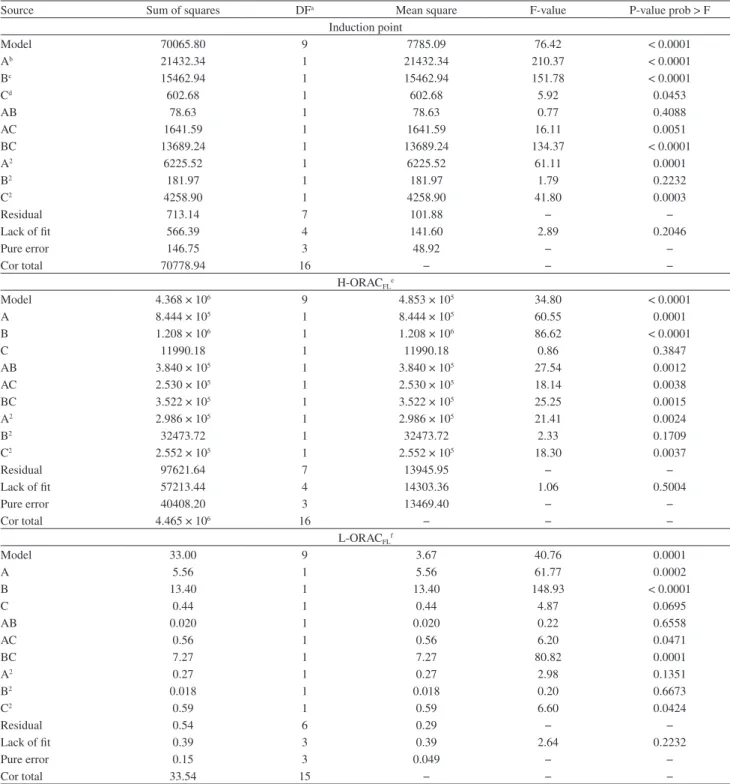
Table 3. Analysis of variance (ANOVA) and quadratic models for the obtained responses
Source Sum of squares DFa Mean square F-value P-value prob > F
Induction point
Model 70065.80 9 7785.09 76.42 < 0.0001
Ab 21432.34 1 21432.34 210.37 < 0.0001
Bc 15462.94 1 15462.94 151.78 < 0.0001
Cd 602.68 1 602.68 5.92 0.0453
AB 78.63 1 78.63 0.77 0.4088
AC 1641.59 1 1641.59 16.11 0.0051
BC 13689.24 1 13689.24 134.37 < 0.0001
A2 6225.52 1 6225.52 61.11 0.0001
B2 181.97 1 181.97 1.79 0.2232
C2 4258.90 1 4258.90 41.80 0.0003
Residual 713.14 7 101.88 − −
Lack of fit 566.39 4 141.60 2.89 0.2046
Pure error 146.75 3 48.92 − −
Cor total 70778.94 16 − − −
H-ORACFLe
Model 4.368 × 10⁶ 9 4.853 × 10⁵ 34.80 < 0.0001
A 8.444 × 10⁵ 1 8.444 × 10⁵ 60.55 0.0001
B 1.208 × 10⁶ 1 1.208 × 10⁶ 86.62 < 0.0001
C 11990.18 1 11990.18 0.86 0.3847
AB 3.840 × 10⁵ 1 3.840 × 10⁵ 27.54 0.0012
AC 2.530 × 10⁵ 1 2.530 × 10⁵ 18.14 0.0038
BC 3.522 × 10⁵ 1 3.522 × 10⁵ 25.25 0.0015
A2 2.986 × 10⁵ 1 2.986 × 10⁵ 21.41 0.0024
B2 32473.72 1 32473.72 2.33 0.1709
C2 2.552 × 10⁵ 1 2.552 × 10⁵ 18.30 0.0037
Residual 97621.64 7 13945.95 − −
Lack of fit 57213.44 4 14303.36 1.06 0.5004
Pure error 40408.20 3 13469.40 − −
Cor total 4.465 × 10⁶ 16 − − −
L-ORACFLf
Model 33.00 9 3.67 40.76 0.0001
A 5.56 1 5.56 61.77 0.0002
B 13.40 1 13.40 148.93 < 0.0001
C 0.44 1 0.44 4.87 0.0695
AB 0.020 1 0.020 0.22 0.6558
AC 0.56 1 0.56 6.20 0.0471
BC 7.27 1 7.27 80.82 0.0001
A2 0.27 1 0.27 2.98 0.1351
B2 0.018 1 0.018 0.20 0.6673
C2 0.59 1 0.59 6.60 0.0424
Residual 0.54 6 0.29 − −
Lack of fit 0.39 3 0.39 2.64 0.2232
Pure error 0.15 3 0.049 − −
Cor total 33.54 15 − − −
adjustment, ANOVA showed that the lack of fit obtained for the models was insignificant, meaning the models are suitable for evaluation of response surfaces.
The obtained model for IP analyses generated a F-test value of 76.42, indicating that such model is significant, because the sum of squares of the model is larger than the sum of square of the residual. A “Prob > F” value below 0.050 implies that its respective model term is significant. In this case, A, B, C, AC, BC, A2 and C2 are significant
model terms. However, the remaining terms also were considered for further steps, because they make part of model hierarchy, despite their low significances. The R2, adjusted R2 and coefficient of variation (CV) values
(0.9899, 0.9770 and 0.86%, respectively) also indicate that the obtained model is satisfactory, linear and precise.
For H-ORACFL analyses, the F-value from model
(34.80) indicates its significance. In this model, A, B, AB, AC, BC, A2 and C2 are significant terms. The R2, adjusted
R2 and CV values (0.9781, 0.9500 and 6.35%, respectively)
indicate good correlation for the obtained model, as well as its good linearity and precision.
ANOVA of L-ORACFL data showed a significant model
F-value of 40.76. The significant terms of this model are: A, B, AC, BC and C2. The R2, adjusted R2 and CV values
(0.9839, 0.9598 and 8.11%, respectively) also indicate that the obtained model is satisfactory, linear and precise. These adjustments led to the equations 2, 3 and 4 in terms of actual factors (A = rosemary, B = ratio W/O, C = time of extraction).
IP = 867.23 + 7.22 A – 7.96 B – 3.37 C – 0.03 AC + 0.27 BC – 0.02 A2 – 0.08 C2 (2)
H-ORACFL = – 4994.14 + 82.92 A + 17.32 B –
0.61 AB – 0.40 AC – 0.13 A2 – 0.64 C2 (3)
L-ORACFL = 3.70 + 0.08 A – 0.19 B – 6.26 AC +
7.87 BC – 9.82 C2 (4)
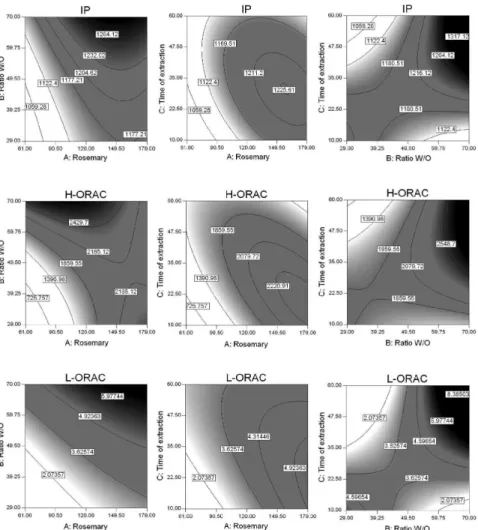
Positive signals indicate synergic effects in results, while negative signals indicate antagonic effects, as described by Neto et al.24 Figure 3 shows the contour
surface graphs for the executed analyses.
The similarity of the contour surfaces obtained for the results of IPs (top row in Figure 3) and H-ORACFL (middle
line in Figure 3) is clear and shows that the behavior of antioxidants present in the aqueous phase can be further combined with lipid protection. The highest observed results (dark part of charts) are in the region of greater concentration of water and a lower concentration of oil, with a maximum amount of rosemary adding about 140 mg. The extraction time factor has no significance for the model. The tendency of most lipid protection observed in emulsions with higher water concentrations can be linked to the fact that the polar phase extract the largest amount of rosemary antioxidants and thus allow them to act for a longer time, while protecting the lipid phase. However, the surface contour graphs also show that there are limits to the amount of antioxidant inserted in emulsions and, above a certain concentration; the pro-oxidant effect is displayed accelerating lipid degradation.
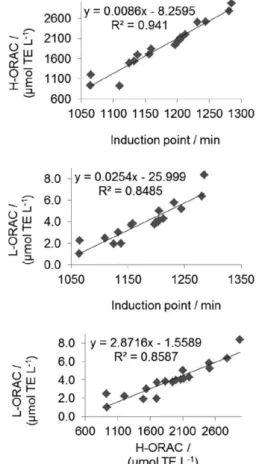
The correlation graphs of the results of analysis applied are shown in Figure 4. The highest value of R2 was obtained
for the IP versus H-ORACFL (R2 = 0.941) relation, also
demonstrating the higher lipid protection gain compared with the antioxidant polar.
Conclusions
Rosemary demonstrated to be an excellent source of antioxidants to the lipid protection of emulsions prepared with water, canola oil and Tween 80. The use of Oxitest®
was of major importance to assess the gain in the emulsions induction period and the responses obtained for systems with added rosemary were up to 3 times higher compared to blank, even inserting small amounts of this source of natural antioxidants.
The ORACFL assays applied separately for the
hydrophilic and lipophilic phases of emulsions allowed the best antioxidant activity tendencies interpretation of rosemary for the different phases. The results demonstrated that the hydrophilic compounds are present in higher concentration, about 500 times more than the lipophilic antioxidant compounds. The response surface charts and as well as the graphs of the correlations between the techniques applied, showed a strong tendency that the lipid protection of water/canola oil systems are related to the concentration of polar antioxidants.
Acknowledgements
The authors would like to thank CAPES for financial support and Cocamar-Cooperativa Agroindustrial de Maringá, for the donation of canola oil.
References
1. Lam, R. S. H.; Nickerson, M. T.; Food Chem. 2013,141, 975. 2. Kakran, M.; Antipina, M. N.; Curr. Opin. Pharmacol. 2014,
18, 47.
3. Gasparini, G.; Kosvintsev, S. R.; Stillwell, M. T.; Holdich, R. G.;
Colloids Surf. B Biointerfaces2008, 61, 199.
4. Santana, R. C.; Perrechil, F. A.; Cunha, R. L.; Food Eng. Rev.
2013, 5, 107.
5. Topuz, O. K.; Yerlikaya, P.; Ucak, I.; Gumus, B.; Büyükbenli, H. A.; Food Chem. 2014,154, 63.
6. Dwyer, S. P. O.; O’Kennedy, B. T.; Dwyer, P. O.; O’Beirne, D.; Ní Eidhin, D.; J. Food Sci. 2012, 77, 58.
7. Namal Senanayake, S. P. J.; J. Funct. Foods2013, 5, 1529. 8. Xiao-Gang, C.; Xiu-Qin, L.; Chao, J.; Yan-Yan, S.; Min-Li, Y.;
Food Chem. 2009, 113, 692.
9. Holaas, E.; Bohne, V. B.; Hamre, K.; Arukwe, A.; J. Agric. Food
Chem.2008, 56, 11540.
10. Kulawik, P.; Özogul, F.; Glew, R.; Özogul, Y.; J. Agr. Food
Chem. 2013, 61, 475.
11. Claus, T.; Maruyama, S. A.; Palombini, S. V.; Montanher, P. F.; Bonafé, E. G.; Santos Junior, O. O.; Matsushita, M.; Visentainer, J. V.; 2015, 61, 346.
12. Gallego, M. G.; Gordon, M. H.; Segovia, F. J.; Skowyra, M.; Almajano, M. P.; J. Am. Oil Chem. Soc. 2013, 90, 1559. 13. Sui, X.; Liu, T.; Ma, C.; Yang, L.; Zu, Y.; Zhang, L.; Wang, H.;
Food Chem. 2012, 131, 1399.
14. Couto, R. O.; Conceição, E. C.; Chaul, L. T.; Oliveira, E. M. S.; Martins, F. S.; Bara, M. T. F.; Rezende, K. R.; Alves, S. F.; Paula, J. R.; Food Chem. 2012, 131, 99.
15. Vallverdu-Queralt, A.; Regueiro, J.; Martinez-Huelamo, M.; Alvarenga, J. F. R.; Leal, L. N.; Lamuela-Raventos, R. M.;
Food Chem. 2014, 154, 299.
16. Züge, L. C. B.; Haminiuk, C. W. I.; Maciel, G. M.; Silveira, J. L. M.; Scheer, A. P.; J. Food Eng. 2013, 116, 72.
17. Prior, R. L.; Hoang, H.; Gu, L.; Wu, X.; Bacchiocca, M.; Howard, L.; Hampsch-Woodill, M.; Huang, D.; Ou, B.; Jacob, R.; J. Agric. Food Chem. 2003, 51, 3273.
18. Wu, C.; Duckett, S. K.; Neel, J. P. S.; Fontenot, J. P.; Clapham, W. M.; Meat Sci. 2008, 80, 662.
19. Yi, J.; Zhu, Z.; McClements, D. J.; Decker, E. A.; J. Agric. Food
Chem. 2014, 62, 2104.
20. Wu, X.; Beecher, G. R.; Holden, J. M.; Haytowitz, D. B.; Gebhardt, S. E.; Prior, R. L.; J. Agric. Food Chem. 2004, 52, 4026.
21. Kim, J. Y.; Kim, M.; Yi, B.; Oh, S.; Lee, J.; Food Chem. 2015,
176, 302.
22. Shahidi, F.; Zhong, Y.; J. Agric. Food Chem. 2011, 59, 3499. 23. Bezerra, M. A.; Santelli, R. E.; Oliveira, E. P.; Villar, L. S.;
Escaleira, L. A.; Talanta2008, 76, 965.
24. Neto, B. B.; Scarminio, I. S.; Bruns, R. E.; Como Fazer
Experimentos: Pesquisa e Desenvolvimento na Ciência e na
Indústria, 3a ed.; UNICAMP: Campinas, 2007.
Submitted: May 14, 2015