Printed in Brazil - ©2002 Sociedade Brasileira de Química 0103 - 5053 $6.00+0.00
Article
* e-mail: [email protected]
On the Information Content of 2D and 3D Descriptors for QSAR
Tudor I. Oprea
Office of Biocomputing, BSMB61, University of New Mexico School of Medicine, Albuquerque NM 87131-5196
Com o objetivo de melhor entender as informações paramétricas contidas em descritores bidimensionais (2D) e tridimensionais (3D), os escores de 87 descritores 2D e 798 variáveis 3D (ALMOND) obtidos de uma série de 5998 compostos de interesse em química medicinal, foram analisados através de análise de componentes principais. A fração de variância explicada (r2) e a validação cruzada (q2) para sete grupos, em duas componentes PLS, foram de 40%. Uma análise individual dos componentes, mostra que as duas primeiras PCs obtidas a partir dos descritores 2D estão relacionadas com a primeira e terceira PCs dos descritores 3D. A primeira componente 3D é explicada (61%) por descritores relacionados ao tamanho, enquanto que o conteúdo da terceira é essencialmente hidrofóbico, mas com pequena variância (25%). Surpreendentemente, descritores relacionados a ligações hidrogênio não contribuíram de forma significativa para a análise final. Estes resultados não permitem, a priori, a escolha de um método em detrimento de outro, quando da realização de estudos em QSAR.
To gain better understanding on the information content of two-dimensional (2D) vs. three-dimensional (3D) descriptor systems, we analyzed principal component analysis scores derived from 87 2D descriptors and 798 3D (ALMOND) variables on a set of 5998 compounds of medicinal chemistry interest. The information overlap between ALMOND and 2D-based descriptors, as modeled by the fraction of explained variance (r2) and by seven-groups cross-validation (q2) in a two PLS components model was 40%. Individual component analysis indicates that the first and second principal components from the 2D-descriptors are related to the first and third dimensions from the ALMOND PCA model. The first ALMOND component is explained (61%) by size-related descriptors, whereas the third component is marginally explained (25%) by hydrophobicity-related descriptors. Surprisingly, 2D-based hydrogen-bonding descriptors did not contribute significantly in this analysis. These results do not a priori justify the choice of one methodology over the other, when performing QSAR studies.
Keywords: ALMOND, cheminformatics, chemometrics, QSAR
Introduction
There are currently over 3000 molecular descriptors1
that can be used in QSAR (Quantitative Structure Activity Relationship) studies.2 Their application to QSAR has been
recently surveyed.3 Significant information about a QSAR
dataset can be extracted using 2D- (two-dimensional) descriptors, i.e., descriptors that do not use information related to the three-dimensional characteristics of model compounds. Most of these descriptors can be classified as:
i) Size-related: molecular weight – MW; calculated4
molecular refractivity – CMR; molecular volume and molecular surface area, pre-computed from tabulated values (e.g., using Van der Waals radii), etc.;
ii)Hydrophobicity-related: the logarithm of the octanol-water partition coefficient, LogP5 – besides CLOGP,6
several other LogP estimating programs are available;7
the π fragmental constant;8 the logarithm of the (molar) aqueous solubility9 ,10 (LogS
w); iii) Descriptors related to electronic effects: CMR; the (tabulated) estimated polarizability;11 Hückel-level estimates of the
highest-occupied, and lowest-unhighest-occupied, molecular orbitals; partial atomic charges based on electronegativity equilibration schemes;12 ,13 counts of positive or negative
ionic centers; etc; iv)Hydrogen bonding descriptors that estimate the basicity or acidity factors, e.g., the HYBOT14 ,15
or Abraham descriptors,16 or electro-topological (E-state)
descriptors,17 or counts18 of hydrogen bond acceptors or
donors; v) Topological descriptors19 derived from
The above types of descriptors have been successfully used to derive QSAR models for the past four decades. However, for the past 15 years, our ability to investigate the third dimension in a meaningful way, e.g., by analyzing conformers, has led to the development of 3D (three dimensional) QSAR methods.
Best represented by CoMFA23 (Comparative Molecular
Field Analysis) or by the combination of GRID24 and PLS25
(Partial Least Squares), 3D-QSAR methods26-28 try to explain
the variance in biological activity by monitoring variations in the 3D structures of chemical compounds. CoMFA, for example, attempts to relate molecular interaction fields, MIFs, of a series of molecules, to biological activity via PLS,25 thus matching differences or
similarities in the MIFs (steric and electrostatic are default) to differences or similarities in the biological activity. Quite early, the use of graphical analysis29 to evaluate
CoMFA-PLS results was recognized as the main strength of 3D-QSAR methods.
However, the value of 3D descriptors was put to question in the context of cheminformatics. As Brown and Martin have shown, simple (2D-based) substructure keys are more successful in grouping active compounds, compared to more elaborate 3D-based keys.30 Brown and
Martin went further to show that 2D-based descriptors are more useful in predicting LogP and pKa, compared to 3D descriptors.31 Yvonne Martin further discusses the balance
between 2D and 3D-QSAR models.32 However, LogP and
pKa are physico-chemical properties where the third dimension (conformational flexibility) bears little, if any, relevance. This is not the case for the vast majority of biological activities.
To gain better understanding on the information content of 2D vs. 3D descriptors, we analyzed principal component analysis (PCA) scores derived from SaSA33 and
ALMOND34 on a set of 5998 compounds of medicinal
chemistry interest.35 This paper discusses the relevance of
2D vs. 3D descriptors, in part discussed elsewhere,36 in the
absence of any property correlations (Y vectors).
Materials and Methods
SaSA descriptors
SaSA33 computes 72 descriptors starting from the 2D
structures. Size-related descriptors included MW, the number of heavy atoms, the number of carbons, and CMR.4
Polarizability is estimated by CMR and by an atom-based scheme.11 Flexibility and rigidity are estimated18 by
counting the total number of bonds, the number of rings and the number of rotatable bonds and the number of rigid
bonds, and by several topological indices that estimate other properties22 as well. The Wiener, Balaban, Randic
and Motoc indices, as well as the Kier and Hall suite of connectivity descriptors20 are also computed in SaSA.
Hydrogen-bonding capacity is estimated using HYBOT14
descriptors. Furthermore, SaSA uses simple counts for oxygen, nitrogen, H-bond donors and H-bond acceptors, positive and negative ionization centers, as well as the maximum positive and negative charge, as calculated using electronegativity methods.13
Additional 2D descriptors
For this dataset, hydrophobicity was estimated using two LogP methods: CLOGP6 (default in SaSA) and
Kowwin.37,38 LogS
w was estimated with Wskowwin 39,40 for
all compounds.
ALMOND descriptors
Based on previous work from the Clementi group,41
ALMOND34 computes MIFs for three GRID24 probes: the
DRY probe (hydrophobic), the carbonyl O probe (hydrogen bond acceptor) and the amide nitrogen (N1) probe (hydrogen bond donor). A fixed number of GRID points (nodes) are then selected from each MIF, according to the GRID energy level and to the inter-node distance between two nodes. The auto-correlogram is generated via MACC-2 (Maximum Auto- and Cross-Correlation),42 by storing
only the highest pair-wise product of interaction energies between all 2-node pairs, according to the inter-node distance. The results are then managed according to each MIF category, as discussed elsewhere.43 The three
auto-correlograms are: DRY-DRY (hydrophobic); O-O (hydrogen bond donor); N1-N1 (hydrogen bond acceptor). The three cross-correlograms are: DRY-O (hydrophobic and hydrogen bond donor); DRY-N1 (hydrophobic and hydrogen bond acceptor); O-N1 (hydrogen bond donor and hydrogen bond acceptor). 3D structures for the 5998 compounds were automatically generated with CORINA.44
ALMOND descriptors were generated using 133 variables per correlogram (798 variables in total), 50% field weight, and 0.8 smoothing window in MACC-2.
Statistical analysis
The 5998 2D structures were processed with SaSA,33
HYBOT,14 Kowwin38 and Wskowwin.40 Principal
component analysis using block scaling for the eighty-seven 2D descriptors was then performed using SIMCA.45
normalization (six blocks, 133 variables each), were performed using the ALMOND34 implementation of the
PCA method.
Six latent variables were modeled for both the 2D and 3D descriptor sets. These represented 78.3% of the explained variance for the 2D descriptors (in SIMCA), and 58.2% for the 3D descriptors (in ALMOND). The six PCA scores were extracted from both 2D and ALMOND descriptors for each compound, and the results were further analyzed in SIMCA.45 The degree of information overlap
between SaSA and ALMOND was evaluated by computing reciprocal PLS models: PCA scores from 2D descriptors were used as X-block, while the PCA scores from ALMOND were used as the Y-block (Table 1, top). Vice versa, the scores derived from ALMOND descriptors were used as the X-block to model the PCA scores obtained from 2D descriptors (Table 1, bottom). No centering, scaling or normalization was performed for these sets.
Results and Discussion
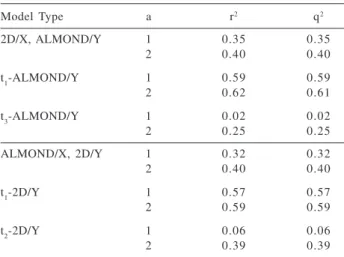
The PLS model overview presented in Table 1 illustrates the fact that there is a 40% overlap between ALMOND (3D) and 2D-based descriptors, as modeled by the fraction of explained variance (r2) and by
seven-groups36 cross-validation (q2) in a two PLS components
model. Individual component analysis indicates that the first and second latent variables from the 2D-descriptors PCA model are related to the first and third latent dimensions from the ALMOND PCA model, with a clear emphasis on the first component. Pair wise correlations between ALMOND and 2D components further support these results (see Table 2). The first PLS component in Table 1 can be explained by size-related descriptors, e.g., the total number of heavy atoms, molecular volume, molecular surface, MW, CMR and polarizability. These descriptors encode approximately 60% of the first ALMOND latent variable, mostly in a 1-PLS model (Table 1, top). This can be interpreted by the fact that large variability of inter-node distances and MIF energies dominate the first PCA component.
The third ALMOND latent variable has a weaker relationship (25%) to hydrophobicity descriptors such as CLOGP,6 Kowwin,38 LogS
w (Wskowwin
40), the non-polar
surface area, and the number of non-polar atoms.46 It is not
surprising that size- and hydrophobicity- related 2D descriptors are correlated to ALMOND descriptors, since the DRY probe is present in one auto- and two cross-correlograms.43 However, less than 25% of the ALMOND
fourth component appear to be related to 2D-based hydrogen bond descriptors such as HYBOT15 and the count
of nitrogens and oxygens (see Table 2). This is unexpected, since two auto-correlograms, N1-N1 (hydrogen-bond acceptor) and O-O (hydrogen bond donor), and one cross-correlogram (O-N1), are extracted from MIFs related to hydrogen bonding. The information extracted from these MIFs preserves directionality (3D orientation) and is region-based, i.e., it encodes information applicable to certain chemical moieties, not to the entire molecule. By contrast, HYBOT15 capacity factors are free energies
summed for the entire molecule. This may explain why ALMOND descriptors do not have a direct correspondent at the 2D level.
The second, fifth and sixth ALMOND principal components did not display any significant relationships to 2D-based descriptors (see Table 2). The PLS modeling summarized in Table 1 is further supported by mapping the fraction of explained variance (r2 values) of the pair wise
correlations between ALMOND and 2D components (Table Table 1. Information overlap between 2D and 3D (ALMOND) de-scriptors at the PCA score level for 5998 compounds, detailed for individual components. Insignificant r2 and q2 values were omitted; a is the principal component number
Model Type a r2 q2
2D/X, ALMOND/Y 1 0.35 0.35
2 0.40 0.40
t1-ALMOND/Y 1 0.59 0.59
2 0.62 0.61
t3-ALMOND/Y 1 0.02 0.02
2 0.25 0.25
ALMOND/X, 2D/Y 1 0.32 0.32
2 0.40 0.40
t1-2D/Y 1 0.57 0.57
2 0.59 0.59
t2-2D/Y 1 0.06 0.06
2 0.39 0.39
Table 2. Pair wise correlation (r2 values) between 2D- and AL-MOND (3D) descriptors, derived for the first six PCA scores for 5998 compounds
PCA score t1-2D t2-2D t3-2D t4-2D t5-2D t6-2D
t1-ALMOND 0.549 0.061 0.002 0.009 0.008 0.000
t2-ALMOND 0.000 0.001 0.118 0.022 0.012 0.009
t3-ALMOND 0.039 0.188 0.027 0.016 0.000 0.045
t4-ALMOND 0.007 0.165 0.003 0.000 0.013 0.001
t5-ALMOND 0.018 0.004 0.001 0.024 0.002 0.001
2). Similar results were obtained when comparing VolSurf47
descriptors (3D) to SaSA, as the first latent variable from both VolSurf and SaSA appeared to be significantly correlated.48 This further stresses the dominance of
size-related descriptors in the first latent variable.
Conclusions
While capturing similar information with respect to size, hydrophobicity, and polarizability, the 2D-based descriptors used in this study do not encode the same type of information as ALMOND (3D) descriptors, in particular information related to pharmacophoric patterns and hydrogen bonding. Designed with the virtual receptor site paradigm in mind,43 the ALMOND descriptor system relies
on statistical analyses such as PLS to appropriately select those variables that are relevant to ligand-receptor interactions. Therefore, the extraction of six principal components for a large set of compounds does not reflect the intended utility of this system. It does, however, point out that 3D descriptor systems encode different information, compared to 2D-based systems, since the information redundancy is around 40%. This partial information overlap between ALMOND and 2D descriptors does not justify a priori the choice of one methodology over the other when performing QSAR studies. Naturally, this choice becomes available a posteriori, when one or several classes of descriptors may be identified as statistically suitable to model the target property. It is therefore advisable to use both 2D- and 3D-based descriptors when modeling receptor-mediated events.36
Acknowledgments
Drs. Maria Mracec, Marius Olah, Liliana Ostopovici and Ramona Rad, from the Romanian Academy Institute of Chemistry, Timi oara, Romania, are acknowledged for assistance with the literature survey. Part of this work was performed at the AstraZeneca R&D Mölndal, Sweden.
References
1. Todeschini, R.; Consonni, V.; Handbook of Molecular
De-scriptors. Wiley-VCH: Weinheim, 2000.
2. Hansch, C.; Leo A.; Exploring QSAR. Fundamentals and
Ap-plications in Chemistry and Biology, ACS Publishers:
Wash-ington DC, 1995.
3. Livingstone, D.J.; J. Chem. Inf. Comput. Sci. 2000, 40, 195. 4. Leo, A.; Weininger, D.; CMR3. Daylight Chemical
Informa-tion Systems, Santa Fe, New Mexico; http:www.daylight.com,
accessed in September 2002.
5. Leo, A.; Chem. Rev.1993, 5, 1281.
6. Leo, A.; Weininger D.; CLOGP 4.0. Daylight Chemical
Infor-mation Systems, Santa Fe, New Mexico;
http:www.daylight.com, accessed in September 2002. 7. http://www.qsar.org/resource/software.htm, accessed in
Sep-tember 2002.
8. Hansch, C.; Fujita, T.; J. Am. Chem. Soc.1964, 86, 1616. 9. Ran, Y.; Jain, N.; Yalkowsky, S.H.; J. Chem. Inf. Comput. Sci.
2001, 41, 1208.
10. Livingstone, D.J.; Ford, M.G.; Huuskonen, J.J.; Salt, D.W.; J.
Comput.-Aided Mol. Des.2001, 15, 741.
11. Glen, R.C.; J. Comput.-Aided Mol. Des.1994, 8, 457. 12. Hinze, J.; Jaffe, H.H.; J. Am. Chem. Soc.1962,84, 540. 13. Hinze, J.; Whitehead, M. A.; Jaffe, H.H.; J. Am. Chem. Soc.
1963,85, 148.
14. Raevsky, O.A.; Grigor’ev, V.Yu.; Kireev, D.; Zefirov, N.S.;
Quant. Struct.-Act. Relat.1992, 11, 49.
15. HYBOT. TimTec Inc. Moscow, Russia, http://www.timtec.net/ software/hybot-plus.htm, accessed in June 2002.
16. Zissimos, A.M.; Abraham, M.H.; Barker, M.C.; Box, K.J.; Tam, K.Y.; J. Chem. Soc., Perkin 22002, 3, 470.
17. Kier, L.B.; Hall, L.H.; Molecular Structure Description: The
Electrotopological State. Academic Press: New York, 1999.
18. Oprea, T.I.; J. Comput.-Aided Mol. Des.2000, 14, 251. 19. Balaban, A.T.; SAR QSAR Environ. Res.1998, 8, 1. 20. Kier, L.B.; Hall, L.H.; Molecular Connectivity in
Structure-Activity Analysis. John Wiley: New York, 1986.
21. An analysis22 using over 200 topological indices on over 1000 diverse structures revealed that these descriptors are grouped in 18 clusters that can be related to size, bond information, and molecular complexity (among other properties). 22. Basak, S.C.; Balaban, A.T.; Grunwald, G.D.; Gute, B.D.; J.
Chem. Inf. Comput. Sci. 2000, 40, 891.
23. Cramer III, R.D.; Patterson, D.E.; Bunce, J.D.; J. Am. Chem. Soc.1988, 110, 5959.
24. Goodford, P.J.; J. Med. Chem.1985, 28, 849.
25. Wold, S.; Johansson, E.; Cocchi, M.; In 3D QSAR in Drug
Design: Theory, Methods and Applications. Kubinyi, H., ed.;
ESCOM: Leiden, 1993, pp 523-550.
26. Kubinyi, H.; 3D QSAR in Drug Design: Theory, Methods and
Applications. ESCOM: Leiden, 1993.
27. Kubinyi, H.; Folkers, G.; Martin, Y.C.; 3D QSAR in Drug Design. Volume 2. Ligand Protein Interactions and Molecular
Similarity, Kluwer/ESCOM: Dordrecht, 1998.
28. Kubinyi, H.; Folkers, G.; Martin, Y.C.; 3D QSAR in Drug
Design. Volume 3. Recent Advances, Kluwer/ESCOM:
Dordrecht, 1998.
29. Cramer III, R.D.; Wold, S.B.; US pat. 50253881991. (CAN: 115:135113)
30. Brown, R.D.; Martin, Y.C.; J. Chem. Inf. Comput. Sci. 1996,
31. Brown, R.D.; Martin, Y.C.; J. Chem. Inf. Comput. Sci. 1997,
37, 1.
32. Martin, Y.C.; In 3D QSAR in Drug Design. Volume 3. Recent
Advances. Kubinyi, H.; Folkers, G.; Martin, Y.C., eds.; Kluwer/
ESCOM: Dordrecht, 1998, pp 3-23.
33. Olsson T.; Sherbukhin V.; Synthesis and Structure
Administra-tion (SaSA), AstraZeneca, http://www.astrazeneca.com,
ac-cessed in September 2002.
34. Cruciani, G.; Fontaine, F.; Pastor, M.; ALMOND 3.0.
Multi-variate Informetric Analysis srl, Perugia, Italy; http://
www.miasrl.com, accessed in September 2002.
35. These structures were indexed from publications in J. Med.
Chem.1997, 40 (5203 structures) and J. Med. Chem.1998,
41 (795 structures).
36. Oprea, T.I.; InComputational Medicinal Chemistry and Drug
Discovery; Tollenaere, J.; De Winter, H.; Langenaeker, W.;
Bultinck, P., eds.; Marcel Dekker Inc.: New York, 2004, in press
37. Meylan, W.M.; Howard, P.H.; J. Pharm. Sci.1995, 84, 83. 38. Meylan, W.M.; Howard, P.H.; KOWIN 1.6. US EPA, http://
www.epa.gov/oppt/exposure/docs/episuitedl.htm, accessed in August 2002.
39. Meylan, W.M.; Howard, P.H.; Boethling, R.S.; Environ. Toxicol.
Chem.1996, 15, 100.
40. Meylan, W.M.; Howard, P.H.; Boethling, R.S.; WSKOWIN 1.4. US EPA, http://www.epa.gov/oppt/exposure/docs/ episuitedl.htm, accessed in August 2002.
41. Clementi, S.; Cruciani, G.; Riganelli, D.; Valigi, R.; Costantino, G.; Baroni, M.; Wold, S.; Pharm. Pharmacol. Lett.1993, 3, 5. 42. Clementi, M.; Clementi, S.; Clementi, S.; Cruciani, G.; Pastor, M. In Molecular Modeling and Prediction of Bioactivity.
Gundertofte, K.; Jørgensen, F.S., eds.; Kluwer Academic/Ple-num Publishers: New York, 2000, pp. 207-212.
43. Pastor, M.; Cruciani, G.; McLay, I.; Pickett, S.; Clementi, S.; J.
Med. Chem.2000, 43, 3233.
44. Sadowski, J.; Gasteiger, J.; Corina 2.6. Molecular Networks, Erlangen, Germany; http://www.mol-net.de, Accessed in June 2002.
45. SIMCA 9.0P. Umetrics AB, Umeå, Sweden; http:www.umetrics.com, accessed in August 2002.
46. Oprea, T.I.; SAR QSAR Environ. Res.2001, 12, 129. 47. Cruciani, G.; Crivori, P.; Carrupt, P.A.; Testa, B.; J. Mol. Struct.
(THEOCHEM), 2000, 503, 17.
48. Oprea, T.I.; Zamora, I.; Ungell, A.L.; J. Comb. Chem.2002, 4, 258.