0103 - 5053 $6.00+0.00
Article
* e-mail: [email protected]
Local Intersection Volume (LIV) Descriptors: 3D-QSAR Models for PGI
2Receptor Ligands
Rita C. A. Martins, Magaly G. Albuquerque* and Ricardo B. Alencastro
Instituto de Química, Universidade Federal do Rio de Janeiro, Cidade Universitária, CT, Bloco A, 21949-900 Rio de Janeiro - RJ, Brasil
Prostaciclina I2 inibe a agregação plaquetária pela interação com um receptor específico de membrana. Neste trabalho, desenvolvemos modelos de QSAR-3D para uma série de compostos heterocíclicos aromáticos usando como descritor o volume de interseção local. Os modelos obtidos podem ser aplicados no desenvolvimento de novos ligantes de receptor da PGI2 com potencial
atividade anti-agregante plaquetária.
Prostacyclin I2 inhibits platelet aggregation through specific binding to its membrane receptor. In
this work, we developed 3D-QSAR models for a series of aromatic heterocyclic compounds from literature using the local intersection volume descriptor. The models obtained can be applied to design new PGI2 receptor ligands with potential platelet anti-aggregating activity.
Keywords: 3D-QSAR, local intersection volume (LIV), prostacyclin receptor, platelet aggregation
Introduction
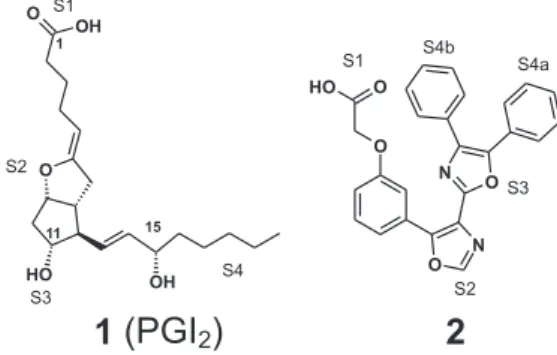
Prostacyclin I2 (PGI2) (Figure 1) is an endogenous
chemical mediator acting as a potent inhibitor of platelet aggregation, interacting with its specific receptor (IP)
located on cellular membranes.1-3 Under physiological
conditions, prostacyclin is a labile compound of limited
clinical usage,3 which has a half-life of approximately 3
minutes. In order to develop antithrombotic agents with
better pharmacokinetic profile, Meanwell and co-workers4-8
synthesized and evaluated a series of aromatic heterocyclic
compounds (see compound 2 in Figure 1).4-8 Based on
data from their research, we developed, in this work,
3D-QSAR models for ligands of IP receptor using the local
intersection volume (LIV) descriptor,9i.e., the intersection
volume between the volumes of the compound atoms and the volumes of a set of spheres of defined atom size. It composes a three-dimensional box, in analogy to the Grid
method.10 The LIV-3D-QSAR models were obtained and
evaluated by genetic algorithms (GA) and partial least
squares (PLS) methods.11-13 They can be applied to design
new PGI2 receptor ligands that could be potential inhibitors
of blood platelet aggregation.
Methods
Steps on the LIV-3D-QSAR models development
Step 1. Selection of 42 aromatic heterocyclic
compounds4-8 (see Table 1, Supplementary Material)
divided in a training data set (30 compounds) and a test data set (12 compounds). The corresponding values of the
biological activity4-8 according to the pharmacological
protocol established by Seiler and co-workers14 are shown
on Table 1.
Step 2. Construction of a grid matrix composed by cubic unitary cells, where the vertices of the cells
Figure 1. Structures of prostacyclin I21 and compound 24-8 and
correspond to the Cartesian coordinates of the eight carbon atoms. The vertices arrest lengths are 1.50Å (that is, almost equal to the carbon van der Waals radii of 1.54Å). The grid matrix is composed by a total of 2197 (13x13x13) carbon
atoms, constructed on an Excel® program, and imported
into the Insight II program15 (Figure 2, Supplementary
Material).
Step 3. The conformational analysis was performed applying the systematic search tool available in the PC
Spartan Pro v.1.0.516 using the MMFF force field.17 Default
options were used, including the maximum number of 100
conformations and a energy cutoff of 10 kcal mol-1 from
the minimum energy conformation found. The
conformations generated were optimized using the AM118
Hamiltonian. We excluded the more similar conformations for each compound according to the root mean square (RMS) deviation using all atoms superposition in the
Search_Compare module available in the Insight II
program.15 One conformation for each compound was
selected from this new set of conformations according to their lowest RMS values from the alignment with a
pre-selected conformation of PGI2 (see Supplementary
Material).
Step 4. On the alignment step, the molecules were inserted into the grid matrix according to RMS deviation
with the selected conformation of PGI2 as a reference
compound19 (see Step 3). The alignment rules are in
accordance with structure-activity relationship (SAR)
studies5,20 in which the pharmacophoric groups are labeled
as S1 (carbon atom of carboxylic acid group), S2 (oxygen atom of the endocyclic ring), S3 (oxygen atom of the hydroxyl group binding at C11), and S4 (hydrophobic chain), as can be seen in Figure 1.
Step 5. The volume for each hard sphere of the grid matrix was calculated using a radii length of 1.54Å x 0.65, where 0.65 is the scale factor used to avoid a large overlap among the spheres (although still allowing a small one), and, consequently, a minimal loss of volume among the hard spheres. The 42 compound volumes were calculated using the van der Waals radii without scale factors. Subsequently, the intersection volumes were calculated using the molecular volume of each compound and the volume of each hard sphere that composes the grid matrix. These intersection volumes are labeled as local intersection volumes (LIV), and represent the independent variables (volume descriptors) of the database (DB). All volumes
were calculated on the Search-Compare module of the
Insight IIprogram.15
Step 6. The LIV calculation generated a total of 2197 variables (or LIVs descriptors), in order to exclude data noise on the database, we reduced data so as to generate
three databases A, B, and C. DB-A, with 753 LIVs, was constructed from the original DB, excluding the variables in which LIV equals zero in all molecules; DB-B, with 438 LIVs, was constructed from DB-A, excluding the variables in which LIV is different from zero in three or less than three molecules; and BD-C, with 349 LIVs, was constructed from DB-B, excluding the variables in which LIV is different from zero in five or less than five molecules. In DB-A we exclude useless variables and in DB-B and DB-C we harmonize the data, removing variables that were not properly represented in the dataset. That meant we did take into account the structural peculiarities of a few compounds.
Step 7. In the model calculations a combined GA-PLS
analysis implemented in the Wolf 6.2 program11 was used.
We created 400, 100, and 100 randomly generated models for DB-A, DB-B, and DB-C, respectively. Initially, each model contained four independent variables. The mutation operator was set to 100% for each 10-crossover operation. The smoothing factor (the variable that controls the number of independent variables in the models) was set to 0.5 and the maximal number of components for the PLS regression analysis was set to three. We performed 35,000, 40,000, and 20,000 crossover operations for A, B, and DB-C, respectively. All other options were left in their default values.
Step 8. The ten best 3D-QSAR models as scored by the
“lack-of-fit” (LOF) measure13 from the GA-PLS analysis
were evaluated by “leave-one-out” (LOO) cross-validation
procedure13 using the Wolf 6.2 program.11 The test set was
used only for the external validation process.
Results and Discussion
The models 1, 2, and 3, described below, correspond to the best models from DB-A, DB-B, and DB-C, respectively. These models are composed of six independent variables (LIV) with the square of the coefficient of linear correlation
(R2) varying from 0.86 to 0.92 and R2 after cross-validation
(Q2), which means predictive capacity, varying from 0.73
to 0.84.
pIC50 = 5.03 + 0.93(LIV_434) + 0.31(LIV_554)
-- 0.20(LIV_737) + 16.29(LIV_1036) + + 2.63(LIV_1317) + 0.73(LIV_1491)
(N = 30; R2 = 0.88; Q2 = 0.78; S = 0.40; F = 22.97) Model 1
pIC50 = 5.10 + 1.36(LIV_434) + 0.78(LIV_541)
-- 0.66(LIV_603) -- 0.52(LIV_725) + + 0.79(LIV_1466) + 1.33(LIV_1504)
pIC50 = 4.93 + 1.04(LIV_434) + 0.57(LIV_541) -- 0.50(LIV_603) + 0.33(LIV_1332) + + 0.52(LIV_1478) + 1.01(LIV_1504)
(N = 30; R2 = 0.86; Q2 = 0.73; S = 0.44; F = 21.11) Model 3
We have chosen Model 2 as the best model for two
reasons: it is statistically better, presenting the highest Q2
value (Q2 = 0.84) and only two outlier compounds (Figure
3, Supplementary Material); and it is more comprehensive in a mechanistic sense, due the pharmacophoric groups that could be correlated to the selected LIVs (see subsequent discussion of Model 2). Model 1 has four outlier compounds and Model 3, even though with two outlier
compounds, has the lowest Q2 value (Q2 = 0.73). On Table
2, we show the compound numbering and the corresponding experimental, calculated (training set), and
predicted (test set) pIC50 residual values, plus the standard
deviation of residues for models 1, 2, and 3.
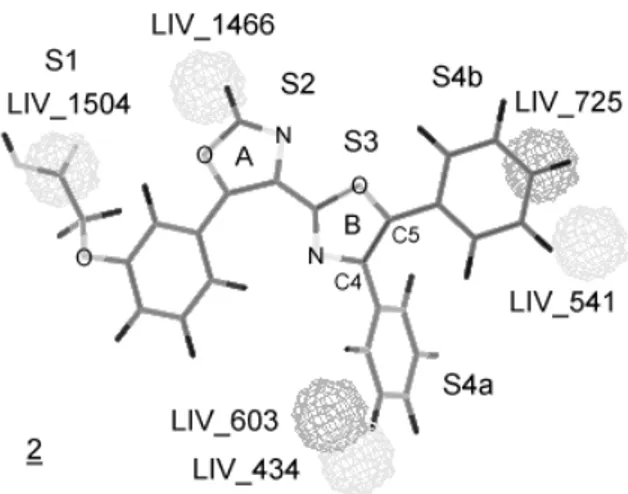
The graphic representation of maximum LIV for Model
2 is shown on Figure 4. We used compound 2, the most
active compound, as a template. Therefore, this figure does
not represent the LIV values for compound 2. LIV_1504
represents positive contribution on S1 site, however, due the relative conformational freedom of the carboxylic acid chain, not all compounds occupy this LIV. There is no correlation between any LIV descriptor and the pharmacophoric S2 and S3 sites on Model 2. LIV_1466 has positive contribution for the activity, even tough it does not correlate to any pharmacophoric site. On Figure 4, LIV_1466 looks as if it was close to the S2 site, but it is
not. This results from a three-dimensional figure being represented as two-dimensional.
LIV_434 and LIV_603 correspond to positive and negative contributions, respectively, on the S4b site; both
are located around the meta position of the phenyl ring.
The contribution degree of these LIVs depends on the relative orientation between this phenyl ring and the heterocycle B ring. The more perpendicular this orientation is, the greater the positive contribution will be; on the other hand, the more coplanar it is, the greater the negative contribution will be. But in an intermediate orientation both contributions will be observed. LIV_541 and LIV_725 correspond to positive and negative contributions, respectively, on the S4a site. LIV_541 is
located near the meta position of the phenyl ring and
LIV_725 is located near the para position of the same
phenyl ring, binding to the heterocycle B ring. Again, the contribution degree of these LIVs depends on the relative orientation between this phenyl ring and the heterocycle B ring. The more coplanar this orientation is, the greater the positive contribution (LIV_541) will be.
For compound 2, X-ray crystallographic studies by
Meanwell and co-workers7 describe a coplanar
arrangement among the heterocyclic A, and B rings, and the phenyl ring (binding at C5 position on B ring). According to these studies, when the coplanarity between the heterocyclic B and the phenyl ring is reduced (as in
compound 8) the activity decreases. These observations
corroborate the results described by LIV_541 on Model 2. As we can see on Table 2, there are two outlier
compounds for Model 2: compounds 4 and 39. Compound
4 is an unexpected outlier since the only difference between
it and 2 is a methyl group at the C2 position of its
heterocyclic A ring, and since they both have similar
activities. The residual value for compound 4 is –3.24
(calculated minus experimental pIC50); that is, the predicted
activity is lower than the experimental one. The difference
is that, for compound 4, LIV_725 (with negative
contribution) is 3.75, and it is 0.59 for compound 2.
Observing Figure 5, we can see that what causes the difference between the conformation of both compounds is the carboxylic acid chain orientation. Therefore, as the alignment procedure uses the C1 atom of this group, the overall relative orientation between these compounds is
slightly modified. This outlier behavior of compound 4
hinted that, even though this conformation was selected using the same criteria used for the other compounds in this work (see Methods, Step 4), it was not the best possible to describe the observed activity. In order to verify this
hypothesis, we used another compound 4 conformation,
and obtained a smaller residual value; in fact, with the use
of this new conformation, compound 4 stopped behaving as an outlier (data not shown).
Compound 39 has a residual value of 4.31 (Table 2);
that is, the predicted activity is greater than the experimental one, due to the large positive contribution of LIV_1466 and LIV_1504 (Figure 6, Supplementary Material).
Compound 2, as most of the other analyzed compounds,
has the heterocyclic A ring linking the heterocyclic B ring
to the phenoxy ring, with these two on a pseudo-cis
arrangement. On the other hand, compound 39 has a single
bond linking the heterocyclic B ring to the phenoxy ring. Hence, due to this higher conformational freedom, the relative orientation between these rings can be antiperiplanar or synclinal, the synclinal conformation corresponding to
the pseudo-cis arrangement. The selected conformation of
compound 39 (Figure 6) is synclinal (the torsion angle is
equal to 74.45°), which is better for the activity than the antiperiplanar, as may be seen by comparing the activities
Table 2. Experimental and calculated pIC50 values, residual values, and standard deviation of residues of Models 1, 2, and 3
pIC50 calculated Residue
Compounda pIC
50 exp Mod. 1 Mod. 2 Mod. 3 Mod. 1 Mod. 2 Mod. 3
2 7.57 7.50 7.20 7.24 -0.07 -0.37 -0.33
3 7.52 7.52 7.19 7.07 0.00 -0.33 -0.45
4 7.30 5.28 4.06 6.17 -2.02 -3.24 -1.13
5 7.00 7.06 6.93 6.80 0.06 -0.07 -0.20
6 6.89 6.73 7.26 6.89 -0.16 0.37 0.00
7 6.82 6.75 7.04 7.40 -0.07 0.22 0.58
8 6.80 6.89 7.64 7.43 0.09 0.84 0.63
9 6.74 6.65 6.84 6.95 -0.09 0.10 0.21
1 0 6.74 7.07 6.76 6.56 0.33 0.02 -0.18
1 1 6.60 4.94 6.64 6.15 -1.66 0.04 -0.45
1 2 6.38 6.51 6.54 6.78 0.13 0.16 0.40
1 3 6.35 6.31 6.05 6.15 -0.04 -0.30 -0.20
1 4 6.30 5.48 5.86 5.91 -0.82 -0.44 -0.39
1 5 6.19 7.50 7.20 7.24 1.31 1.01 1.05
1 6 6.18 6.18 6.26 6.33 0.00 0.08 0.15
1 7 6.12 6.09 5.93 5.83 -0.03 -0.19 -0.29
1 8 6.07 5.72 5.69 5.45 -0.35 -0.38 -0.62
1 9 6.06 5.17 5.86 5.54 -0.89 -0.20 -0.52
2 0 5.97 5.84 5.98 5.96 -0.13 0.01 -0.01
2 1 5.90 5.16 4.41 5.35 -0.74 -1.49 -0.55
2 2 5.85 5.43 5.50 5.70 -0.42 -0.35 -0.15
2 3 5.82 5.82 5.92 6.19 0.02 0.10 0.37
2 4 5.80 5.70 5.64 5.37 -0.12 -0.16 -0.43
2 5 5.78 5.03 5.65 5.58 -0.75 -0.13 -0.20
2 6 5.72 5.37 5.98 6.05 -0.35 0.26 0.33
2 7 5.68 5.90 6.24 5.78 0.22 0.56 0.10
2 8 5.54 6.98 6.32 6.33 1.44 0.78 0.79
2 9 5.52 5.39 5.86 5.51 -0.13 0.34 -0.01
3 0 5.44 5.68 5.06 5.34 0.24 -0.38 -0.10
3 1 5.30 5.03 5.10 4.93 -0.27 -0.20 -0.37
3 2 5.13 5.20 5.16 5.44 0.07 0.03 0.31
3 3 5.00 5.06 5.10 4.93 0.06 0.10 -0.07
3 4 4.95 6.66 5.96 6.42 1.71 1.01 1.47
3 5 4.91 5.14 4.89 5.02 0.23 -0.02 0.11
3 6 4.89 5.03 4.85 4.74 0.14 -0.04 -0.15
3 7 4.85 4.81 5.10 4.93 -0.04 0.25 0.08
3 8 4.80 5.60 5.02 5.29 0.80 0.22 0.49
3 9 4.77 6.91 9.08 8.35 2.14 4.31 3.58
4 0 4.75 5.37 5.11 4.94 0.62 0.36 0.19
4 1 4.61 4.77 4.38 4.39 0.16 -0.23 -0.22
4 2 4.53 5.03 5.10 4.93 0.50 0.57 0.40
4 3 4.22 4.60 4.52 5.26 0.38 0.30 1.04
sb 0.75 0.95 0.74
sc 0.33 0.27 0.35
a Compounds from the test set are underlined. b Standard deviation of residues for the entire group (training set and test set). c Standard deviation
of compounds 9 (cis isomer) and 36 (trans isomer) (Table
1). In our study, compound 39 behaves as an outlier because
of the synclinal conformation, while on the biological medium, the antiperiplanar is probably the predominant conformation. This also might explain why other analogs
of compound 39 with predominantly antiperiplanar
conformations are not outliers.
Conclusions
In this work, we developed 3D-QSAR models for
ligands of the IP receptor using the local intersection
volume (LIV) descriptor.9 The LIV is the intersection
volume between the volumes of the compound atoms and the volumes of a set of spheres of defined atom size, which compose a three-dimensional box. We obtained three LIV-3D-QSAR models by genetic algorithms (GA) and partial
least squares (PLS) methods,11-13 namely Model 1, Model
2, and Model 3, corresponding to the best models from databases A, B, and C, respectively.
Model 2 was chosen as the best model, since it has the
highest Q2 value (Q2 = 0.84) and only two outlier
compounds, and also because, in a mechanistic sense, it is more comprehensive, due the pharmacophoric groups that could be correlated to the selected LIVs. Observing the selected LIVs on Model 2, we can distinguish four with positive, and two with negative contributions to the biological activity. LIV_434, LIV_541, LIV_603, and LIV_725 are correlated to the pharmacophoric S4 site, and LIV_1504 to the S1 site. There is no correlation between any LIV descriptor and the pharmacophoric S2 and S3
sites. LIV_1466 does not correlate to any pharmacophoric
site. Compounds 4 and 39 are outliers for Model 2, probably
because the selected conformations were not appropriate to describe the observed activity.
In order to verify this hypothesis, we have used a different conformation for compound 4, and obtained a
smaller residual value for it. Thus, compound 4 with this
new conformation is not anymore an outlier on Model 2. We may thus conclude that, independently of further
analysis, Model 2 can still be applied to design new PGI2
receptor ligands with potential platelet anti-aggregating activity.
Acknowledgments
We thank the Brazilian agencies CAPES, CNPq and FAPERJ for their support. We also thank the Fundação Universitária José Bonifácio (FUJB) and the Conselho de Ensino para Graduados e Pesquisa (CEPG) da Universidade Federal do Rio de Janeiro (UFRJ) for a grant under the “Programa ALV/98”, Proc. No. 8436-1 (MGA).
Supplementary Material
Table 1, Figure 2, Figure 3 and Figure 6 available as Electronic Supplementary Information at: http:// www.sbq.org.br/jbcs/2002/vol13_n6/index.htm.
References
1. Collins, P.W.; Djuric, S.W.; Chem. Rev. 1993, 93, 1533. 2. Vane, J.R.; Botting, R.M.; Am. J. Cardiol. 1995, 75, 3A. 3. Campbell, W.B. In Goodman & Gilman’s the
Pharmacologi-cal Basis of Therapeutics; Gilman, A.G.; Rall, T.W.; Nies, A.S.;
Taylor, P., eds.; , 8th ed., Pergamon Press: New York, 1990, ch.
24.
4. Meanwell, N.A.; Rosenfeld, M.J.; Kim Wright, J.J.; Brassard, C.L.; Buchanan, J.O.; Federici, M.E.; Fleming, J.S.; Seiler, S.M.; J. Med. Chem. 1992, 35, 389.
5. Meanwell, N.A.; Rosenfeld, M.J.; Trehan, A.K.; Kim Wright, J.J.; Brassard, C.L.; Buchanan, J.O.; Federici, M.E.; Fleming, J.S.; Gamberdella, M.; Zavoico, G.B.; Seiler, S.M.; J. Med. Chem. 1992, 35, 3483.
6. Meanwell, N.A.; Rosenfeld, M.J.; Trehan, A.K.; Romine, J.L.; Kim Wright, J.J.; Brassard, C.L.; Buchanan, J.O.; Federici, M.E.; Fleming, J.S.; Gamberdella, M.; Zavoico, G.B.; Seiler, S.M.; J. Med. Chem. 1992, 35, 3498.
7. Meanwell, N.A.; Rosenfeld, M.J.; Romine, J.L.; Kim Wright, J.J.; Brassard, C.L.; Buchanan, J.O.; Federici, M.E.; Fleming, J.S.; Gamberdella, M.; Hartl, K.S.; Zavoico, G.B.; Seiler, S.M.;
J. Med. Chem. 1993, 36, 3871.
8. Meanwell, N.A.; Romine, J.L.; Rosenfeld, M.J.; Martin, S.W.; Trehan, A.K.; Kim Wright, J.J.; Malley, M.F.; Gougoutas, J.Z.; Brassard, C.L.; Buchanan, J.O.; Federici, M.E.; Fleming, J.S.; Gamberdella, M.; Hartl, K.S.; Zavoico, G.B.; Seiler, S.M.; J.
Med. Chem. 1993, 36, 3884.
9. Verli, H.; Albuquerque, M.G.; Alencastro, R.B.; Barreiro, E.J.;
Eur. J. Med. Chem. 2002, 37, 219.
10. Goodford, P.J.; J. Med. Chem.1985, 28, 849.
11. Rogers, D.; Wolf Genetic Funtion Aproximation Manual
ver-sion 6.2; Molecular Simulation Inc., USA, 1994.
12. Dunn III, W.J.; Rogers, D.; In Principles of QSAR and Drug
Design 1: Genetic Algorithms in Molecular Modeling; Devillers,
J., ed.; Academic Press: London, 1996, ch. 5.
13. Rogers, D. Hopfinger, A.J.; J. Inf. Comput. Sci.1994, 34, 854.
14. Seiler, S., Brassard, C. L., Arnald, A. J. Meanwell, N. A., Fleming, J. S.; Keely, Jr., S. L.; J. Pharmacol. Exp. Ther. 1990,
255, 1021.
15.Insight II User Guide; Molecular Simulations, Inc., San
Di-ego, USA, 1995.
16. Hehre, W.J.; Deppmeier, B.J.; Klunzinger, P.E.; PC Spartan
Pro 1.0.5; Program for molecular mechanics and quantum
chemical calculations; Wavefunction, Inc.; University of Cali-fornia, USA, 1999.
17. Halgren, T.A.; J. Comp. Chem.199617, 490.
18. Dewar, M.J.S.; Zoebisch, E.G.; Healy, E.F.; Stewart, J.J.P.; J.
Am. Chem. Soc. 1985107, 3902.
19. Martins, R.C.A.; Albuquerque, M.G.; Alencastro, R.B.;
Ab-stract of the XXVI Congresso Internacional dos Químicos
Teóricos de Expressão Latina, Caxambu, Brazil,2000.
20. Martins, R.C.A.; Albuquerque, M.G.; Alencastro, R.B.;
Ab-stract of the 24a Reunião Anual da Sociedade Brasileira de
Química, Poços de Caldas, Brazil,2001.